Abstract---Regularization of least squares estimation
method was proposed earlier in order to improve estimation of oxygen tension in retinal vessels and it was shown to be very effective. Optimum points for cost function of the regularized least squares (RLS) estimation were found using iterative methods which do not require considerable computations for small oxygen tension ( ) maps. However, as maps get larger, iterative solutions become computationally expensive. In this study, to find optimum points of the RLS cost functions of larger images, we propose an accelerated solution derived from closed form solution of the RLS cost function.
Index Terms---accelerated closed form solution,
regularized least squares estimation, retinal oxygen tension estimation.
I. INTRODUCTION
It was shown that, in many cases, there is a strong link between abnormal oxygenation of retinal tissue and common eye diseases [1]-[2]. In this regard, reliable estimation of oxygen tension in retinal vessels may be helpful in early diagnosis of the eye diseases. Estimation of retinal vessels oxygenation was obtained using phosphorescence lifetime imaging model (PLIM) [3]-[4]. In PLIM, for the estimation of the model parameters, a linear model proposed by Lakowicz et al. [5]is used.
Conventionally, to estimate oxygen tension in retinal vessels, the least squares (LS) estimation method was used [3]-[4]. Although it is computationally efficient, the LS estimation method produces high variance and artificial peaks in the estimates, and therefore gives values outside of the physiological range. In this respect, regularization of the LS estimation was proposed by Yildirim et al. [6] in order to overcome these shortcomings and utilize knowledge of the prior distribution of the parameters.
Regularization is utilized successfully in many fields such as image processing [7], biomedical imaging [8], and astronomical imaging [9]. Likewise, it was shown in [6] that the regularized least squares (RLS) estimation generates improved results compared with the LS estimation.
In their study [6], considering the physiology of retinal tissue [10] in which oxygen tension of a retinal vessel does not vary rapidly in a small neighborhood, Yildirim et al.
G. Gunay is with the Department of Electrical and Electronics Engineering, Bozok University, 66900, Yozgat, TR. (E-mail: ggunay@ itu.edu.tr).
I. Yildirim is with the Department of Electrical and Electronics Engineering, Istanbul Technical University, 34469, Maslak, Istanbul, TR. (E-mail: iyildirim@ itu.edu.tr).
I. Yildirim is also with Master of Engineering Department, University of Illinois, Chicago, 60607, IL, USA. (E-mail: [email protected]).
assumed that mean value of a pixel value in an oxygen tension map of retinal blood vessels is equal to the weighted average of oxygen tension values of its neighboring pixels.
This assumption was used as a base to form regularization term in the RLS cost function.
On the other hand, so as to obtain minimum of the cost function, they applied iterative methods and this approach requires heavy computation especially for large pO maps. Hence, fast algorithms are needed to handle large pO maps. Fast approaches have been developed for regularized estimation methods. K. C. Toh and S. Yun proposed an accelerated proximal gradient method to minimize a non-smooth convex regularized cost function [11]. In their study [12], J. Lampe and H. Voss proposed a fast algorithm for Tikhonov based regularized total least squares estimation problem. N. Mastronardi1, P. Lemmerling and S. Van Huffel provided a fast regularized total least squares algorithm for solving the basic deconvolution problem [13].
In this study, after deriving closed form solution for the RLS method, we propose a method to accelerate implementation of the RLS estimation. It was shown that the proposed method is much faster than the iterative solution and performs with negligible difference from the iterative solution on mean absolute error (MAE). Additionally, where such neighborhood relationship given in this problem is present, the approach derived in this study can be applied to other imaging problems.
II. PAST RLS ESTIMATION
In[6], for the lifetime imaging model parameter , the RLS cost function was defined as:
2, : , (1)
where Q 2, : is second row of the pseudo-inverse matrix of the system matrix, y is phosphorescence intensity observation vector of i-th pixel, β is the regularization parameter, and a stands for the mean value of the parameter to be estimated for the i-th pixel considering 3x3 neighborhood relation. As seen from the cost function (1), for a pixel, RLS estimate values of parameter is dependent of parameter values of its neighbors. This means that there is no pixel-wise isolated solution and the problem must be handled considering all pixels in the image. The cumulative cost function is as follows:
∑ , (2)
A Fast Regularized Least Squares Method for
Retinal Vascular Oxygen Tension Estimation
where, M denotes the total number of pixels. To find minimum points of the global cost function, a gradient-based iterative approach was used and the closed form solution was not provided in [6].
III. DERIVATION OF THE PROPOSED SOLUTION FOR THE RLS ESTIMATION
In the following expressions, images are handled in a vector form by reordering the matrix elements column wise. To derive the closed form estimation of these parameters, cost function of a defined in [6]for the i-th pixel can be rewritten as follows:
ɸ , : , (3)
where is the LS estimate of the parameter. M and S denote number of pixels in oxygen tension map and phosphorescence intensity observation number per pixel, respectively. Y is noisy observation of phosphorescence intensity for entire image. K defines neighborhood relation between pixels and formed considering for 3x3 window size (see Appendix). As can be seen from the cost function (3), for a pixel, the RLS estimate of the parameter is dependent of the parameter values of its neighbors. Therefore, any pixel isolated solution does not exist and a joint optimization is needed. Hence, we define the global cost function of a for all pixels as:
∑ ɸ
2
. (4)
Taking gradient of the cost function with respect to and equalizing the gradient to zero, we find the RLS estimate of
as follows:
. (5)
To simplify the notation, we define a new matrix L as:
, (6)
where I stands for the identity matrix.
Using the matrix L, the RLS estimate of the parameter can be rewritten in a simpler form as:
. (7)
Here it should be noted that in order to find the RLS estimate of the other model parameter [6], the same procedure described for the parameter is followed. Therefore, it will not be repeated for the parameter . In the formulation of the mean values of the parameters to be estimated in (3), weighting coefficients of 3x3 window were chosen considering geometrical distance from the pixel under interest. K is a symmetric positive definite and Toeplitz sparse matrix, due to the choice of this type of window.
Components of the matrix can be written as follows:
∑ ∑ . (8)
Since , 0 | | 1 (see Appendix), all
non-zero units of the matrix are within the 2R+2 range on the diagonal where R is number of rows in the
oxygen tension map. That is, 0 | |
2 2. Moreover, if 2 2 2 2,
then
| | , (9)
where f is a concave function having a maximum at zero. We see that if the first and last 2R+2 rows of the matrix are ignored, is a positive definite symmetric Toeplitz matrix. Additionally, since all matrices in L are in Toeplitz form except for the matrix , the matrix L also shares same properties with the matrix . That is, L is a purely positive definite symmetric Toeplitz matrix except for the first and last 2R+2 rows. Furthermore, since the matrix L possesses the mentioned properties, its inverse shares the same properties with it. Therefore, if a row between the first and last 2R+2 rows of the inverse of the matrix L is chosen, the inverse of the matrix L can be reconstructed with negligible differences in the first and last 2R+2 rows. When large pO images are under process, these mentioned properties of the matrix L and its inverse become very useful because inversion of the matrix L is almost impossible for large images. This is because for large pO maps, the size of L becomes extremely large. For example, for a 640x480 pO map, L is a 307200x307200 matrix which is impossible to take its inverse with regular computers. As a result, for large pO maps only iterative approaches become applicable in finding optimum points of the RLS cost function which also takes longer times. Additionally, we observed that the most significant coefficients in do not vary by reducing its dimension even extremely. Hence, after calculating a small and acquiring the most significant units in it, we can extend the solution to larger pO maps with negligible error. For example, if we find the matrix for 21x21 pO map and acquire the most significant weight coefficients in it, we can use them to obtain RLS estimates of the model parameters for much larger pO maps such as a 1024x1024 pO map or even much larger ones. Additionally, since the matrix has almost symmetric Toeplitz property, the problem solely becomes a mean average problem which is considerably easy in computational sense.
IV. RESULTS
In our experiments we used both simulated and real data. In simulations, we added an i.i.d. white Gaussian noise with 15, 20 and 25 dB SNR values to a 485x600 phantom given in Fig.1 for different scenerios.
Fig. 1- 485x600 phantom pO map. Color bar represents oxygen tension values in in mm-Hg
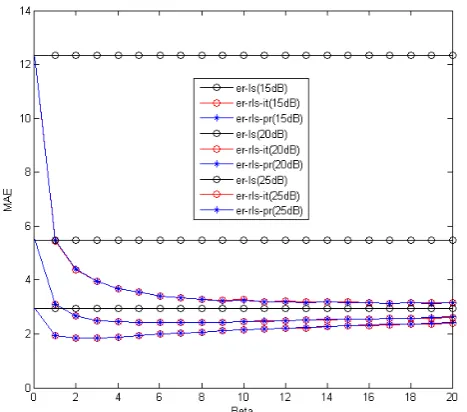
Fig. 2- MAE of the LS, iterative RLS (er-rls1), and the proposed RLS estimation (er-rls2) methods
[image:3.595.311.554.48.241.2]As for the proposed RLS method, we first derived the equations (3-8) for a 21x21 pO map that was quite sufficient to capture the relevant information for the 485x600 pO map. Following that, we found the which is a 441x441 matrix and then extended to the dimension required for the original image.
Fig. 3. Computation times in seconds of iterative RLS and proposed RLS estimation methods for different beta values
Computer system used in simulations is a standard notebook having Intel® Core™2 Duo2.27 GHz processor and 4 GB memory. In the simulations unless otherwise is stated, pre-set values of the β, window size and SNR are respectively 5, 3x3 and 20dB.
We compared mean absolute error (MAE) performances of the LS, iterative RLS and proposed RLS methods for different values of . It can be easily seen from the Fig.2
that there is a negligible difference between MAE performances of the iterative (er-rls1) and proposed RLS estimation (er-rls2) methods.
The performance of the LS method is much poorer than the other two methods especially for lower SNR values. However, if we look at Fig.3, we see that there is a significant difference in computation time performances of the iterative RLS and the proposed methods. The higher the values are, the more time the iterative RLS method takes. For a value 10, the iterative RLS method requires 40 seconds whereas the proposed RLS requires only less than 2 seconds. If the pO2 map to be estimated has higher dimensions, then the time difference between implementation of the both methods would be much more notable. Therefore, we can say that the proposed method is more preferable compared with the iterative one in the sense of computational complexity
[image:3.595.54.290.50.194.2] [image:3.595.54.288.230.436.2] [image:3.595.47.546.608.763.2]Fig. 5-pO map (120x85 pixels) of a rat generated using the LS(1), iterative RLS(2) and the proposed RLS(3) methods. The color bar represents oxygen tension in mm-H
In order to show artifacts of the LS estimation more clearly, we compared the results of the proposed and LS estimation methods in Fig. 4 for a frame shown with a rectangle in Fig. 1. As mentioned in [6], while the LS estimation results in spiky pO maps, the RLS estimation generates smoother pO maps whose values fall more in the physiologically expected range. MAE of the proposed RLS estimation method is 2.8 mm-Hg whereas MAE of the LS estimation method is 9.7 mm-Hg. We also used real pO maps (120x85 pixels) acquired from rat retina and obtained its estimates in Fig. 5 using the LS, iterative RLS and the proposed RLS methods. Both the iterative and proposed RLS methods generated pO2 maps which are smoother and the variation in their maps is more acceptable when compared with the result of the LS estimation method.
V. CONCLUSION
In the existing applications, maximum resolution of pO2 maps is 2 micron and typical pO frame size is around 256x80 pixels. However, to analyze small capillaries, imaging systems having more resolution and frame sizes are required. Therefore, fast RLS estimation methods will be needed. In this study, considering past work proposed by Yildirim et al., where optimization of the RLS cost function was made following iterative procedures, we derived a closed form solution to the RLS estimation of retinal oxygenation and using this solution, we proposed an RLS estimation procedure which is much faster than the regular closed form solution and the standard iterative methods.
APPENDIX
For a 3x3 interrelation window size, we assume that interrelation window for pixels in the image has coefficients as:
(A.1)
where l, p and q denote weight of pixel to itself, weight of direct adjacent pixels and weight of cross adjacent pixels to the pixel under consideration, respectively. In order for mean of the weighting window to be one, we equalize these coefficients as:
/ 4 ∗ ,
p / 4 ∗ ,
/ 4 ∗ , (A.2)
where. .
After defining l, p and q, we form the K as follows:
,
1 1 1 0
, (A.3)
where K(j,k) denotes weight coefficient of the kth pixel on
jth pixel on the image or vice versa, and R denotes the number of rows in the oxygen tension map.
REFERENCES
[1] V.A. Alder, E.N. Su, D.Y. Yu, S.J. Cringle, and P.K. Yu, “Diabetic retinopathy: Early functional changes”, Clin.
Exp.Pharmacol. Physiol., vol. 24, pp. 785–788, 1997. [2] B.A. Berkowitz, R.A. Kowluru, R.N. Frank, T.S. Kern,
T. C. Hohman, and M. Prakash, “Subnormal retinal oxygenation response precedes diabetic-like retinopathy”, Investigative Ophthalmology & Visual
Science, vol. 40, No. 9, pp.2110-5, 1999.
[3] M. Shahidi, A. Shakoor, R. Shonat, M. Mori, and N.P. Blair, “A method for measurement of chorio-retinal oxygen tension”, Curr. Eye Res., vol. 31, pp. 357–366, 2006.
[4] R D. Shonat and A.C. Kight, “Oxygen tension imaging in the mouse retina”, Ann. Biomed. Eng., vol. 31, pp. 1084–1096, 2003.
[image:4.595.57.546.50.197.2][6] I. Yildirim, R. Ansari, J. Wanek, I.S. Yetik, and M. Shahidi, “Regularized estimation of retinal vascular oxygen tension from phosphorescence images” IEEE
Transactions on Biomedical Engineering, vol. 56, no. 8, pp. 1989 – 1995, 2009.
[7] M.C. Hong, M.G. Kang, and A.K. Katsaggelos, “An iterative weighted regularized algorithm for improving the resolution of video sequences”, Proceedings of
the IEEE International Conference on Image Processing, vol. 2, pp. 474-477, 1997.
[8] W. Zhu, Y. Wang, Y. Deng, Y. Yao, and R.L. Barbour, “A wavelet-based multiresolution regularized least squares reconstruction approach for optical tomography”, IEEE Transactions on Medical
Imaging, vol. 16, pp. 210 – 217, 1997.
[9] R.A. Frazin, “Tomography of the solar corona, a robust, regularized, positive estimation method”, The
Astrophysical Journal, vol. 530, pp. 1026 – 1035, 2000.
[10] A. Shakoor, N.P. Blair, M. Mori, and M. Shahidi, “Chorioretinal vascular oxygen tension changes in response to light flicker”, Investigative
Ophthalmology & Visual Science, vol. 47, no. 11, pp. 4962-4965, 2006.
[11] K. C. Toh and S. Yun, “An accelerated proximal gradient algorithm for nuclear norm regularized linear least squares problems”, Pacific Journal of
Optimization, vol. 6 pp.615-640 2008.
[12] J. Lampe and H. Voss, “A Fast Algorithm for Solving Regularized Total Least Squares Problems”, Electronic
Transactions on Numerical Analysis, vol.31 pp.12-24, 2008.
[13] N. Mastronardi, P. Lemmerling and S. V. Huffel, “Fast regularized structured total least squares algorithm for solving the basic deconvolution problem”, Numerical