Exploring the Potential Benefits of Demand
Response in Small Data Centers
Cheng-Jen Tang, Miau-Ru Dai, and Chi-Cheng Chuang,
Abstract—Demand Response (DR) is often regarded as the killer application of the emerging smart grid. Recently, the rapidly growing Internet population aggrandizes the size and the number of data centers. The energy issues of data cen-ters have drawn a lot of attention lately. The programmable workload dispatching and scheduling of modern servers make data centers auspicious candidates with great potential for DR. However, studies of small data centers participating in DR pro-grams are still inadequate, since existing studies usually focus on energy efficiency issues for the large dedicated server farms. Besides large server farms, small data centers scattered in academic or research environments also consume considerable amount of energy. Unlike commercial data centers that must meet rigorous reliability and availability requirements, small data centers are typically not mission critical. Such data centers are the most likely prospects for participating in DR programs. This study examines the power consumption recorded by smart meters from an on-campus small data center, and explorers the potential benefits for small data centers participating in DR programs. In the end, this study finds that the potential achievable DR power reduction of all on-campus small data centers in Taiwan can be in the range of 10.8 MW to 27 MW.
Index Terms—Smart Grid, Smart Meter, Demand Response, Data Center, Power Reduction.
I. INTRODUCTION
T
HE DR demand controls are temporary actions in responding to a DR event, which is triggered on par-ticular hours when reserve margins are low or when genera-tion/electricity cost is high. Customer response to incentives is an important tool for DR program providers to resolve reserve shortages, or to manage their costs of supplying electricity. Within all the electricity demanding sectors, the energy usage of data centers draws a lot of attention lately. An EPA (Environmental Protection Agency of U.S.) study [1] indicates that energy consumption by servers and data centers doubled from 2000 to 2005, and could be more than 100 billion kWh, representing a $7.4 billion annual electricity cost, by 2011. Ghakitar et al.[2] also find that data centers, on the basis of their operational characteristics and energy use, have significant potential for DR.Many organizations have multiple small data centers with different targeted applications scattered around their facilities for various groups of users. Lorenz [3] indicates that small data centers waste more energy than larger consolidated facilities. The power consumption of small data centers is often overlooked, because the energy cost of an individual
Manuscript accepted January 12, 2013; Camera-ready submitted January 27, 2013.
C.-J. Tang is with the Department of Electrical Engineering, Tatung University, Taipei, 104 Taiwan e-mail: [email protected].
M.-R. Dai is a Ph.D. candidate in the Graduate Institute of Com-munication Engineering at Tatung University, Taipei, 104 Taiwan e-mail: [email protected].
C.-C. Chuang is with Smart Network System Institute, Institute for Information Industry, Taipei, 105 Taiwan e-mail: [email protected]
data center usually accounts for just a relatively small portion of total spending. DR incentives are the major lodestone for encouraging facility managers to evaluate the power usage of their small data centers, if the DR participation of small data centers could be enabled with little investment. Therefore, this paper presents an analysis of the possible potential and required installations of small data centers participating in DR programs based on the real data recorded from a small data center and its setups.
II. BACKGROUND
A U.S. Federal Energy Regulatory Commission (FERC) assessment[4] lists DR programs as: dynamic pricing without enabling technology, dynamic pricing with enabling tech-nology, direct load control (DLC), interruptible tariffs, and other DR programs such as capacity/demand bidding and wholesale programs. DOE categorizes these programs into: price-based DR, and incentives-based DR [5]. This paper briefly lists the popular DR programs:
1) Price-Based Programs [5], [6], or market-led [7], or stability-based [8] programs: These programs offer participants time-varying rates that reflect the value and cost of electricity in different time periods.
a) Time-of-Use (TOU): TOU rates differ in different blocks of time. The rate reflects the average cost of electricity during different periods.
b) Critical Peaking Price (CPP): CPP benefits the participants by reducing their energy usage during CPP events.
c) Real Time Pricing (RTP): The price signal of RTP is released a day or an hour or even shorter ahead of the time for which it applies.
2) Incentive-Based Programs [5], or system-led [7], or reliability-based [6], or economic-based [8] programs: These programs offer participants discount rates or rebates for their participation or load reduction per-formance on DR signals.
a) Direct Load Control (DLC): DLC program op-erators offer a participant an incentive, usually financial, in the form of credits on the utility bill. b) Interruptible/Curtailable Service (CS) Programs: Participants of these programs receive a rate discount or bill credit in return for agreeing to reduce load during certain time periods.
c) Demand Bidding/Buy Back (DB): Participants offer their most cost-beneficial bids, price and reducible load, to an electricity market.
e) Capacity Market (CM): Participants who commit to providing contracted load reductions when necessary [5] receive incentives.
f) Ancillary Service Market (ASM): Participants must adjust huge amount of load quickly when an event occurs. The response duration is typically in minutes rather than hours [9].
The emergence of advanced metering technology enables all types of customers to participate in DR programs. Irwin et al.[10] believe the data centers are well-suited to adopt DR for the following reasons:
1) Servers usually equip with programmable power man-agement mechanisms, which are capable of adjusting their power consumption by commands from certain interfaces.
2) Many computation workloads are tolerant to delays or performance degradation, enabling data centers to adjust their power consumption in responding to price fluctuations.
3) Data centers consume huge amount of energy that have a substantial impact on grid conditions.
Masanet et al. [11] find that the power demand of data centers in 2008 was approximately 69 billion kWh, but it may be technically feasible to reduce this demand to 13 billion kWh. Other studies [1], [11], [2], [10] also address the great potential and feasibility for data centers adopting DR practices.
In general, participants take the following actions in re-sponding to a DR event [12], [13].
1) Demand Limiting [13]: Shed loads when the facility demand nears a preset maximum [14].
2) Demand Shedding [13]: Reduce electricity usage dur-ing periods when prices are high. Temporary change of thermostat settings of heaters or air conditioners is a common practice [15], [16].
3) Demand Shifting [13]: Shift peak demand operations to off-peak periods. A C&I customer usually reschedule some activities to make up for lost services [12]. 4) On-Site Generation [12]: Use customer owned
dis-tributed generation [17], [18].
The success of demand control strategies depends on a lot of factors, including: frequency, duration, the local weather patterns, or electric grid conditions [13]. However, to develop a suitable DR control strategy needs to gather enough power consumption information of the participating facilities.
III. DATAGATHERING ANDTESTSITESETUP
All data centers rely on electricity to power their opera-tions. Data center loads consist of IT loads, and non-IT loads. IT loads include the power demand of all IT equipment, servers, networking and storage as well as telecom equipment in a data center. Non-IT loads refer to the power demand of the supporting infrastructure in a data center.
The studied test site is a data center that supports com-putation tasks for the the faculty, staff, and students on a university campus in Taipei. This data center consists of 40 computers that are 4 IBM X3200 M3 servers featuring one 2.53 GHz quad-core 8 threads Intel Xeon X3440 processor and 2 GB memory per server, 4 IBM X3550 M3 servers featuring two 2.40 GHz quad-core 8 threads Intel Xeon
E5620 processor and 12 GB memory per server, 2 Tatung TSS 2520 Servers featuring two 2.40 GHz Xeon processors and 4GB memory per server, and 30 power-saving computers (ACER Veriton N260) that are equally divided into 3 groups to form cluster servers. Each power-saving computer runs with a dual-core 1.66GHz Intel ATOM N280 processor and 1 GB memory. All servers use Linux 2.6 as their operation system. Apache 2.2 and MySQL 5 are installed on each server. The cooling facility of this data center includes a split air conditioner and 3 roof mount fans. This data center is equipped with 5 Zyxel GS2200-48 LAN Switches, which are responsible for the network communication of this site. In order to represent a typical case for future reference, this study uses the standard smart meters as the measurement instruments instead of digital multi-meters (DMMs), which are employed in many prior studies. The instrumentation for measuring the power consumption consists of two standard smart meters manufactured by Tatung Company, i.e the S4E solid state meters. Tatung S4E meter is also one of few types of electronic electricity meter that are currently adopted by Taiwan Power Company, TaiPower. In the test site, one meter measures the power demand of all the non-IT equipment, and the other measures all the IT equipment.
In an advanced metering system or smart grid, an acti-vated smart meter periodically sends the collected electricity information to a utility through its designated communica-tion channel. However, the advanced metering infrastructure (AMI) for non-industrial customers is still at the pilot testing stage in Taiwan. To overcome this issue, the meter manufac-ture adds an inbound communication interface, which com-prises to the Ethernet and TCP/IP, to the delivered meters. The time unit used in the figures of this paper is quarter-hour, which is also the reporting interval of the adopted smart meter. This study collects the power consumption information of the test site for several weeks, which are 6082 quarter-hours, to be exact. The weather conditions, such as temperature and humidity, of the measured period are gathered from the Central Weather Bureau (CWB) of Taiwan. The data collected from the test site are categorized into three groups:
1) Power consumption patterns of the server machines. 2) Power consumption data of different periods. 3) Weather information.
A. Power Consumption Patterns of Servers
In order to get the power consumption patterns based on the CPU utilization, this study installs uses sar, which is a Linux package collecting, reporting, or saving system activity information, to record the CPU activity. The interval parameter tosaris set to60seconds. Each of the machines runningsaralso connects to a Mastech 9803R Bench Digital Multimeter (DMM) to record its power usage. Each DMM
Fig. 1. Power Consumption vs. CPU Utilization
Fig. 2. Power Consumption vs. Utilization Values of Server Machines
B. Power consumption data of different periods
The collected data sets cover three periods.
1) Idle Period: The first period is during the winter break when the servers are almost always idle. This period is from time unit 1 to 2400.
2) Busy Period: The second period is the preparation period for the new semester when all the servers are busy at installing and upgrading the required software packages, serving requests from students, updating accounts and performing maintenance activities by staffs, and assisting teachers for preparing their course materials. During the second period, the servers usually have the highest utilization rate of a semester. This period is from time unit 2401 to 3840.
3) Normal Period: During the third period, the servers support the regular computation and web host services. This period is from time unit 3841 to 6802.
[image:3.595.304.548.180.283.2]Figure 3 shows the recorded power consumption data in-cluding IT load, non-IT load, total load, and corresponding temperatures.
Fig. 3. Power Consumption and Outdoor Temperatures of the Test Site
[image:3.595.49.289.203.308.2]Fig. 4. Temperature (in Celsius) and Humidity of the Test Period
Fig. 5. Power Consumption vs. Server Utilization
C. Weather Information
This study prepares a program that automatically accesses the required weather data from the on-line real-time climate database from CWB. This program retrieves the climate records from the weather monitoring station that is nearest to the test site at a quarter-hour interval. Each record consists of the record time, temperature, pressure, humidity, rainfall, and wind speed. This study uses only the information of temperature and humidity to perform analysis. Figure 4 shows the temperature (in Celsius) and the humidity data of the measured period.
IV. ANALYSIS ANDDISCUSSION
In a server computer, CPU utilization is often considered as the major indicator of server power consumption, since most of other components in a server computer are driven by instructions issued by CPUs. From Figure 1, the result confirms the findings of Vasan et al. [19] that CPU utilization and its power consumption tend to have a linear relationship. The test site uses Round-Robin load balancing to average the computation load of the working machines. Therefore, this study assumes each machine has a similar CPU utilization value at any given time. Figure 5 shows the correlation between average CPU utilization of all server machines, which is also the overall server utilization, and the estimated power consumption. From Figure 5, it is clear that the server power consumption is linear with respect to average server utilization value. Using Psrv as the average power
consumption of the servers and Usrv as the average server
utilization, this relationship is represented as:
Psrv(Usrv) = 878.7Usrv+ 1657.1 (1)
From Eq. (1), the power consumption of servers at the idle state,Pidle=Psrv(0), is 1657.1 watts; the power
consump-tion of servers when they are fully utilized,Pf ull=Psrv(1),
is 2535.8 watts; and the dynamic range, Pdyna = Pf ull−
Pidle, is 878.7 watts. The maximum value of the recorded
[image:3.595.49.291.644.764.2]Fig. 6. Server Utilization vs. Number of Network Connections
Fig. 7. Outdoor Temperature (in Celsius) and Non-IT Load
is 1867.03 watts. According to the observed relationship between the server utilization and the number of network connections as shown in Figure 6, this study assumes that the power consumption of LAN switches is also linear to the server utilization. Therefore, the power consumption of LAN switches, Pswitch, is modeled as:
Pswitch(Usrv) = 114.46Usrv+ 209.93 (2)
In the test site, the server computers and the LAN switches are the only contributors to IT load. With Eq. (1) and Eq. (2), this study models IT load,PIT, of the test site as:
PIT(Usrv) =Psrv(Usrv) +Pswitch(Usrv)
= 993.16Usrv+ 1867.03 (3)
Observing Figure 3, the curves of non-IT load and the outdoor temperature values have a strong correlation as shown in Figure 7. On the other hand, IT load is obviously independent of the outdoor temperature; and the humidity values have little impact on the power consumption values in this test. Therefore, this study focuses on the relationship between the outdoor temperature values and non-IT load of this test site, but ignores the humidity values.
[image:4.595.305.545.52.154.2]Air conditioner units are responsible for the majority of non-IT load. In the test site, the temperature set-point of the equipped air conditioner is 26◦C or 80◦F, which is recommended by the American Society of Heating, Refrig-erating and Air-Conditioning Engineers (ASHRAE) or Net-work Equipment Building System (NEBS). [20] According to the specification, the installed air conditioner is capable of removing heat at the rate of7327W with the given power of 2200W, which means the coefficient of performance (CoP) of this cooling device is 7327/2200 ≈ 3.33. Figure 8 shows the relationship between non-IT load and outdoor temperature for different recording periods. It is obvious that non-IT load increases as temperature increases. Many prior studies [21], [22], [23], [24], [25] indicate that IT load has some impact on the power consumption of HVAC systems
Fig. 8. Non-IT Load vs. Outdoor Temperature (in Celsius) TABLE I
SERVERUTILIZATIONS ANDTHEIRPOPULARITIES Range of Server Utilization
Percentage in the Recorded Data
0%-10% 10%-20% 20%-30% 30%-40% 40%-50% 74.92% 8.26% 1.01% 0.31% 0.93% 50%-60% 60%-70% 70%-80% 80%-90% 90%-100%
0.88% 0.81% 0.16% 0.29% 18.33%
in a data center. However, it is difficult to tell whether the IT load affects the non-IT load or not from Figure 8.
By further checking the recorded IT load data, this study finds the the values of IT load are very unevenly distributed. More than 70% of time, the server computers have the utilization rate under 10%. The second largest portion, which is about 18.33%, is the duration of the server computers op-erating at the utilization rate over 90%. As the popularity of server utilization rates shown in Table I, the server computers operating at utilization rate between 10% and 90% is less than 15% of time. In order to clarify the relationship between IT load and the power consumption of non-IT equipment, this study checks the relationship between non-IT load and temperature when the server computers are under 10% and over 90% utilization rate. The two sets of data are defined as:
• Light IT Load: grouped by the recorded non-IT loads of the corresponding IT loads under 1966.346 W, which means the server utilization rate is under 10% according to Eq. (3).
• Heavy IT Load: grouped by the recorded non-IT loads of the corresponding IT loads over 2760.874 W, which means the server utilization rate is over 90%.
This study then examines the two sets of data against the outdoor temperatures, as shown in Figure 9. The result indicates that the non-IT loads related to the heavy IT loads are indeed a little bit higher than the ones related to the light IT loads. The relationships of non-IT loads, represented by PnonIT, of these two sets to the outdoor temperatures,
represented byT, are close to linear and estimated as follows:
PnonIT(T) =
Fig. 9. Non-IT Loads at Different Server Utilization Rates vs. Outdoor Temperature (◦C)
utilization rate in addition to the outdoor temperature. With three constant coefficients a, b, and c, the non-IT load is modeled as:PnonIT(Usrv, T) = (a+bUsrv)T+c. According
to Eq. (4), c is −90.5 in this test site. Based on the same equation,a+b×0.1 = 33.3anda+b×0.9 = 34.7. Therefore,
a= 33.125andb= 1.75. The minimum power consumption of non-IT devices is 70 W in this test site, which means 33.125T ≥170.5→T ≥5.15. For the outdoor temperature higher than5.15◦C, the non-IT power model of the test site can be then expressed as:
PnonIT(Usrv, T) = (33.125 + 1.75Usrv)T−90.5 (5)
In fact, the outdoor temperature is rarely below 5.15◦C at the location of this site. Using Eq. (3) and Eq. (5), the PUE of this test site,P U EDC, can be modeled as:
P U EDC(Usrv, T) =
PIT(Usrv) +PnonIT(Usrv, T)
PIT(Usrv)
= 1+(33.125 + 1.75Usrv)T−90.5 993.16Usrv+ 1867.03
(6)
The energy efficiency of cooling facilities in a data cen-ter is a well-studied subject. In some well-known practice guides [20] [26] [27] [28], the major concerns regarding the power demand control focus mostly on controlling HVAC, or computer room air conditioning (CRAC) devices with little consideration of the server utilization management. In fact, many demand control strategies [29] [30] [31] for DR programs also focus only on the load management of cooling facilities in commercial buildings. The temperature set-point of CRAC is at 26◦C in this test site. According to the settings of ASHRAE Class 2 Computing Environment [20], the maximum allowable temperature set-point is at 35◦Cor 95◦F. Suppose Eq. (5) is also applicable on the situation of raising CRAC set-point, as shown in Eq. (7).
PnonIT(Usrv, T) =
(33.125 + 1.75Usrv)(T−Tsetpoint) + 770.75 (7)
If the outdoor temperature is high enough,T ≥13.9◦C, this test site would be able to reduce about 298.125 W,33.125×9, by raising the temperature set-point to 35◦C. Temporarily raising the temperature set-point ensures that PUE is main-tained, which is necessary for the building engaging with PUE related certification processes. However, the demand reduced by controlling CRAC in a small data center is just a part of its achievable power reduction potential. In addition to the power reduction from raising temperature set-point, small non-mission-critical data centers can also reduce their server utilization rates to achieve even more demand reduction.
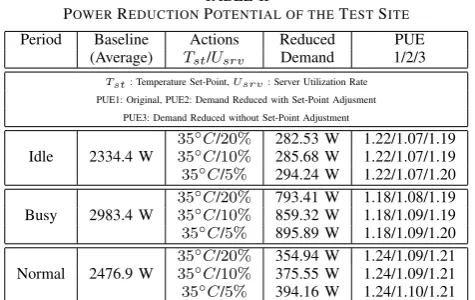
TABLE II
POWERREDUCTIONPOTENTIAL OF THETESTSITE Period Baseline Actions Reduced PUE
(Average) Tst/Usrv Demand 1/2/3 Tst: Temperature Set-Point,Usrv: Server Utilization Rate PUE1: Original, PUE2: Demand Reduced with Set-Point Adjusment
PUE3: Demand Reduced without Set-Point Adjustment
35◦C/20% 282.53 W 1.22/1.07/1.19
Idle 2334.4 W 35◦C/10% 285.68 W 1.22/1.07/1.19
35◦C/5% 294.24 W 1.22/1.07/1.20
35◦C/20% 793.41 W 1.18/1.08/1.19
Busy 2983.4 W 35◦C/10% 859.32 W 1.18/1.09/1.19
35◦C/5% 895.89 W 1.18/1.09/1.20
35◦C/20% 354.94 W 1.24/1.09/1.21
Normal 2476.9 W 35◦C/10% 375.55 W 1.24/1.09/1.21
35◦C/5% 394.16 W 1.24/1.10/1.21 Table II summarizes the power reduction potential of this test site. The results indicate that the test site is capable of reducing upto 30% of the power consumption by controlling both the temperature set-point and the server utilization rate during the busy period. Even during the idle period, it is also able to reduce 12% of the power demand of the test site. If the temperature set-point is raised when the server utilization is controlled, the PUEs of the listed scenarios improve at least 8%, which ensures that such temporarily power reduction does not impede the established PUE. If the temperature set-point of CRAC is not adjusted along with the adjustment of server utilization rate, PUE could become worse in some cases. The results confirm the findings by Ghakitar et al. [2] that data centers do have significant potential for DR.
Besides maintaining the established PUE, another major limitation of small data centers participating in DR pro-grams comes from the minimum capacity requirement. DR programs providers typically require the participants with minimum capacity in the range of several hundred kilowatts to several megawatts. Obviously, the capacity of a small data center similar to the test site is not qualified for participating in most DR programs. Aggregating small data centers in an institute to form a qualifiable unit is a way to overcome this limitation. For example, the capacity of the school where the test site resides is about 1,880 kW that is more than enough to be qualified as a DR participant. The average power demand of the small data centers in this school is about 300 kW. Since most of the data centers in the school have similar setups, it is possible to have 36 kW to 90 kW demand reduction from data centers when a DR event is called. This school with student population of 4,500 is actually one of the smaller universities in Taiwan, where there are more than 150 universities or colleges. The college student population in Taiwan is about 1,353,000. Suppose the ratio of student number to data center power consumption in Taiwan is similar to such ratio at the school the test site resides in. The potential achievable power reduction can be in the range of 10.8 MW to 27 MW when a DR event is called. Therefore, the small data centers scattered in universities, research institutes, or other organizations have significant potential that need to be further explored for DR.
V. CONCLUSION
requires estimating many values affecting expected costs and benefits, and bears with varying degrees of uncertainty. For small data centers, there are few attempts, if any, that address the potential and the limitations for participating in DR programs. This paper presents a real power consumption data set that is collected from a small data center using currently adopted smart meters in Taiwan. The analysis of the collected data reveals that the power demand pattern of this small data center is different from the ones of large server farms. Based on the recorded load records and weather information, this paper models the power demand of IT and IT devices as well as an estimation of PUE. With the proposed models, a data center manager is able to adjust temperature set-point and server utilization rate without hampering the established PUE. This paper concludes that the aggregation of small data centers has great potential for DR, if power consumption data is detail enough, and the control strategies are well planned.
REFERENCES
[1] Environmental Protection Agency, “Report to congress on server and data center energy efficiency: public law 109–431,” Environmental Protection Agency U.S., Tech. Rep., 2007.
[2] G. Ghatikar, M. Piette, S. Fujita, A. McKane, J. Dudley, A. Radspieler, K. Mares, and D. Shroyer, “Demand response and open automated demand response opportunities for data centers,” Lawrence Berkeley National Laboratory, Tech. Rep., 2010.
[3] B. Lorenz, “Green strategies for office buildings,”Building Operating Management, vol. 6, pp. 1–4, 2009.
[4] A. Faruqui, R. Hledik, S. George, J. Bode, P. Mangasarian, I. Rohmund, G. Wikler, D. Ghosh, and S. Yoshida, “A national assess-ment of demand response potential,” FERC Staff Report. Prepared by The Brattle Group, Freeman, Sullivan Co., and Global Energy Partners, LLC., Tech. Rep., 2009.
[5] Department of Energy, “Benefits of demand response in electricity markets and recommendations for achieving them. a report to the united states congress pursuant to section 1252 of the energy policy act of 2005,” Department of Energy, United States, Tech. Rep., 2006. [6] Y. Tan and D. Kirschen, “Classification of control for demand-side
participation,”University of Manchester, vol. 29, 2007.
[7] International Energy Agency, The Power to Choose: Demand Re-sponse in Liberalised Electricity Markets. International Energy Agency, Organisation for Economic Co-operation and Development, 2003.
[8] P. Jazayeri, A. Schellenberg, W. Rosehart, J. Doudna, S. Widergren, D. Lawrence, J. Mickey, and S. Jones, “A survey of load control programs for price and system stability,”Power Systems, IEEE Trans-actions on, vol. 20, no. 3, pp. 1504 – 1509, aug. 2005.
[9] Federal Energy Regulatory Commission, “Assessment of demand response and advanced metering,” FERC Staff Report, Federal Energy Regulatory Commission, Washington DC, Tech. Rep., 2006. [10] D. Irwin, N. Sharma, and P. Shenoy, “Towards continuous
policy-driven demand response in data centers,” inProceedings of the 2nd ACM SIGCOMM workshop on Green networking, ser. GreenNets ’11. New York, NY, USA: ACM, 2011, pp. 19–24.
[11] E. Masanet, R. Brown, A. Shehabi, J. Koomey, and B. Nordman, “Estimating the energy use and efficiency potential of u.s. data centers,”Proceedings of the IEEE, vol. 99, no. 8, pp. 1440 –1453, aug. 2011.
[12] M. Albadi and E. El-Saadany, “A summary of demand response in electricity markets,”Electric Power Systems Research, vol. 78, no. 11, pp. 1989 – 1996, 2008.
[13] S. Kiliccote and M. A. Piette, “Advanced control technologies and strategies linking demand response and energy efficiency,” Lawrence Berkeley National Laboratory, Tech. Rep., 2005.
[14] M. Barancewicz and J. R. Lord, “Successful reduction of energy use through participation in the pjm demand response program,”Energy Engineering, vol. 107, no. 6, pp. 14–42, 2010.
[15] K. Herter, P. McAuliffe, and A. Rosenfeld, “An exploratory analysis of california residential customer response to critical peak pricing of electricity,”Energy, vol. 32, no. 1, pp. 25 – 34, 2007.
[16] M. Piette, O. Sezgen, D. Watson, N. Motegi, C. Shockman, and L. Ten Hope, “Development and evaluation of fully automated demand response in large facilities,” Lawrence Berkeley National Laboratory, Tech. Rep., 2004.
[17] S. Valero, M. Ortiz, C. Senabre, C. Alvarez, F. Franco, and A. Gabal-don, “Methods for customer and demand response policies selection in new electricity markets,”Generation, Transmission Distribution, IET, vol. 1, no. 1, pp. 104 –110, january 2007.
[18] O. Sezgen, C. Goldman, and P. Krishnarao, “Option value of electricity demand response,”Energy, vol. 32, no. 2, pp. 108 – 119, 2007. [19] A. Vasan, A. Sivasubramaniam, V. Shimpi, T. Sivabalan, and R.
Sub-biah, “Worth their watts? - an empirical study of datacenter servers,” inHigh Performance Computer Architecture (HPCA), 2010 IEEE 16th International Symposium on, jan. 2010, pp. 1 –10.
[20] ASHRAE Technical Committee (TC) 9.9, “2011 thermal guidelines for data processing environments - expanded data center classes and usage guidance,” American Society of Heating, Refrigerating and Air-Conditioning Engineers, Tech. Rep., 2011.
[21] J. Moore, J. Chase, P. Ranganathan, and R. Sharma, “Making schedul-ing ”cool” : temperature-aware workload placement in data centers,” inProceedings of the annual conference on USENIX Annual Technical Conference, 2005, pp. 5–5.
[22] L. Parolini, B. Sinopoli, and B. H. Krogh, “Reducing data center energy consumption via coordinated cooling and load management,” in Proceedings of the 2008 conference on Power aware computing and systems, ser. HotPower’08. Berkeley, CA, USA: USENIX Association, 2008, pp. 14–14.
[23] L. Parolini, B. Sinopoli, B. Krogh, and Z. Wang, “A cyber-physical systems approach to data center modeling and control for energy efficiency,”Proceedings of the IEEE, vol. 100, no. 1, pp. 254 –268, jan. 2012.
[24] L. Parolini, N. Tolia, B. Sinopoli, and B. H. Krogh, “A cyber-physical systems approach to energy management in data centers,” in Proceedings of the 1st ACM/IEEE International Conference on Cyber-Physical Systems, ser. ICCPS ’10. New York, NY, USA: ACM, 2010, pp. 168–177.
[25] Q. Tang, T. Mukherjee, S. Gupta, and P. Cayton, “Sensor-based fast thermal evaluation model for energy efficient high-performance datacenters,” inIntelligent Sensing and Information Processing, 2006. ICISIP 2006. Fourth International Conference on, 15 2006-dec. 18 2006, pp. 203 –208.
[26] L. Newcombe, M. Acton, J. Booth, S. Flucker, P. Latham, S. Strutt, and R. Tozer, “2012 best practices for the eu code of conduct on data centres version 3.0.8,” EU Code of Conduct, Tech. Rep., 2011. [27] S. Greenberg, E. Mills, B. Tschudi, P. Rumsey, and B. Myatt, “Best
practices for data centers: Lessons learned from benchmarking 22 data centers,” inProceedings of the ACEEE Summer Study on Energy Efficiency in Buildings in Asilomar, CA. ACEEE, August, vol. 3, 2006, pp. 76–87.
[28] O. VanGeet, “Best practices guide for energy-efficient data center design,” National Renewable Energy Laboratory, Tech. Rep., 2011. [29] S. Kiliccote, M. A. Piette, and D. Hansen, “Advanced controls
and communications for demand response and energy efficiency in commercial buildings,” Lawrence Berkeley National Laboratory, Tech. Rep., 2006.
[30] D. S. Watson, S. Kiliccote, M. A. Piette, and N. Motegi, Demand Response: Commercial Building Strategies. Taylor & Francis Group, 2008, ch. 47, pp. 270–278.