Abstract—It is common that typical devices that form digital images contain of lenses and semiconducting sensors which capture a projected scene. These components cause distortions such as simple geometrical distortion, degradation and noise. That is why sophisticated denoising, sharpening and colour correction algorithms are crucial to obtain high-quality digital images. In this paper we present a novel parallel scheme of image filtration based on Principal Component Analysis (PCA) and non-local processing. Work fundamentals of its algorithm are discussed in detail along with experimental data showing its features in comparison with existed filtration approaches.
Index Terms—Image filtration, principle component analysis, non-local processing
I. INTRODUCTION
HERE are several widely known methods of cancelling an additive white Gaussian noise (AWGN) in digital images [1]. Among them are algorithms of (1) local processing, (2) non-local processing, (3) pointwise processing and (4) multipoint processing.
Each of these methods has its specific pros and cons in quality of reconstructed digital images and computational cost of implemented algorithms. Omitting the computational cost analysis we note that the main problems with the quality of reconstructed images in modern algorithms are: Gibbs effect, which becomes highly noticeable on images containing objects with high brightness contrast on their outer edges, and edge degradation of objects on an image being processed.
Solutions of the stated problems at this time are efficiently found by the following digital image reconstruction algorithms: (1) algorithm based on block-matching and 3D filtering (BM3D) [2]; (2) algorithm based on shape-adaptive
This work was supported in part by the Russian Foundation for Basic Research under Grant № 12-08-01215-а "Development of methods for quality assessment of video".
A.L. Priorov is with the Yaroslavl State University, Yaroslavl, Russia 150000 (e-mail: [email protected]).
V.A. Volokhov is with the Yaroslavl State University, Yaroslavl, Russia 150000 (e-mail: [email protected]).
E.V. Sergeev is with the Yaroslavl State University, Yaroslavl, Russia 150000 (e-mail: [email protected]).
I.S. Mochalov is with the Yaroslavl State University, Yaroslavl, Russia 150000 (e-mail: [email protected]).
K.I. Tumanov is with the Yaroslavl State University, Yaroslavl, Russia
discrete cosine transform (SA-DCT) [3]; (3) k-means singular value decomposition (K-SVD) [4]; (4) non-local means algorithm (NL-means) [5]; (5) algorithm based on a local polynomial approximation and intersection of confidence intervals rule (LPA-ICI) [6].
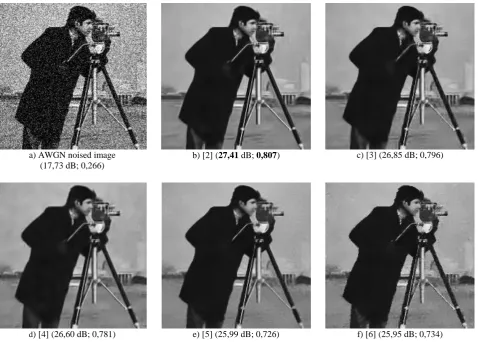
Examples of denoising an AWGN affected image with the listed filtration algorithms are shown in Fig. 1. Specific values of Peak Signal-to-Noise Ratio (PSNR) and Mean Structural Similarity Index Map (MSSIM) are shown for each algorithm. Hereinafter best image reconstruction results based on the criteria of PSNR [7] and MSSIM [8] are marked in bold.
Literature on digital images noise cancelling shows that modern AWGN filtration methods used for greyscale images may be successfully transferred to other digital image processing tasks. So, this work in addition to the primary use of the methods shows how they may be are used for: (1) denoising AWGN-noised colour images; (2) filtration of mixed noises; (3) suppression of blocking artefacts in compressed JPEG images.
Filtration of color images is an issue of the day for various practical applications. That is why there are numerous solutions to it. One of the possible approaches is a direct channelwise processing of an RGB image, which was used in this work. Here, no transition from RGB image to an image with separated brightness and colour information during the modelling process was performed, and an AWGN was separately inserted to each channel with the same characteristics.
II. DESCRIPTION OF THE PROPOSED ALGORITHM
Flowchart of our algorithm is shown in Fig. 2. Consider that a digital image to process x is distorted with AWGN n with first and second moments both equal to zero. In the following we shall investigate the main steps of our algorithm.
A. First Stage
Keystone of the stage is the Muresan and Parks filtration method based on the PCA introduced in 2003 [9].
1. Evaluate dispersion 2 of the input noised image
n x
y . This can be done using a common formula [9, 10]:
2.
6745 , 0
) ( ˆ Median HH1
,
Parallel Filtration Based on Principle
Component Analysis and Nonlocal
Image Processing
Andrey Priorov, Vladimir Volokhov, Evgeny Sergeev, Ivan Mochalov, and Kirill Tumanov,
Member,
IAENG and Student Member, IEEE
a) AWGN noised image (17,73 dB; 0,266)
b) [2] (27,41 dB; 0,807) c) [3] (26,85 dB; 0,796)
[image:2.595.61.540.59.401.2]d) [4] (26,60 dB; 0,781) e) [5] (25,99 dB; 0,726) f) [6] (25,95 dB; 0,734)
Fig. 1. Denoising of an AWGN-noised (35) image by various algorithms on an example of the test image “Cameraman”. In brackets PSNR, dB and MSSIM
Note that the AWGN model, mainly discussed in the work, may be complicated to a mixed noise model to simulate, for example, noise of CMOS sensors:
n x x
y ( 1 2 ) ,
there 1 and 2 – constants, showing the noising degree, and n – AWGN with zero mean and dispersion equal to 1.
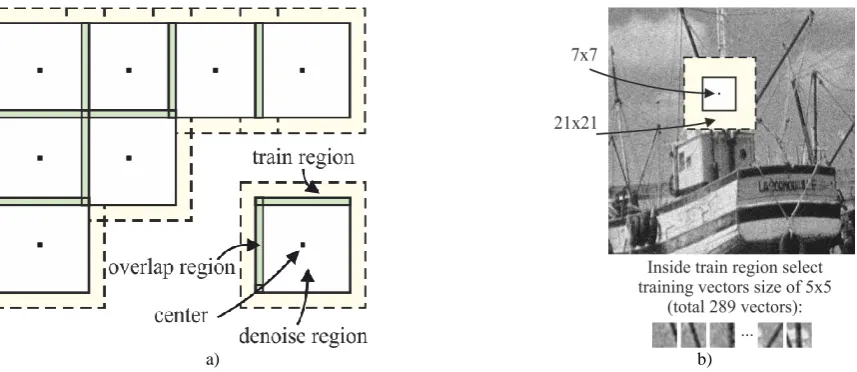
2. Divide the input noised image into a set of overlapping blocks. (Fig. 3). Each of them contains of: train region, denoise region and overlap region. Dimensions of these areas may vary.
3. In the train region select all possible blocks size of
I I
l
l (training vectors). Last are column vectors each
2 I
)
(l in length. They allow us to form a selective matrix SIy with a size of (lI)2nI, which contains of the mentioned column vectors. Here nI is a number of training vectors found in the train region.
4. Based on the preliminary centred SIy matrix, create a covariation matrix II
y
S
Q . In which SyI is a centred selective matrix SIy. Then, for the II
y
S
Q matrix, find eigenvalues and corresponding eigenvectors (principal components of data
comprised in the SyI matrix). Finally, create an orthogonal transform matrix PyI.
5. For each i1,2,,(lI)2 и j1,2,,nI find projections (transform coefficients) (YI)ij of vectors contained in the matrix SyI, on eigenvectors found in the previous step:
n l l
l
n n
Y Y
Y
Y Y
Y
Y Y
Y
2 2
2 ( ) ( )
) (
) ( )
( ) (
) ( )
( ) (
I 2
I 1 I
2 I 2
2 I 1 2 I
1 I 2
1 I 1 1 I I I I
y yS
P
Y .
Here (YI)ij (XI)ij (NI)ij (an i-th projection of vector j from the matrix SyI on eigenvectors of the matrix II
y
S Q ) is a sum of an i-th projection of undistorted data vector j and an i-th projection of noise vector j. Note, that there is no line
Fig. 2. Digital image filtration flowchart based on the proposed parallel procedure of denoising
a) b)
Fig. 3. а) Filtration process description. Pixels inside a denoise region of a digital image are studied with statistics gathered from a train region; b) Example of pixel grouping inside the train region for a test image “Barche”
6. Evaluate the received projections with optimal linear mean-square error (LMMSE) estimator [9]:
j i i
i j
i Y
Xˆ ) ( )
( 2 2 I
2
I
.
Here 2 – noise dispersion and i2 – a dispersion of i-th projection of undistorted vectors j1,2,,n, which can be found using a maximum likelihood estimator [9]:
n
j
j i
i Y
n 1
2 2 I 2
) ) (( 1 , 0 max
ˆ
.
7. Based on the processed data (XˆI)ij reconstruct an evaluation SˆIx of unnoised data matrix SIx, then, basing on which, reconstruct a separate processed image area. In this case, first of all, a train region is reconstructed by inserting training vectors into their spatial positions considering the overlaps. Training vectors kept as column vectors in the matrix SˆIx, are again transformed into blocks size of lIlI prior the insertion into the train region. Note, that an overlap region is averaged using simple arithmetic averaging. Then, after the reconstruction of the train region extract the smaller denoise region from it.
Repeating similar operations for the rest denoise regions considering the overlaps allows us to process the whole image and receive a primary evaluation xˆI of the unnoised
inserted into their spatial positions of the image xˆI, and the overlap region is arithmetically averaged.
B. Second Stage
1. Using the noised image y, repeat steps 2–5, discussed in the first stage. Sizes of train regions, denoise regions, overlap regions and training vectors change accordingly.
2. Then process received projections using the following formula:
j i j
i j i j
i Y
X X
X ( )
) ) ˆ ((
) ) ˆ (( )
ˆ
( II
2 2 II I
2 II I
II
. (1)
Here (YII)ij (XII)ij (NII)ij (an i-th projection of vector j from a matrix SyII on eigenvectors of a matrix IIII
y
S Q ) is a sum of an i-th projection of undistorted data vector j and an i-th projection of noise vector j, and
j i j
i j
i X N
Xˆ ) ) ( ) ((ˆ ) )
(( I II II I II (an i-th projection of vector j from matrix SˆxIII on eigenvectors of a matrix
II
II ˆI
x
[image:3.595.68.497.207.393.2]3. Same operations discussed in step 7 of the first stage of processing give us a second evaluation xˆII of the unnoised image.
C. Third Stage
Implementation of this stage requires non-local processing approach introduced by Buades, Coll and Morel in 2005 [5]. Here we discuss in detail the major steps of the non-local algorithm for image denoising on the example shown in Fig. 2.
1. For a processed pixel y(i,j) of the noised image y select a square area of a fixed size lIIIlIII (similarity area) in its spatial position for evaluation xˆII. This area is centred on a xˆII(i,j) pixel.
2. Then, determine similarity between the pixel y(i,j), being processed, and y(k,l) pixel of the same image y, based on the evaluation xˆII, using a weighted Euclidean distance
m,nNga m n x im jn x km ln
2 II II )] , ( ˆ ) , ( ˆ [ ) , ( ,
there N – a fixed-size area, centred on point with (0,0)
coordinates, ga(m,n) – additional weight coefficients,
found as Gaussian kernel coefficients with a standard deviation a.
3. Next, for the final evaluation of pixel
x
ˆ
III(
i
,
j
)
, find weight of pixel y(k,l) similar to y(i,j):2 III , 2 II II III ) ( )] , ( ˆ ) , ( ˆ [ ) , ( e ) , , , ( h n l m k x n j m i x n m g h N n m a l k j i w
,there
h
III – a filtration parameter, which affects a filtration degree of digital image. Parameter hIII can be found as follows: III III с h ,there сIII – a positive constant in a range from 0.1 to 1, found empirically, – a standard deviation of the AWGN affected the image x.
4. Finally, form a resulting non-local evaluation of the processed pixel y(i,j) based on the following formula
klgh i j k l yk l j
i
xˆ (, ) , III(, , , ) ( , )
III , there l
k wh i j k l
l k j i h w l k j i h g , (, , , ) ) , , , ( ) , , , ( III III III .
Repeating the discussed steps for the rest pixels of the image y, it is possible to obtain a third evaluation xˆIII of the original unnoised image x.
D. Fourth Stage
This stage is based on forming a final ‘accurate’ evaluation xˆIV of the unnoised image x using a ‘mixing pixels’ procedure shown as a separate block on Fig. 2.
In this work mixing pixels procedure is performed according to the simple formula:
III III II II
IV ˆ ˆ
ˆ x x
x d d ,
there dII and dIII – constant values, in a range from 0.1 to 1.
III. COMPUTATIONALCOSTS
Consider N and M – number of strings and columns, respectfully, of a processed image, N – step in pixels, which a denoise region is moved on,
n
– number of training vectors found in a train regions,m
– length of training vectors, depicted as column-vectors,l
– parameter, setting up a size of similarity area, and g – parameter, setting up a size of similar pixels search area.Firstly, calculations connected with creation of covariation matrix, search for eigenvectors (principal components) and data interpretation in a found principal component’s basis require ( 2)
nm
O operations for each denoise region.
Secondly, computations of data transform coefficients, shown in the found principal components’ basis, performed
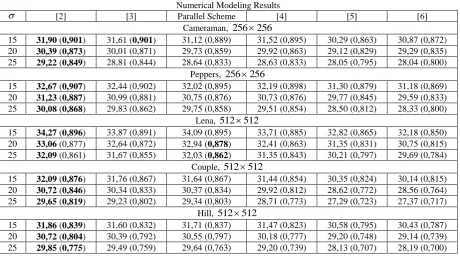
TABLE1 Numerical Modeling Results
[2] [3] Parallel Scheme [4] [5] [6]
Cameraman, 256256
15 31,90 (0,901) 31,61 (0,901) 31,12 (0,889) 31,52 (0,895) 30,29 (0,863) 30,87 (0,872) 20 30,39 (0,873) 30,01 (0,871) 29,73 (0,859) 29,92 (0,863) 29,12 (0,829) 29,29 (0,835) 25 29,22 (0,849) 28,81 (0,844) 28,64 (0,833) 28,63 (0,833) 28,05 (0,795) 28,04 (0,800)
Peppers, 256256
15 32,67 (0,907) 32,44 (0,902) 32,02 (0,895) 32,19 (0,898) 31,30 (0,879) 31,18 (0,869) 20 31,23 (0,887) 30,99 (0,881) 30,75 (0,876) 30,73 (0,876) 29,77 (0,845) 29,59 (0,833) 25 30,08 (0,868) 29,83 (0,862) 29,75 (0,858) 29,51 (0,854) 28,50 (0,812) 28,33 (0,800)
Lena, 512512
15 34,27 (0,896) 33,87 (0,891) 34,09 (0,895) 33,71 (0,885) 32,82 (0,865) 32,18 (0,850) 20 33,06 (0,877) 32,64 (0,872) 32,94 (0,878) 32,41 (0,863) 31,35 (0,831) 30,75 (0,815) 25 32,09 (0,861) 31,67 (0,855) 32,03 (0,862) 31,35 (0,843) 30,21 (0,797) 29,69 (0,784)
Couple, 512512
15 32,09 (0,876) 31,76 (0,867) 31,64 (0,867) 31,44 (0,854) 30,35 (0,824) 30,14 (0,815) 20 30,72 (0,846) 30,34 (0,833) 30,37 (0,834) 29,92 (0,812) 28,62 (0,772) 28,56 (0,764) 25 29,65 (0,819) 29,23 (0,802) 29,34 (0,803) 28,71 (0,773) 27,29 (0,723) 27,37 (0,717)
Hill, 512512
[image:4.595.69.530.534.790.2]using LMMSE estimator during the first stage and using empirical Wiener filter during the second stage, combined require O(nm) operations for each denoise region.
Thirdly, third stage based on non-local processing algorithm requires O(NMl2g2) operations in total.
Finally, mixing pixels procedure requires as low as
)
(NM
O operations in total.
Discussion above leads to a complete equation describing the computation cost of the proposed algorithm:
( 2) ( )
( 2 2) ( )NM O g NMl O nm O nm O N NM
O
,
there N NM
represents the number of denoise regions per processed image.
Computation cost of the proposed algorithm is relatively high in comparison with existed denoising algorithms. There are several possible approaches which can be used to decrease the cost: (1) calculate only first largest eigenvalues and correspondent eigenvectors for creation of principal components’ basis [12]; (2) during the processing of a noised image change a procedure of searching a local principal component basis with a creation of global hierarchical principal component basis [13]; (3) while using a non-local processing algorithm [5, 14-16] implement it in a vector form [14-15], or, alternatively, use a global principal components’ basis separately calculated for a processed image – this will reduce size of compared similarity areas of pixels being processed and analyzed, and speed up calculation of weight coefficients used to form a final estimation of an unnoised pixel [17].
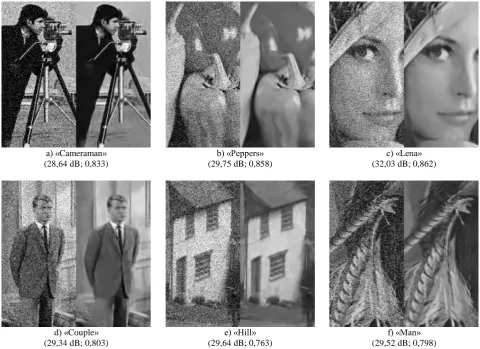
a) «Cameraman» (28,64 dB; 0,833)
b) «Peppers» (29,75 dB; 0,858)
c) «Lena» (32,03 dB; 0,862)
d) «Couple» (29,34 dB; 0,803)
e) «Hill» (29,64 dB; 0,763)
[image:5.595.57.538.249.598.2]f) «Man» (29,52 dB; 0,798)
Fig. 4. Fragments of AWGN-noised ( 25) (left) and reconstructed (right) images, obtained using the parallel processing scheme (Fig. 2). PSNR, dB and MSSIM are given for each reconstructed image accordingly
IV. MODELLINGRESULTS
The algorithm discussed in this work was implemented in MATLAB. Study was done using a ‘classic’ set of halftone images with sizes of 256256 and 512512 pixels, available for analysis [18].
Numerical results (PSNR and MSSIM) for reconstructed from noised with AWGN images using the proposed algorithm and contemporary noise cancelling methods are given in Table 1. The resulting test images, reconstructed
V. CONCLUSION
REFERENCES
[1] Katkovnik V., Foi A., Egiazarian K., Astola J. From local kernel to nonlocal multiple-model image denoising // Int. J. Computer Vision. 2010. V. 86, №8. P. 1–32.
[2] Dabov K., Foi A., Katkovnik V., Egiazarian K. Image denoising by sparse 3D transform-domain collaborative filtering // IEEE Trans. Image Processing. 2007. V. 16, №8. P. 2080–2095.
[3] Foi A., Katkovnik V., Egiazarian K. Pointwise shape-adaptive DCT for high-quality denoising and deblocking of grayscale and color images // IEEE Trans. Image Processing. 2007. V. 16, №5. P. 1395– 1411.
[4] Aharon M., Elad M., Bruckstein A., Katz Y. The K-SVD: An algorithm for designing of overcomplete dictionaries for sparse representation // IEEE Trans. Signal Processing. 2006. V. 54, №11. P. 4311–4322.
[5] Buades A., Coll B., Morel J.M. A non-local algorithm for image denoising // Proc. IEEE Comp. Soc. Conf. Computer Vision and Pattern Recognition. 2005. V. 2. P. 60–65.
[6] Katkovnik V., Foi A., Egiazarian K., Astola J. Directional varying scale approximations for anisotropic signal processing // Proc. XII
European Signal Processing Conf. 2004. P. 101–104.
[7] Salomon D. Data, image and audio compression // Technoshere.
2004.
[8] Wang Z., Bovik A.C., Sheikh H.R., Simoncelli E.P. Image quality assessment: from error visibility to structural similarity // IEEE Trans. Image Processing. 2004. V. 13, №4. P. 600–612.
[9] Muresan D.D., Parks T.W. Adaptive principal components and image denoising // Proc. IEEE Int. Conf. Image Processing. 2003. V. 1. P. 101–104.
[10] Mallat S., A wavelet tour of signal processing. Academic Press, 1999. [11] Yaroslavsky L. Digital picture processing – an introduction.
Springer, 1985.
[12] Du Q., Fowler J.E. Low-complexity principal component analysis for hyperspectral image compression // Int. J. High Performance Computing Applications. 2008. V. 22. P. 438–448.
[13] Deledalle C.-A., Salmon J., Dalalyan A. Image denoising with patch based PCA: local versus global // Proc. 22nd British Machine Vision Conf. 2011.
[14] Buades A., Coll B., Morel J.M. A review of image denoising algorithms, with a new one // Multiscale Modeling and Simulation: A SIAM Interdisciplinary Journal. 2005. V. 4. P. 490–530.
[15] Buades A. Image and film denoising by non-local means. PhD thesis, Universitat de les Illes Balears. 2005.
[16] Buades A., Coll B., Morel J.M. Nonlocal image and movie denoising // Int. J. Computer Vision. 2008. V. 76, №2. P. 123–139. [17] Tasdizen T. Principal components for non-local means image
denoising // Proc. IEEE Int. Conf. Image Processing. 2008. P. 1728– 1731.