Performance Evaluation of Mutual Fund Industry
(A Study with Special Reference to UTI and
Reliance Mutual Fund)
Dr. V.M. Anitha Rajathi1, Vigneshwaran. G2
1Assistant Professor, Department of Management Studies, Anna University (BIT- Campus), Tiruchirappalli, Tamil Nadu, India 2PG Student, Department of Management Studies, Anna University (BIT- Campus), Tiruchirappalli, Tamil Nadu, India
Abstract: In this paper the researcher tried to evaluate the performance of 20 Open-ended, Debt oriented Mutual Fund schemes for the period of April 2017 to March 2018(one year) of a transition economy. Daily closing NAV of different schemes has been used to calculate the returns from the fund schemes. The selected schemes were evaluated on the basis of Sharpe, Treynor and Jensen measure. The objective of this paper is to analyze the return and provide understanding towards better investment decision.
Keywords: Mutual funds, Performance analyze, Reliance, UTI.
I. INTRODUCTION
Investment is the essential part of the modern economic world. A mutual fund is a pool of money, collected from investors, and is invested according to certain investment options. A mutual fund is a trust that pools the savings of a number of investor's who share a common financial goal. A mutual fund is created when investors put their money together. It is, therefore, a pool of the investor's fund. The income earned through these investments and the capital appreciations realized are shared by its unit holders in proportion to the number of units owned by them. Investors in the mutual fund industry have led to innovative alterations to standard products. The most important benefit of product choice is that it enables investors to choose options that suit their return requirements and risk appetite. Investors can combine the options to arrive at their own mutual fund portfolios that fit with their financial planning objectives. A mutual funds business is to invest the funds thus collected according to the wishes of the investors who created the pool. Usually, the investors appoint professional investment managers, to manage their funds. The same objective is achieved when professional investment managers create a product and offer it for investment to the investor.
II. REVIEW OF LITERATURE
Prabakaran and Jayabal (2010) evaluated the performance of mutual fund schemes. The study conducted is on the sample of 23 schemes which were chosen based on the priority given by the respondents in Dharmapuri district in a survey and covers the study from April 2002 to March 2007. The study used the methodology of Sharpe and Jensen alpha for the performance evaluation of mutual funds. Alka Solanki (May 2016) evaluated the performance of reliance open-ended equity schemes with growth option. The period of study spans from 1st April 2007 to 31st March 2016. The study conducted a sample of 10 schemes from reliance mutual
regular performance evaluation of mutual funds is essential for investors and fund managers also. The present study is confined to evaluate the performance of mutual funds on the basis of yearly returns compared with BSE Indices.
III. STATEMENT OF THE PROBLEM
In the current market scenario, there is more expenditure than one's salary. Inflation is touching its high. The interest on fixed deposit were going down day by day. Thus the net rate of return on the investment is being below the inflation rate. To meet these growing requirements the investor need to make diverse investments to make maximum benefits. Investing in market share involves the investors like profitability, liquidity, low risk. Hence, it is very essential to study the performance of an investment in mutual funds to provide a roadmap to the investor for taking investment decisions.
IV. NEED FOR THE STUDY
Evaluating the historical performance of mutual funds is important both for investors as well as portfolio managers. It enables an investor to access as to how much return has been generated by the portfolio manager and what risk level has been assumed in generating such returns. Further, an investor can also appraise the comparative performance of different fund managers. Similarly, fund managers would also be able to know their performance over time and also other competitors in the industry. The evaluation also provides a mechanism for identifying strengths and weaknesses of fund managers in the investment process, which helps them to take corrective action.
V. OBJECTIVES OF THE STUDY
A. To know the mutual fund performance levels in the present market.
B. To analyze the performance of open-ended, income-oriented debt scheme offered in the selected mutual funds like UTI and Reliance.
C. To find out the best mutual fund scheme among the selected schemes in terms of risk and return.
VI. RESEARCH METHODOLOGY
A. Area of study
The study is based on UTI Mutual fund schemes and reliance mutual fund schemes.
B. Period of study
The income-oriented schemes, which have been floated by the UTI mutual funds and Reliance mutual funds during the period April 2017 to March 2018 have been considered for the purpose of the study.
C. Data source
1) Secondary Data: For the present study, the secondary information was collected from the association of mutual fund India, BSE India etc. This study tries to evaluate the performance of the 20 debt mutual fund schemes.
D. Sharpe Ratio
Nobel Laureate Bill Sharpe developed the Sharpe ratio to measure risk-adjusted performance. It is determined by the difference between the risk-free rate of return and portfolio average return and dividing the result by the standard deviation of the portfolio returns.
Sharpe ratio = Portfolio Average Return (Rp) – Risk-free rate of return (RF) Standard deviation of the portfolio Return
E. Treynor Ratio
Treynor ratio evaluates the performance of a portfolio based on the systematic risk of a fund. Treynor ratio is based on the statement that unsystematic or specific risk can be diversified and hence, only incorporates the systematic risk (beta) to measure the portfolio's performance.
Treynor ratio = Portfolio Average Return (Rp) – Risk-free rate of return (RF)
A risk-adjusted performance measure that represents the average return on a portfolio over and above the predicted by the capital asset pricing model (CAPM), given the portfolio's beta and the average market return. This is the portfolio's alpha. In fact, the concept is sometimes referred to as "Jensen's alpha"
Alpha (α) = Rp – [Rf + βp (Rm-Rf)]
Where,
Rp = Expected portfolio return Rf = Risk-free rate
Βp = Beta of the portfolio
[image:3.612.70.543.214.369.2]Rm = Expected market return
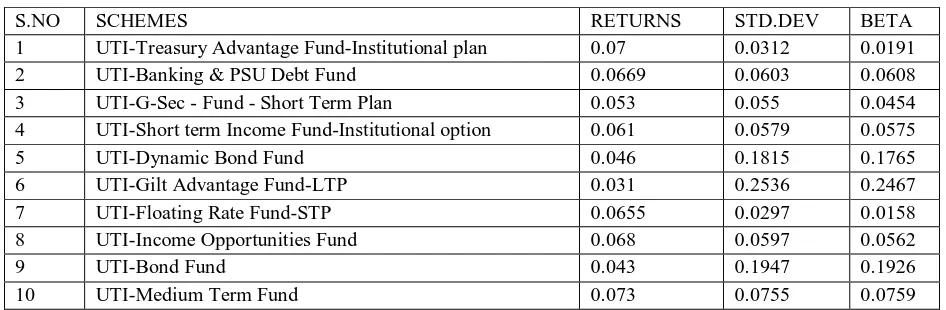
Table 1. Returns of UTI Mutual Fund
S.NO SCHEMES RETURNS STD.DEV BETA
1 UTI-Treasury Advantage Fund-Institutional plan 0.07 0.0312 0.0191
2 UTI-Banking & PSU Debt Fund 0.0669 0.0603 0.0608
3 UTI-G-Sec - Fund - Short Term Plan 0.053 0.055 0.0454
4 UTI-Short term Income Fund-Institutional option 0.061 0.0579 0.0575
5 UTI-Dynamic Bond Fund 0.046 0.1815 0.1765
6 UTI-Gilt Advantage Fund-LTP 0.031 0.2536 0.2467
7 UTI-Floating Rate Fund-STP 0.0655 0.0297 0.0158
8 UTI-Income Opportunities Fund 0.068 0.0597 0.0562
9 UTI-Bond Fund 0.043 0.1947 0.1926
10 UTI-Medium Term Fund 0.073 0.0755 0.0759
Table2. Returns of RELIANCE Mutual Fund
S.NO SCHEMES RETURNS STD.DEV BETA
1 Reliance Floating Rate Fund-STP 0.065 0.0695 0.0672
2 Reliance Medium Term Fund 0.069 0.0418 0.0349
3 Reliance Short Term Fund 0.061 0.071 0.0738
4 Reliance Regular Savings Fund-Debt option 0.0695 0.0639 0.0604
5 Reliance Income Fund 0.033 0.2364 0.24
6 Reliance Dynamic Bond Fund 0.0377 0.2119 0.2226
7 Reliance Gilt Securities Fund 0.042 0.02779 0.287
8 Reliance Monthly Income Plan 0.0676 0.2198 0.1325
9 Reliance Corporate Bond Fund 0.068 0.0895 0.0887
10 Reliance Banking & PSU Debt Fund 0.065 0.0866 0.0881
Table 3. Ratios of UTI Mutual Fund
S.NO SCHEMES SHARPE TREYNOR JENSEN
1 UTI-Treasury Advantage Fund-Institutional plan 0.4560 0.7440 0.0141
2 UTI-Banking & PSU Debt Fund 0.2181 0.2163 0.0128
3 UTI-G-Sec - Fund - Short Term Plan 0.1169 0.1434 0.0062
4 UTI-Short term Income Fund-Institutional option 0.1748 0.1760 0.0098
5 UTI-Dynamic Bond Fund 0.0185 0.0190 0.0023
6 UTI-Gilt Advantage Fund-LTP - 0.0117 - 0.0120 - 0.0044
7 UTI-Floating Rate Fund-STP 0.4103 0.7713 0.0121
8 UTI-Income Opportunities Fund 0.2290 0.2433 0.0133
9 UTI-Bond Fund 0.0094 0.0095 0.0007
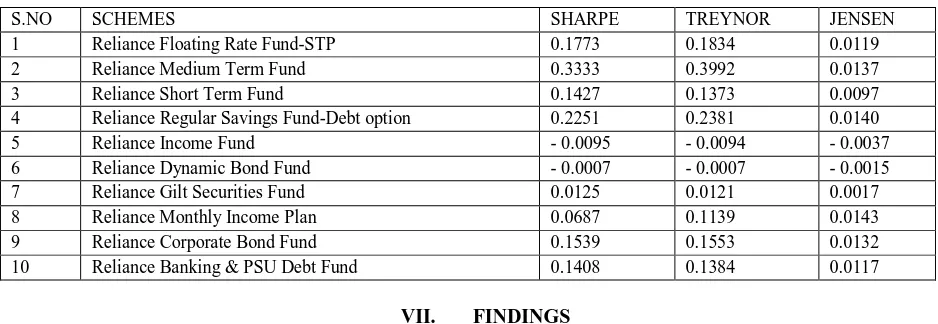
Table 4. Ratios of RELIANCE Mutual fund
S.NO SCHEMES SHARPE TREYNOR JENSEN
1 Reliance Floating Rate Fund-STP 0.1773 0.1834 0.0119
2 Reliance Medium Term Fund 0.3333 0.3992 0.0137
3 Reliance Short Term Fund 0.1427 0.1373 0.0097
4 Reliance Regular Savings Fund-Debt option 0.2251 0.2381 0.0140
5 Reliance Income Fund - 0.0095 - 0.0094 - 0.0037
6 Reliance Dynamic Bond Fund - 0.0007 - 0.0007 - 0.0015
7 Reliance Gilt Securities Fund 0.0125 0.0121 0.0017
8 Reliance Monthly Income Plan 0.0687 0.1139 0.0143
9 Reliance Corporate Bond Fund 0.1539 0.1553 0.0132
10 Reliance Banking & PSU Debt Fund 0.1408 0.1384 0.0117
VII. FINDINGS
In the present study performance evaluation of the mutual funds is examined from the financing point of view. It is found that UTI-Medium Term Fund has yield the highest average return of 0.073(7.3%) for the past one year when compared with all other funds. Calculation of total risk as measured by standard deviation shows that UTI-Gilt Advantage Fund was the riskiest scheme with the highest standard deviation (0.2536), followed by Reliance Income Fund (0.2364). Beta is less than one to all selected mutual fund schemes which mean the funds are less volatile than the index. From the inception, the Beta value of the selected schemes starts from (0.0191). So, no schemes perform well closely with the benchmark index. The Sharpe ratio of UTI Treasury Advantage Fund (0.4560) maintains 1st rank followed by UTI – Floating Rate Fund (0.4103) and Reliance Medium Term Fund (0.3333). The lowest
Sharpe Ratio found in the case of Reliance Dynamic Bond Fund (-0.0007) The Treynor ratio of UTI- Floating Rate Fund (0.7713) highest ratio, followed by UTI-Treasury Advantage Fund (0.7440), Reliance Medium Term fund (0.3992) and lowest Treynor Ratio found in the case of Reliance Dynamic Bond Fund(-0.0007) The Jensen alpha of UTI-Medium Term Fund (0.0159) found the highest ratio followed by Reliance monthly Income plan (0.0143) and reliance medium term fund. The lowest Jensen ratio found in the case of reliance dynamic bond fund (-0.0015) By comparing the UTI Mutual fund and reliance mutual fund, the UTI Mutual fund ratio becomes the highest value in all three Sharpe, Treynor, and Jensen ratio.
VIII. SUGGESTIONS
Based on the ratio analysis over the years, investors who want the highest returns and are willing to take the moderate risk could invest their fund in UTI- Medium term fund. On the basis of findings of the present study, the important suggestions are as following: Reliance income fund and Reliance dynamic bond fund schemes of Reliance Mutual Funds have shown negative Sharpe, Treynor and Jensen ratios which shows that the fund managers failed to forecast appropriate security prices in time, which result in poor performance. It is suggested that Reliance Mutual Fund should strengthen their Research and Development Department in order to have better future projections. Mutual fund as institutional investors should provide the superior return in comparison to the market return by ensuring professional market analysis, optimum diversification of portfolios, minimizing of risk and investing at a proper time.
IX. CONCLUSION
The Present study investigates the performance of 20 open-ended, Debt Schemes for the period of April 2017 to March 2018 (one year) of a transition economy. Daily closing NAV of different schemes has been used to calculate the returns from the fund schemes. The historical performance of the selected schemes was evaluated on the basis of Sharpe, Treynor, Jensen measure whose results will be useful for investors for taking better investment decisions. The Mutual Fund investors in India belong to middle class and do not have good exposure in the field up investment management. They are also not aware of recent development in the capital markets. So there is an urgent need for making an extensive campaign and publicity in this respect. The central government, SEBI, AMFI, Mutual Fund companies etc. should take necessary steps to educate the people in the field.
REFERENCES
[1] Dr. R. Perumal (2016). "Performance of selected bank mutual fund schemes impact in investors decision making", International Journal of advanced research in
management and social sciences.
[3] Poonam M Lohana (2013). “Performance evaluation of selected mutual funds”. Pacific business review international
[4] Dr. Shriprakash Soni (2015). “Comparative Analysis of Mutual Fund Schemes available at Kotak Mutual Fund and HD Mutual Fund”. International Journal of
Research in Finance and Marketin
[5] Muralidhar Prasad Ayaluru (2016). “Performance Analysis of Mutual Funds: Selected Reliance Mutual Fund Schemes”.Parikalpana - KIITJournal of
Management, Vol-12(I)
[6] Dr. Mini Jain (2013). “Investor’s Preference towards Mutual Fund In Comparison to other Investment Avenues”. Journal of Indian Research (ISSN: 2321-4155
[7] Agrawal, Deepak (2007), “Measuring Performance of Indian Mutual funds”, www.ssrn.com, paper no.1311761 and PP. 1-1
[8] Dr. Rao, Narayan “Performance Evaluation of Indian Mutual Funds”, www.ssrn.com, paper no.433100 and PP.1-2
[9] Jayadev M. (1996)’ “Mutual Fund Performance; An Analysis of Monthly Returns”, Finance India, Vol. X, No.1, (March), Page No.73-8