The perception of Polish immigrants in the
Netherlands
The perception of Polish immigrants in the
Netherlands
Afstudeerartikel voor de opleiding Toegepaste Communicatie Wetenschappen,
Universiteit Twente, Enschede
Datum: 12 augustus 2009
Samenvatting vooraf
The perception of Polish immigrants in the Netherlands
Abstract. The three objectives of this study were to examine: (i) the image of the Polish immigrants in the Netherlands among the Dutch citizens; (ii) the identity of the Polish immigrants in the Netherlands; and (iii) the Polish perception of the image of the Polish immigrants in the Netherlands. These three objectives were compared with each other. Based on rather negative attention that the Polish immigrants in the Netherlands receive in the media, it was hypothesized that their image in the Netherlands would be negative, definitely more negative than the identity of the Polish immigrants in the Netherlands and the perception of their image in the Netherlands. The respondents were 116 Dutch citizens and 224 Polish immigrants in the Netherlands. The results rejected the hypotheses, remarkably showing the opposite of the expected. The image of the Polish immigrants in the Netherlands appeared not to be negative, contrary to the Polish identity which was negative, definitely more negative than their image. Also the Polish perception of the image of the Polish immigrants in the Netherlands was more negative than their image in the Netherlands among the Dutch citizens.
Key words:image, identity, immigrants, integration, Netherlands
1. Introduction
On the 1st of May 2004 ten countries joined the European Union, among them Poland. Many people saw in this development a chance for a new and better life, since not only the country borders opened, but also a new and better labor market. This particularly refers to post-communist countries, such as Poland, where unemployment was relatively high, 9-20% (Money, 2009) in the last 10 years, so many people decided to migrate in a search for a new, better paid job. One of the popular destinations was and still is the Netherlands.
The Netherlands has been characterized by Waldrauch and Hofinger (1997) as one of the most immigrants welcoming countries. For years the traditional immigrant groups in the Netherlands were Turks, Surinamers, Moroccans and Antilleans. The new immigrant groups, such as the Polish one, bring new relationships between allochtons and autochtons. These relations are highly dependent on the immigrants’ ability for acculturation.
psychologically, with the combination of the two cultures (the original and the new one) they experience. According to Berry (1980) acculturation is based on two dimensions: (i) the degree to which immigrants find it important to have contacts and relationships with the majority group (autochthons) and (ii) the degree to which immigrants’ value and desire the maintenance of their cultural features. Based on these findings Berry et al. (1992) distinguish four different strategies of acculturation: (i) assimilation: it is not important to the minority to maintain their culture and identity, but important to join the dominant society; (ii) integration: it is important to the minority to have contacts with the dominant society, but they wish to maintain their ethic identity; (iii) separation: it is not important to the minority to have contacts with the dominant society, they just wish to maintain their ethnic identity; (iv) marginalization: the minority loses contact with their own culture and the dominant society (for example by exclusion). It seems that the Dutch prefer when immigrants assimilate or integrate in the Netherlands (Oudenhoven et al., 1998), with a clear preference for assimilation (Oudenhoven and Eissen, 1998; Verkuyten and Thijs, 2002). This preference for assimilation could be explained with the similarity-attraction hypothesis (Byrne, 1969), which states that people feel more attracted to similar than to dissimilar others. This gives them the confirmation that their beliefs, attitudes and behaviours are right.
The Polish culture is not very different from the Dutch. There are some differences, but not a big gulf between the two cultures. Boom et al. (2008) explain that the reason for this is the religion that the two countries share (Christianity) and their common history. One therefore would expect that integration (or even assimilation) would follow smoothly. In many cases however, this process is not smooth due to the specific profile of the Polish immigrant: The Polish immigrants who come to the Netherlands are young, with secondary or higher education. These are people who are usually employed in Poland, but come to the Netherlands and are motivated to work in other occupations (often under-qualified) and even for a minimum wage, which is still higher that their salary in Poland (Ecorys, 2006; Duszczyk & Wisniewski, 2007). Many of the Polish immigrants come to the Netherlands temporarily and do not make any effort to learn the Dutch language and culture or to make contacts with the Dutch society.
1. What perception do the Dutch citizens have about the Polish immigrants in the Netherlands (in this study referred to as the image);
2. What perception do the Polish immigrants have about the Polish immigrants in the Netherlands? (in this study referred to as the identity);
3. What perception do the Polish immigrants have of their image among the Dutch citizens? (in this study referred to as the perception of the image).
2. Formation of image
Bromley (2000) states, that people form an image by processing information at three levels: (i) the primary level, based on personal experience, (ii) the secondary level, based on experience of others and (iii) the tertiary level, based on experience from the media. The processing of information on the primary level, i.e. based on the direct, personal experience, has the largest influence on the image. However, the possibilities of the direct exchange of personal experiences between Polish and Dutch are limited. In the Netherlands there are many Dutch citizens who have never been in contact with Polish immigrants and consequently know nothing about them from personal experience. This is largely because many Polish, who come to work to the Netherlands, do not try to get in contact with the Dutch, but rather associate with other Polish immigrants, mainly at work. This is why despite their indirect nature, the secondary and tertiary level are also highly important; the secondary level because of the social character of the Dutch and their many contacts, and the tertiary level because of widest access. For many Dutch the media represent the only source of information about the Polish immigrants in the Netherlands.
The Polish immigrants in the Netherlands receive much and often negative attention in the Dutch media. The following headlines are just a few examples: “Are the Polish immigrants a curse or a blessing?” (NRC, 2007); “No extra money against the nuisance of the Polish, but a plan of action” (Nu.nl, 2007); “Over 1000 Polish drivers arrested for drunkenness” (De Telegraaf, 2009); “Polish rob a shop” (Algemeen Dagblad, 2007); etc.
similar results, which confirm that media do have influence on the image that people form about a country.
Following the published information about the perception of Polish immigrants in the Netherlands, and the three research questions stated above, the three respective hypothesis can be defined: 1) the image of the Polish immigrants in the Netherlands is negative among the Dutch citizens; 2) the Polish immigrants in the Netherlands perceive their identity as more positive than their image among the Dutch citizens 3) the perception of the Polish immigrants in the Netherlands of their image, is more positive than their image among the Dutch citizens.
3. Projective techniques
In this research the image of the Polish immigrants in the Netherlands was measured by using projective techniques. A projective technique is an instrument that is sensitive to the unconscious aspects of human behaviour. It permits and encourages a variation of the responses of the person and is highly multidimensional. It also stimulates unusually rich and excessive responses with a minimum awareness of the purpose of the research (Lindzey, 1961). Although there are many different, qualitative and quantitative, techniques for such a measurement (van Riel, 1997; Bouwman, 1998), projective methods have a few advantages which make the use of them in this research highly suitable. The most important reason is the fact that they permit working with pictures rather than with words, which prevents potential miscommunication by translation. Yet, it is important that they take into account cultural and interpretation differences. Projective methods are highly suitable when doing research on the norms, values, personalities and other aspects related to an individual, that are difficult to examine other way (Webb, 1992). They give the respondents the opportunity to answer intuitively, without the worry that they would have to explain their feelings (Catterall and Ibbotson, 2000). This can result in more honest answers and in unconscious expression of emotion. Projective techniques allow for expressing feelings, without the need to search for words (Hofstede et al., 2007; Kay, 2001). They are creative, relatively unusual and unknown to many people, which results in unbiased participation in a research (Catterall and Ibbotson, 2000; Gordon & Langmaid, 1998). They are also useful for both qualitative and quantitative research (Levy, 1994)
helped them to assess and to compare food. Oswick and Montgomery (1999) asked the respondents to compare business companies to pictures of animals and to pictures of car parts. In both cases the researchers were enthusiastic about the use and possibilities of the projective techniques, and the validity of their research method. Thanks to these features it is also proposed in this paper to use the metaphor-based questionnaire, based on pictures of animals. These pictures will be combined with the personality theory of Cattell (Cattell, 1973), because of its wide range of personality factors. Most personality theories are based on 5 or even less dimensions (Sanderman et al., 1995) i.e. Eysencks personality theory (Eysenck, 1976) or the Big Five (Digman, 1989; Ewen, 1998). The personality theory of Cattell is based on 16 personality factors ‘the sixteen Personality Factor Inventory’, or ‘16 PF’ (Ewen, 1998). These factors are presented in terms of bipolar adjectives, which results in 32 personality factors. This gives space for a wide scale of factors on which the main questionnaire will be based.
To address the main objective of this study, the pictures of animals will be used in combination with the 32 (2x16) factors of Cattell.
4. Method
For the purpose of this research a main questionnaire with the use of animal pictures had to be designed. However, before that the validation of the animal pictures was necessary. The section below gives a short description of the process of validating the pictures and designing the main questionnaire.
4.1. Development of a photoset
Once it was decided that the study would be based on pictures of animals, it was crucial to stipulate, which personality qualities the animals on the pictures represented. To this end 8 persons were invited, 4 female and 4 male two of whom were Polish and six Dutch. Their average age was 33.6 years, raging from 25 to 60. The focus group was introduced by the researcher to the 32 (2x16) personality factors of Cattell (Ewen, 1998), such as bright-dull, dominant-modest, liberal-conservative etc. and was asked to name the animals that came up in their minds, hearing the specific personality factor. This resulted in a list of 50 different animals.
were ranked. The first named personality factor was the most suitable one and weighed 3 points, the second 2 points and the third 1 point. Besides, there was also room in the questionnaire for the addition of other personality qualities to the animals.
53 respondents took part in this test of which 28 were females and 25 males. The average age was 31 years, ranging from 17 to 61. 60% of the respondents were Dutch and 40% were Polish.
Because of the possibility of giving more than one answer, some pictures scored high on two or 3 personality factors. Therefore another questionnaire was designed. In the new questionnaire, instead of 50 animals, only 24 animals were used, those with the highest scores. Also the personality factors of the animals were adjusted i.e. some of them that had been most frequently chosen were maintained, the least frequently used rejected and some new added. The Cattell’s personality factors together with new additions are further referred as personality characteristics. In the new set up, every animal got 4 or 5 characteristics of which the respondents had to choose just one (multiple-choice questionnaire). Also in that questionnaire, there was room for additional answers, to test if any other essential answer was not missing.
57 persons took part in the second questionnaire, 30 females and 27 males. The average age was 33 years old, with minimum of 17 and maximum of 70. 64 % of the respondents were Dutch and 36 % Polish.
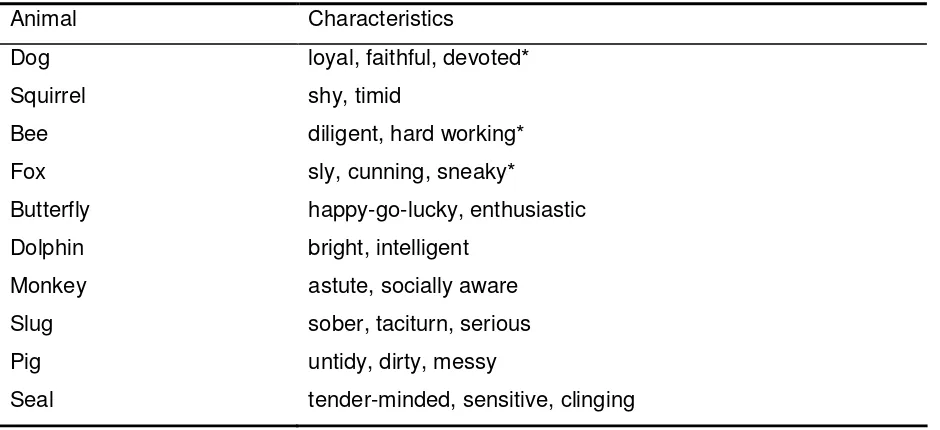
[image:9.595.66.536.544.759.2]The animals that scored on a particular characteristic in more than 80% of the cases were chosen for the main research questionnaire. The 15 chosen animals are described in Table 1 and presented in the appendix.
Table 1
The characteristics associated with the animals
Animal Characteristics
Dog loyal, faithful, devoted*
Squirrel shy, timid
Bee diligent, hard working*
Fox sly, cunning, sneaky*
Butterfly happy-go-lucky, enthusiastic
Dolphin bright, intelligent
Monkey astute, socially aware
Slug sober, taciturn, serious
Pig untidy, dirty, messy
Tortoise relaxed, tranquil, composed
Parrot noisy, loud, busy*
Lion dominant, assertive, competitive
Sloth lazy, languid, work-shy*
Peacock proud, haughty*
Note: * the extra characteristics that were added by the respondents
4.2. Main questionnaire
The main questionnaire consisted of an introduction and two main parts, picture assessment and verbal assessment. In the introduction, a number of socio-demographic questions were asked. In the picture assessment, the 15 chosen pictures of the animals were combined with a 7-point Likert scale (Likert, 1932). The respondents could rank how well the pictures apply to the Polish community in the Netherlands. The picture assessment ended with an open question, where the participants were asked to choose an animal that, in their opinion, matched the best with the Polish immigrants in the Netherlands and to explain their choice. In the verbal assessment, the personality characteristics were used, but with words instead of animal pictures. The respondents had to rank the characteristics that were presented in pairs (bipolar), for example “lazy-diligent”. Again the 7 point Likert’s scale was used. If the respondents assessed the Polish immigrants with 1, it meant they found them very lazy. If the respondents assessed the Polish immigrants with 7, it meant they found them very diligent. The 4 was used when a respondent did not have any focused opinion. The main objective of the verbal assessment in the questionnaire was to validate the picture assessment, where a new method was used.
4.3. Sample
participants were from different regions of the Netherlands. Group 3 consisted of 118 Polish immigrants in the Netherlands assessing Dutch perception of the Polish immigrants in the Netherlands (perception of the image); 29.7% were females and 70.3% males; 94.9% had a Polish nationality, 1.7% only Dutch nationality (born in Polish families), 1.7% Polish and Dutch nationality, and 1.7% other nationality; the average age was 28.1 years, raged from 13 to 50; the participants were from different regions of the Netherlands. The average age of the Polish participants was much lower than the average age of the Dutch. This is because the majority of the Polish respondents were young laborers, who left Poland in search for simple, but often hard work.
4.4. Procedure
The main questionnaire has been designed in two languages, Polish and Dutch, in two formats, in hardcopy and digital. To reach the participants, two ways of recruiting were used. For the Dutch, the questionnaires were distributed in different cities in the Netherlands personally by the researcher and by e-mail. To recruit the Polish people in the Netherlands the links to the questionnaires were posted on several websites of the Polish community in the Netherlands and also 1000 e-mails were sent to randomly selected members of the Polish web portal “Nasza-Klasa”, subscribing 35.000 Polish in the Netherlands. All the participants were given the opportunity to receive the results of this research. Out of the 340 questionnaire respondents, 253 (74.4%) requested for the results of this study.
5. Results
[image:11.595.70.530.658.756.2]To find out what image the Polish immigrants have in the Netherlands, the scores of the three groups were analyzed and compared using the One-way ANOVA Test. The results of the picture assessment of the questionnaire are presented in Table 2. It shows the average scores of every group per animal and the differences between the groups in the scores.
Table 2
The Mean Scores of the Picture Assessment at the Scale 1 to 7
Animal Group 1
N = 116
Group 2 N = 106
Group 3 N = 118
Dog (loyal, faithful, devoted) 3,76a,b 3,13a 3,11b
Squirrel (shy, timid) 3,59 3,65 3,62
Fox (sly, cunning, sneaky) 3,91a,b 5,53a,c 4,81b,c
Butterfly (happy-go-lucky, cheerful) 2,75 2,68 3,01
Dolphin (bright, intelligent) 2,83 2,62 2,76
Monkey (astute, socially aware) 3,27a,b 4,10a 3,97b
Slug (sober, taciturn, serious) 2,82 2,94c 2,41c
Pig (untidy, dirty, messy) 3,71a,b 4,87a 4,63b
Seal (tender-minded, sensitive, clinging) 2,72 2,33 2,53 Tortoise (relaxed, tranquil, composed) 2,61 2,84c 2,20c
Parrot (noisy, loud, busily) 3,16a,b 4,08a 4,11b
Lion (dominant, assertive, competitive) 3,15b 3,35 3,81b Sloth (lazy, languid, work-shy) 2,09a 2,99a,c 2,30c
Peacock (proud, haughty) 3,16a,b 4,42a 4,10b
Note: a: p<0.05 group 1 and 2; b: p<0.05 group 1 and 3; c: p<0.05 group 2 and 3
The most outstanding results of the picture assessment are: (i) a dog, representing loyalty, got in each of the three groups an average score a bit lower than a 4. However, the difference between the perception of Polish immigrants (group 2 and 3) and the Dutch (group 1) was significant. The Dutch rated Polish immigrants higher on loyalty, than the Polish immigrants did themselves and than they expect the Dutch did; (ii) a bee, representing diligence, got in each of the three groups a high score, around 5, with no significant difference between the groups; (iii) a fox, representing sneakiness, got from each of the three groups a significant different average score; the Dutch rated the Polish immigrants on this characteristic, with 3.91; Polish immigrants rated themselves with 5.53; and Polish immigrants expected the Dutch to rate them with a 4.81. The Polish find themselves sneakier, than the Dutch in fact do and they expect the Dutch to rate them higher on the characteristic sneakiness, than the Dutch actually do; (iv) a pig, representing messiness, got from the Dutch (group 1) an average score lower than a 4, and from both groups of Polish immigrants (group 2 and 3) an average scores higher than four. These differences are significant; (v) a parrot, representing noisiness, got from the Dutch an average score a bit higher than 3, and from both groups of Polish immigrants, average scores higher than 4. These differences are significant; (vi) a peacock, representing pride, got from the Dutch an average score a bit higher than 3, and from both groups of Polish immigrants, average scores higher than 4. These differences are significant.
first group, the Dutch, chose most frequently the following animals: a bee, because they think of the Polish immigrants as diligent people, who come to the Netherlands for hard work; a fox, because the Polish immigrants are sly and have to act smart to survive in a foreign country; a dog, because they are loyal and friendly and a squirrel, because they are shy and hoard up their savings.
The results of the second group, the Polish immigrants describing their identity and the third group, the Polish immigrants assessing their image, were the same. The participants of those groups chose most frequently the following animals: a fox, because they find the Polish immigrants in the Netherlands sneaky, sometimes vicious and able to do anything just to achieve the goal; a bee, because they think of the Polish immigrants as diligent people, who come to the Netherlands for hard work; a pig because they find them messy, especially after having a few drinks and a parrot because they claim the Polish immigrants to be noisy and haughty, especially after drinks.
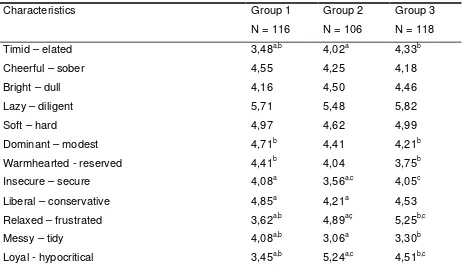
[image:13.595.68.531.448.718.2]The results of the verbal assessment of the questionnaire are presented in Table 3. It shows the average scores of every group per animal and the differences between the groups in the scores.
Table 3
The Means Scores of the Verbal Assessment at the Scale 1 to 7
Characteristics Group 1
N = 116
Group 2 N = 106
Group 3 N = 118
Timid – elated 3,48a,b 4,02a 4,33b
Cheerful – sober 4,55 4,25 4,18
Bright – dull 4,16 4,50 4,46
Lazy – diligent 5,71 5,48 5,82
Soft – hard 4,97 4,62 4,99
Dominant – modest 4,71b 4,41 4,21b
Warmhearted - reserved 4,41b 4,04 3,75b
Insecure – secure 4,08a 3,56a,c 4,05c
Liberal – conservative 4,85a 4,21a 4,53
Relaxed – frustrated 3,62a,b 4,89aç 5,25b,c
Messy – tidy 4,08a,b 3,06a 3,30b
Loyal - hypocritical 3,45a,b 5,24a,c 4,51b,c
The most outstanding results of the verbal assessment are: (i) timid/elated, got significant lower score from the Dutch, than from the two groups of Polish immigrants (higher than four). This means that the Dutch find Polish immigrants in the Netherlands more timid than Polish immigrants find themselves and that the perception of the Dutch concerning the timidity of the Polish immigrants in the Netherlands lower is than the Polish expect them to be; (ii) lazy/diligent, got in each of the three groups a high score, higher than 5, with no significant difference between the groups; (iii) relaxed/frustrated, got from each of the three groups a significant different average score: the Dutch rated the Polish immigrants on this characteristic, with 3.62, Polish immigrants rated themselves with 4.89 and Polish immigrants expected the Dutch to rate them with a 5.25. The Dutch find the Polish immigrants significantly less frustrated than the Polish find themselves and expect the Dutch to do; (iv) messy/tidy, got from the Dutch significantly lower average score (less messy) than from the Polish immigrants. Polish immigrants in the Netherlands find themselves and expect the Dutch to think of them as more messy, than the Dutch actually do; (v) loyal/hypocritical, got from each of the three groups a significantly different average score; the Dutch rated the Polish immigrants on this characteristic, with an average of 3.45; Polish immigrants rated themselves with an average of 5.24; and Polish immigrants expected the Dutch to rate them with an average of 4.51. The Polish find themselves more hypocrite, than the Dutch in fact do and they expect the Dutch to rate them lower on the characteristic loyalty, than the Dutch actually do.
6. Discussion
The main aim of this study was to investigate the perception of Polish immigrants in the Netherlands so the questionnaire tests prepared and carried out over Dutch and Polish respondents were designed to fulfil that objective. Following the first hypothesis, the expectation was that, because of the often bad publicity and negative comments in the media about Polish immigrants, their image in the Netherlands would be negative. Following the second and third hypothesis, the expectation was that the identity of the Polish immigrants in the Netherlands and their perception of their image would be more positive than their image. The results of the questionnaire were very surprising. The image of the Polish immigrants in the Netherlands appeared not to be negative, contrary to the Polish identity which was definitely more negative than their image. Also the perception of the image of the Polish immigrants in the Netherlands was more negative than their image.
Dutch citizens see Polish in the Netherlands as very hard workers, who come to the Netherlands to earn and save some money to support their family in Poland. They also think that Polish immigrants have to be sneaky and act smart to survive in a foreign country such as the Netherlands and they are loyal and friendly, but also timid and reserved. Polish immigrants in the Netherlands perceive themselves as hard workers, but they think of themselves as very sneaky, frustrated and hypocrite, able to do anything just to achieve their goal. Besides, they confess to be noisy and messy, especially after having too many drinks. Despite of that, they are very proud to be Polish, even up to being arrogant. Interesting is that their perception of their image in the Netherlands is similarly negative as their identity. This suggests that they expect the Dutch to see them the same negative way as they see themselves.
The results of both parts of the questionnaire, the picture and the verbal assessment rejected the three stated hypothesis proving the exact opposite. The question is: how is it possible that the identity of the Polish in the Netherlands and the perception of their image are so negative?
theory of Merton is that the Dutch citizens actually will get a negative image of the Polish. This is likely still to happen, when the Dutch will get in contact with the Polish more often.
The method of this study in which the pictures of the animals were assessed by the scale of Likert was confirmed to be valid. The verbal assessment of the questionnaire, designed for validation purpose, showed almost the same results as the picture assessment where photos were used. There were only three animals that did not correspond well in the two assessments. Characteristic “timid” (squirrel), showed a significant difference between group 1, 2 and 3 (a and b) in the verbal assessment of the questionnaire, and not in the picture assessment. However, in the open question of the picture assessment, the Dutch participants (group 1), in contrast to Polish, mentioned the squirrel frequently as a positive image expression. Also the results of tortoise and of the slug in the picture assessment deviated from the results in the verbal assessment. This can be explained by the extra addition of behaviour characteristics to the animals by the participants. For instance, a squirrel is a collector, resembling that Polish immigrants come to the Netherlands to save up some money, before they go back to Poland. The slug and the tortoise remind the participants of something slow, as opposed to the hard workers.
Another remarkable issue is the interpretation of the characteristic of a fox. All the three interviewed groups interpreted this animal as a characteristic “sneaky”, which was confirmed in the open question of the picture assessment, but group 1, i.e. the Dutch participants, saw this sneakiness in the Polish immigrants as something unavoidable and necessary to survive in a foreign country, while Polish participant saw the sneakiness as a bad personal quality of the Polish immigrants in the Netherlands. This can be clarified by the double meaning of the word “sneaky”, namely “clever” but also “sly”.
The present study was a first step in the research on the perception of the Polish immigrants in the Netherlands. It provided surprising conclusions rejecting earlier stated hypothesis but also clearly defined avenue for the further research in this exciting direction.
7. Conclusion and recommendations
- The image of the Polish immigrants in the Netherlands was neutral, and not negative, which contradicted the first hypothesis; the Dutch citizens think that the Polish immigrants in the Netherlands are hard workers, who sometimes have to be sneaky and act smart to survive in a foreign country, however they are loyal and friendly people, but often shy and reserved.
- The identity of the Polish immigrants in the Netherlands was negative and certainly more negative than their image, which contradicted the second hypothesis; the Polish immigrants in the Netherlands percept themselves as hard workers, however sneaky, frustrated and hypocrite, able to do anything just to achieve their goal; besides they are noisy and messy, especially after having too many drinks but very proud of being Polish up to being arrogant sometimes.
- The Polish perception of the image of the Polish immigrants in the Netherlands was negative and certainly more negative than real image which contradicted the third hypothesis; they expect that the Dutch perceive that they work hard; they think that the Dutch find them sneaky, frustrated, hypocritical, very messy and noisy but hard workers, proud and rather not timid; this result was close to the result of identity investigation.
- In order to better understand why Dutch percept Polish immigrants in the Netherlands better than Polish themselves and why the identity of the Polish immigrants is negative it is recommended to carry similar projective tests as proposed in this study classifying the results with respect to: the length of stay in the Netherlands, the social status, education, age and gender.
References
AD (2007). Retrieved June 23, 2009, from AD Web site:
http://www.ad.nl/groenehart/article1811404.ece?pageNumber=2.
Berry, J. W. (1980). Acculturation as varieties of adaptation. In A. Padilla (ed.), Acculturation: theory, models and some new findings, 9-25. Boulder, CO: Westview.
Berry. J. W., Poortinga, Y. H., Segall, M. H., & Dasen, P. R. (1992). Cross-cultural psychology: research and applications. Cambridge: Cambridge University Press.
Boom, J. de, Weltevrede, A., Rezai, S. & Engbersen G. (2008). Oost-Europeanen in Nederland; een verkenning van de maatschappelijke positie van migranten uit Oost-Europa en migranten uit voormalig Joegoslavië. Rotterdam: RISBO Contractresearch BV / Erasmus Universiteit.
Bouwman, M.I. (1998). Op zoek naar het merkimago. Mogelijkheden en beperkingen van verschillende onderzoekstechnieken. SWOCC.
Bromley, D.B. (2000). Psychological aspects of corporate identity, image and reputation.
Corporate Reputation Review, 3 (2), 240-252.
Byrne, D. (1969) Attitude and attraction. In L. Berkowitz (Ed.), Advances in experimental and social psychology, 4, New York,Academic Press
Cattell, R.B. (1973). Personality and mood by questionnaire. San Francisco: Jossey-Bass.
Catterall, M. & Ibbotson, P. (2000). Using projective techniques in education research. British Educational Journal, 26 (2), 245-56.
De Telegraaf (2009). Retrived on June 23, 2009, from De Telegraaf Web site: http://www.telegraaf.nl/buitenland/4150332/__Dronken
_Polen_in_verkeer_opgepakt__.html.
Duszczyk, M & Wiśniewski, J. (2007). Analiza SpoƗeczno-demograficzna migracji zarobkowej
Polaków do Państw EOG po 1 maja 2004 roku. Instytut Spraw Publicznych / Institute of Public Affairs.
Ecorys (2006). Evaluatie werknemersverkeer MOE-landen. Ecorys,Rotterdam.
Ewen, R. B. (1998). Personality: a topical approach. Mahweh, NJ: Erlbaum.
Eysenck, H.J. (1976). The measurement of personality. Lancaster: Medical and Technical Publishers.
Gordon, W. & Langmaid, R. (1988). Qualitative market research: a practitioner’s and buyer’s guide. Alderschot: Gower Publishing Company Limited.
Graves, T. (1967). Psychological acculturation in a tri-ethnic community. South-Western Journal of Anthropology, 23, 337-350.
Hofstede, A., Van Hoof, J.J., Walenberg, N., & De Jong, M.D.T. (2007). Projective techniques for brand image research: two personification-based methods explored.
Qualitative Market Research, 10 (3), 300-309.
Hussey, M. and Duncombe, N. (1999). Projecting the right image: using projective techniques to measure brand image, Qualitative Market Research, 2 (1), 22-30.
Kay, D. (2001). Going beyond words: how researchers are using projective techniques to better understand people’s view of brands. Marketing Magazine, 106, 22.
Levy, S.J. (1994). Interpreting consumer mythology: structural approach to consumers behavior focuses on story telling. Marketing Management, 2 (4), 4-9.
Likert, R. (1932). A technique for the measurement of attitudes. New York: Archives of Psychology.
Mc Quail, D. (1979). The influence and effects of mass media. In J. Curran, M. Gurevitch, J. Woolacott (ed.), Mass communication and society, 70-93. Beverly Hills, California: Sage Publications.
Merton, R. K. (1948). The self-fulfilling prophecy. Antioch Review, 8, 193–210.
Money (2009). Retrieved July 2, 2009, from Money Web site: http://www.money.pl/gospodarka/ wskazniki/pkb/.
NRC (2007). Retrieved June 23, 2009, from NRC Web site: http://weblogs2.nrc.nl/discussie/2007/12/11/zijn-de-poolse-migranten-een-vloek-of-een-zegen/.
Nu.nl (2007). Retrieved June 23, 2009, from Nu.nl Web site:
http://www.nu.nl/algemeen/1352791/geen-extra-geld-voor-overlast-polen-wel-actieplan-video.html.
Oswick, C. and Montgomery, J. (1999). Images of an organization: the use of metaphor in a multinational company. Journal of Organizational Change Management, 12 (6), 501-23.
Oudenhoven, J. P. van, Prins, K., & Buunk, B. (1998). Attitudes of minority and majority members towards adaptation of immigrants. European Journal of Social Psychology, 28, 995-1013.
Oudenhoven, J.P. van, Eisses, A.M. (1998). Integration and assimilation of Maroccan immigrants in Israel and The Netherlands. International Journal of Intercultural relations, 11 (2), 182-296.
Riel, C.B.M. van (1997). Identiteit en imago: grondslagen van corporate communication. Schoonhoven: Academic Service.
Sanderman, R., Arrindell, W. A., Ranchor, A. V., Eysenck, H. J., & Eysenck, S. B. G. (1995).
Verkuyten, M. & Thijs, J. (2002). Multiculturalism among minority and majority adolescents in the Netherlands. International Journal of Intercultural Relations, 26, 91-108.
Waldrauch, H., & Hofinger, C. (1997). An index to measure the legal obstacles to the integration of migrants. New Community, 23, 271-285.
Wanta W., Golan, G. & Lee, C. (2004). Agenda setting and international news: media influence on public perceptions of foreign nations. Journalism & MassCommunication Quarterly, 81, 2, 364-377.