313
Sentence-Level Fluency Evaluation:
References Help, But Can Be Spared!
Katharina Kann∗
Center for Data Science New York University
New York, USA [email protected]
Sascha Rothe
Google Research Zurich, Switzerland [email protected]
Katja Filippova
Google Research Berlin, Germany [email protected]
Abstract
Motivated by recent findings on the proba-bilistic modeling of acceptability judgments, we propose syntactic log-odds ratio (SLOR), a normalized language model score, as a met-ric for referenceless fluency evaluation of nat-ural language generation output at the sentence level. We further introduce WPSLOR, a novel WordPiece-based version, which harnesses a more compact language model. Even though word-overlap metrics like ROUGE are com-puted with the help of hand-written references, our referenceless methods obtain a signifi-cantly higher correlation with human fluency scores on a benchmark dataset of compressed sentences. Finally, we present ROUGE-LM, a reference-based metric which is a natural ex-tension of WPSLOR to the case of available references. We show that ROUGE-LM yields a significantly higher correlation with human judgments than all baseline metrics, including WPSLOR on its own.
1 Introduction
Producing sentences which are perceived as natu-ral by a human addressee—a property which we will denote asfluency1throughout this paper —is a crucial goal of all natural language generation (NLG) systems: it makes interactions more natu-ral, avoids misunderstandings and, overall, leads to higher user satisfaction and user trust (Martin-dale and Carpuat,2018). Thus, fluency evaluation is important, e.g., during system development, or
∗
*This research was carried out while the first author was interning at Google.
1Alternative names include
naturalness, grammaticality or readability. Note that the exact definitions of all those terms vary slightly throughout the literature.
If access to a synonym dictionary is
likely to be of use, then this package may 3 be of service.
Participants are invited to submit a set
pair do domain name that is already 1.6 taken along with alternative.
Even $15 was The HSUS. 1
Table 1: Example compressions from our dataset with their fluency scores; scores in[1,3], higher is better.
for filtering unacceptable generations at applica-tion time. However, fluency evaluaapplica-tion of NLG systems constitutes a hard challenge: systems are often not limited to reusing words from the input, but can generate in anabstractiveway. Hence, it is not guaranteed that a correct output will match any of a finite number of given references. This results in difficulties for current reference-based evaluation, especially of fluency, causing word-overlap metrics like ROUGE (Lin and Och,2004) to correlate only weakly with human judgments (Toutanova et al.,2016). As a result, fluency eval-uation of NLG is often done manually, which is costly and time-consuming.
lan-guage models (LMs) can be used for modeling hu-man ratings of acceptability. Namely, they found SLOR (Pauls and Klein, 2012)—sentence probability which is normalized by unigram log-probability and sentence length—to correlate well with acceptability judgments at the sentence level. However, to the best of our knowledge, these insights have so far gone disregarded by the natu-ral language processing (NLP) community. In this paper, we investigate the practical implications of Lau et al.(2017)’s findings for fluency evaluation of NLG, using the task of automatic compression (Knight and Marcu,2000;McDonald,2006) as an example (cf. Table 1). Specifically, we test our hypothesis that SLOR should be a suitable met-ric for evaluation of compression fluency which (i) does not rely on references; (ii) can naturally be applied at the sentence level (in contrast to the system level); and (iii) does not need human flu-ency annotations of any kind. In particular the first aspect, i.e., SLOR not needing references, makes it a promising candidate for automatic evaluation. Getting rid of human references has practical im-portance in a variety of settings, e.g., if references are unavailable due to a lack of resources for anno-tation, or if obtaining references is impracticable. The latter would be the case, for instance, when filtering system outputs at application time.
We further introduce WPSLOR, a novel, Word-Piece (Wu et al., 2016)-based version of SLOR, which drastically reduces model size and training time. Our experiments show that both approaches correlate better with human judgments than tradi-tional word-overlap metrics, even though the latter do rely on reference compressions. Finally, inves-tigating the case of available references and how to incorporate them, we combine WPSLOR and ROUGE to ROUGE-LM, a novel reference-based metric, and increase the correlation with human fluency ratings even further.
Contributions. To summarize, we make the fol-lowing contributions:
1. We empirically show that SLOR is a good referenceless metric for the evaluation of NLG fluency at the sentence level.
2. We introduce WPSLOR, a WordPiece-based version of SLOR, which disposes of a more compact LM without a significant loss of per-formance.
3. We propose ROUGE-LM, a reference-based metric, which achieves a significantly higher correlation with human fluency judgments than all other metrics in our experiments.
2 On Acceptability
Acceptability judgments, i.e., speakers’ judgments of the well-formedness of sentences, have been the basis of much linguistics research (Chomsky, 1964;Sch¨utze,1996): a speakers intuition about a sentence is used to draw conclusions about a language’s rules. Commonly, “acceptability” is used synonymously with “grammaticality”, and speakers are in practice asked for grammatical-ity judgments or acceptabilgrammatical-ity judgments inter-changeably. Strictly speaking, however, a sen-tence can be unacceptable, even though it is gram-matical – a popular example is Chomsky’s phrase “Colorless green ideas sleep furiously.” (Chom-sky, 1957) In turn, acceptable sentences can be ungrammatical, e.g., in an informal context or in poems (Newmeyer,1983).
Scientists—linguists, cognitive scientists, psy-chologists, and NLP researcher alike—disagree about how to represent human linguistic abili-ties. One subject of debates are acceptability judg-ments: while, for many, acceptability is a bi-nary condition on membership in a set of well-formed sentences (Chomsky, 1957), others as-sume that it is gradient in nature (Heilman et al., 2014;Toutanova et al., 2016). Tackling this re-search question,Lau et al.(2017) aimed at model-ing human acceptability judgments automatically, with the goal to gain insight into the nature of hu-man perception of acceptability. In particular, they tried to answer the question: Do humans judge ac-ceptability on a gradient scale? Their experiments showed a strong correlation between human judg-ments and normalized sentence log-probabilities under a variety of LMs for artificial data they had created by translating and back-translating sen-tences with neural models. While they tried dif-ferent types of LMs, best results were obtained for neural models, namely recurrent neural networks (RNNs).
3 Method
In this section, we first describe SLOR and the intuition behind this score. Then, we introduce WordPieces, before explaining how we combine the two.
3.1 SLOR
SLOR assigns to a sentenceSa score which con-sists of its log-probability under a given LM, nor-malized by unigram log-probability and length:
SLOR(S) = 1
|S|(ln(pM(S)) (1)
−ln(pu(S)))
where pM(S) is the probability assigned to the
sentence under the LM. The unigram probability
pu(S)of the sentence is calculated as
pu(S) =
Y
t∈S
p(t) (2)
withp(t)being the unconditional probability of a tokent, i.e., given no context.
The intuition behind subtracting unigram log-probabilities is that a token which is rare on its own (in contrast to being rare at a given position in the sentence) should not bring down the sentence’s rating. The normalization by sentence length is necessary in order to not prefer shorter sentences over equally fluent longer ones.2 Consider, for in-stance, the following pair of sentences:
(i) He is a citizen of France.
(ii) He is a citizen of Tuvalu.
Given that both sentences are of equal length and assuming that France appears more often in a given LM training set than Tuvalu, the length-normalized log-probability of sentence (i) under the LM would most likely be higher than that of sentence (ii). However, since both sentences are equally fluent, we expect taking each token’s un-igram probability into account to lead to a more suitable score for our purposes.
We calculate the probability of a sentence with a long-short term memory (LSTM, Hochreiter and Schmidhuber(1997)) LM, i.e., a special type of RNN LM, which has been trained on a large corpus. More details on LSTM LMs
2Note that the sentence log-probability which is
normal-ized by sentence length corresponds to the negative cross-entropy.
ILP NAMAS SEQ2SEQ T3
fluency 2.22 1.30 1.51 1.40
Table 2: Average fluency ratings for each compression system in the dataset byToutanova et al.(2016).
can be found, e.g., in Sundermeyer et al.(2012). The unigram probabilities for SLOR are estimated using the same corpus.
3.2 WordPieces
Sub-word units like WordPieces (Wu et al.,2016) are getting increasingly important in NLP. They constitute a compromise between characters and words: On the one hand, they yield a smaller vo-cabulary, which reduces model size and training time, and improve handling of rare words, since those are partitioned into more frequent segments. On the other hand, they contain more information than characters.
WordPiece models are estimated using a data-driven approach which maximizes the LM like-lihood of the training corpus as described in Wu et al.(2016) andSchuster and Nakajima(2012).
3.3 WPSLOR
We propose a novel version of SLOR, by incorpo-rating a LM which is trained on a corpus which has been split by a WordPiece3model. This leads to a smaller vocabulary, resulting in a LM with less pa-rameters, which is faster to train (around 12h com-pared to roughly 5 days for the word-based version in our experiments). We will refer to the word-based SLOR as WordSLOR and to our newly pro-posed WordPiece-based version as WPSLOR.
4 Experiment
Now, we present our main experiment, in which we assess the performances of WordSLOR and WPSLOR as fluency evaluation metrics.
4.1 Dataset
We experiment on the compression dataset by Toutanova et al. (2016). It contains single sen-tences and two-sentence paragraphs from the Open American National Corpus (OANC), which belong to 4 genres: newswire, letters, jour-nal, and non-fiction. Gold references are man-ually created and the outputs of 4 compression systems (ILP (extractive), NAMAS (abstractive),
SEQ2SEQ (extractive), and T3 (abstractive); cf. Toutanova et al.(2016) for details) for the test data are provided. Each example has 3 to 5 independent human ratings for content and fluency. We are in-terested in the latter, which is rated on an ordinal scale from 1 (disfluent) through 3 (fluent). We ex-periment on the2955 system outputs for the test split.
Average fluency scores per system are shown in Table 2. As can be seen, ILP produces the best output. In contrast, NAMAS is the worst system for fluency. In order to be able to judge the relia-bility of the human annotations, we follow the pro-cedure suggested byPavlick and Tetreault(2016) and used byToutanova et al.(2016), and compute the quadratic weightedκ(Cohen,1968) for the hu-man fluency scores of the system-generated com-pressions as0.337.
4.2 LM Hyperparameters and Training
We train our LSTM LMs on the English Giga-word corpus (Parker et al.,2011), which consists of news data.
The hyperparameters of all LMs are tuned us-ing perplexity on a held-out part of Gigaword, since we expect LM perplexity and final evalua-tion performance of WordSLOR and, respectively, WPSLOR to correlate. Our best networks con-sist of two layers with 512 hidden units each, and are trained for2,000,000steps with a minibatch size of 128. For optimization, we employ ADAM (Kingma and Ba,2014).
4.3 Baseline Metrics
ROUGE-L. Our first baseline is ROUGE-L (Lin and Och, 2004), since it is the most commonly used metric for compression tasks. ROUGE-L measures the similarity of two sentences based on their longest common subsequence. Gener-ated and reference compressions are tokenized and lowercased. For multiple references, we only make use of the one with the highest score for each example.
N-gram-overlap metrics. We compare to the best n-gram-overlap metrics fromToutanova et al. (2016); combinations of linguistic units (bi-grams (LR2) and tri-grams (LR3)) and scoring measures (recall (R) and F-score (F)). With multiple ref-erences, we consider the union of the sets of n-grams. Again, generated and reference compres-sions are tokenized and lowercased.
Negative cross-entropy. We further compare to the negative LM cross-entropy, i.e., the log-probability which is only normalized by sentence length. The score of a sentenceSis calculated as
NCE(S) = |S1|ln(pM(S)) (3)
withpM(S)being the probability assigned to the
sentence by a LM. We employ the same LMs as for SLOR, i.e., LMs trained on words (WordNCE) and WordPieces (WPNCE).
Perplexity. Our next baseline is perplexity, which corresponds to the exponentiated cross-entropy:
PPL(S) = exp(−NCE(S)) (4)
About BLEU. Due to its popularity, we also per-formed initial experiments with BLEU (Papineni et al., 2002). Its correlation with human scores was so low that we do not consider it in our final experiments.
4.4 Correlation and Evaluation Scores
Pearson correlation. Following earlier work (Toutanova et al.,2016), we evaluate our metrics using Pearson correlation with human judgments. It is defined as the covariance divided by the prod-uct of the standard deviations:
ρX,Y =
cov(X, Y) σXσY
(5)
Mean squared error. Pearson cannot accurately judge a metric’s performance for sentences of very similar quality, i.e., in the extreme case of rating outputs of identical quality, the correlation is ei-ther not defined or0, caused by noise of the evalu-ation model. Thus, we additionally evaluate using mean squared error (MSE), which is defined as the squares of residuals after a linear transformation, divided by the sample size:
MSEX,Y = min f
1
|X| |X| X
i=1
(f(xi)−yi)2 (6)
with f being a linear function. Note that, since MSE is invariant to linear transformations of X
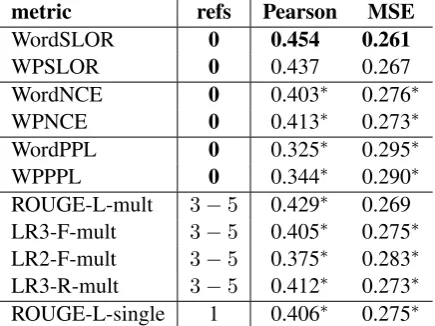
metric refs Pearson MSE
WordSLOR 0 0.454 0.261
WPSLOR 0 0.437 0.267
WordNCE 0 0.403∗ 0.276∗
WPNCE 0 0.413∗ 0.273∗
WordPPL 0 0.325∗ 0.295∗
WPPPL 0 0.344∗ 0.290∗
[image:5.595.73.291.63.226.2]ROUGE-L-mult 3−5 0.429∗ 0.269 LR3-F-mult 3−5 0.405∗ 0.275∗ LR2-F-mult 3−5 0.375∗ 0.283∗ LR3-R-mult 3−5 0.412∗ 0.273∗ ROUGE-L-single 1 0.406∗ 0.275∗
Table 3: Pearson correlation (higher is better) and MSE (lower is better) for all metrics; best results in bold; refs=number of references used to compute the metric.
4.5 Results and Discussion
As shown in Table 3, WordSLOR and WPSLOR correlate best with human judgments: Word-SLOR (respectively WPWord-SLOR) has a 0.025 (re-spectively0.008) higher Pearson correlation than the best word-overlap metric ROUGE-L-mult, even though the latter requires multiple reference compressions. Furthermore, if we consider with ROUGE-L-single a setting with a single given ref-erence, the distance to WordSLOR increases to 0.048 for Pearson correlation. Note that, since having a single reference is very common, this re-sult is highly relevant for practical applications. Considering MSE, the top two metrics are still WordSLOR and WPSLOR, with a0.008and, re-spectively, 0.002 lower error than the third best metric, ROUGE-L-mult.
Comparing WordSLOR and WPSLOR, we find no significant differences: 0.017for Pearson and 0.006for MSE. However, WPSLOR uses a more compact LM and, hence, has a shorter training time, since the vocabulary is smaller (16,000vs. 128,000tokens).
Next, we find that WordNCE and WPNCE per-form roughly on par with word-overlap metrics. This is interesting, since they, in contrast to tradi-tional metrics, do not require reference compres-sions. However, their correlation with human flu-ency judgments is strictly lower than that of their respective SLOR counterparts. The difference be-tween WordSLOR and WordNCE is bigger than
*Significantly worse than best (bold) result with p < 0.05; one-tailed; Fisher-Z-transformation for Pearson, two sample t-test for MSE.
that between WPSLOR and WPNCE. This might be due to accounting for differences in frequencies being more important for words than for Word-Pieces. Both WordPPL and WPPPL clearly un-derperform as compared to all other metrics in our experiments.
The traditional word-overlap metrics all per-form similarly. ROUGE-L-mult and LR2-F-mult are best and worst, respectively.
4.6 Analysis I: Fluency Evaluation per Compression System
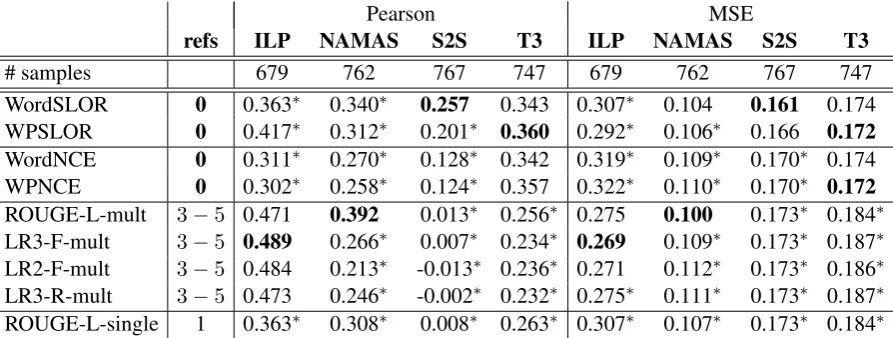
The results per compression system (cf. Table4) look different from the correlations in Table 3: Pearson and MSE are both lower. This is due to the outputs of each given system being of compa-rable quality. Therefore, the datapoints are sim-ilar and, thus, easier to fit for the linear function used for MSE. Pearson, in contrast, is lower due to its invariance to linear transformations of both variables. Note that this effect is smallest for ILP, which has uniformly distributed targets (Var(Y) = 0.35vs. Var(Y) = 0.17for SEQ2SEQ).
Comparing the metrics, the two SLOR ap-proaches perform best for SEQ2SEQ and T3. In particular, they outperform the best word-overlap metric baseline by 0.244 and0.097Pearson cor-relation as well as0.012and0.012MSE, respec-tively. Since T3 is an abstractive system, we can conclude that WordSLOR and WPSLOR are ap-plicable even for systems that are not limited to make use of a fixed repertoire of words.
For ILP and NAMAS, word-overlap metrics obtain best results. The differences in perfor-mance, however, are with a maximum difference of0.072for Pearson and ILP much smaller than for SEQ2SEQ. Thus, while the differences are sig-nificant, word-overlap metrics do not outperform our SLOR approaches by a wide margin. Recall, additionally, that word-overlap metrics rely on ref-erences being available, while our proposed ap-proaches do not require this.
4.7 Analysis II: Fluency Evaluation per Domain
Pearson MSE
refs ILP NAMAS S2S T3 ILP NAMAS S2S T3
# samples 679 762 767 747 679 762 767 747
[image:6.595.76.523.62.231.2]WordSLOR 0 0.363∗ 0.340∗ 0.257 0.343 0.307∗ 0.104 0.161 0.174 WPSLOR 0 0.417∗ 0.312∗ 0.201∗ 0.360 0.292∗ 0.106∗ 0.166 0.172 WordNCE 0 0.311∗ 0.270∗ 0.128∗ 0.342 0.319∗ 0.109∗ 0.170∗ 0.174 WPNCE 0 0.302∗ 0.258∗ 0.124∗ 0.357 0.322∗ 0.110∗ 0.170∗ 0.172 ROUGE-L-mult 3−5 0.471 0.392 0.013∗ 0.256∗ 0.275 0.100 0.173∗ 0.184∗ LR3-F-mult 3−5 0.489 0.266∗ 0.007∗ 0.234∗ 0.269 0.109∗ 0.173∗ 0.187∗ LR2-F-mult 3−5 0.484 0.213∗ -0.013∗ 0.236∗ 0.271 0.112∗ 0.173∗ 0.186∗ LR3-R-mult 3−5 0.473 0.246∗ -0.002∗ 0.232∗ 0.275∗ 0.111∗ 0.173∗ 0.187∗ ROUGE-L-single 1 0.363∗ 0.308∗ 0.008∗ 0.263∗ 0.307∗ 0.107∗ 0.173∗ 0.184∗
Table 4: Pearson correlation (higher is better) and MSE (lower is better), reported by compression system; best results in bold;refs=number of references used to compute the metric.
Next, we focus on an important question: How much does the performance of our SLOR-based metrics depend on the domain, given that the re-spective LMs are trained on Gigaword, which con-sists of news data?
Comparing the evaluation performance for indi-vidual metrics, we observe that, except forletters, WordSLOR and WPSLOR perform best across all domains: they outperform the best word-overlap metric by at least 0.019and at most0.051 Pear-son correlation, and at least 0.004 and at most 0.014MSE. The biggest difference in correlation is achieved for thejournaldomain. Thus, clearly even LMs which have been trained on out-of-domain data obtain competitive performance for fluency evaluation. However, a domain-specific LM might additionally improve the metrics’ cor-relation with human judgments. We leave a more detailed analysis of the importance of the training data’s domain for future work.
5 Incorporation of Given References
ROUGE was shown to correlate well with ratings of a generated text’s content or meaning at the sentence level (Toutanova et al., 2016). We fur-ther expect content and fluency ratings to be cor-related. In fact, sometimes it is difficult to distin-guish which one is problematic: to illustrate this, we show some extreme examples—compressions which got the highest fluency rating and the lowest possible content rating by at least one rater, but the lowest fluency score and the highest content score by another—in Table6. We, thus, hypothesize that ROUGE should contain information about fluency which is complementary to SLOR, and want to
make use of references for fluency evaluation, if available. In this section, we experiment with two
reference-based metrics – one trainable one, and one that can be used without fluency annotations, i.e., in the same settings as pure word-overlap met-rics.
5.1 Experimental Setup
First, we assume a setting in which we have the following available: (i) system outputs whose flu-ency is to be evaluated, (ii) reference generations for evaluating system outputs, (iii) a small set of system outputs with references, which has been annotated for fluency by human raters, and (iv) a large unlabeled corpus for training a LM. Note that available fluency annotations are often uncommon in real-world scenarios; the reason we use them is that they allow for a proof of concept. In this set-ting, we train scikit’s (Pedregosa et al.,2011) sup-port vector regression model (SVR) with the de-fault parameters on predicting fluency, given WP-SLOR and ROUGE-L-mult. We use 500 of our total 2955examples for each of training and de-velopment, and the remaining1955for testing.
reference-Pearson MSE
refs letters journal news non-fi letters journal news non-fi
# samples 640 999 344 972 640 999 344 972
WordSLOR 0 0.452 0.453 0.403 0.484 0.258 0.250 0.234 0.278
WPSLOR 0 0.435∗ 0.415∗ 0.389 0.483 0.263 0.260 0.237 0.278
[image:7.595.80.523.60.232.2]WordNCE 0 0.395∗ 0.412∗ 0.342∗ 0.425∗ 0.273∗ 0.261∗ 0.247 0.297∗ WPNCE 0 0.424∗ 0.398∗ 0.363 0.460 0.266∗ 0.265∗ 0.243 0.286 ROUGE-L-mult 3−5 0.487 0.382∗ 0.384 0.451∗ 0.247 0.269∗ 0.238 0.289 LR3-F-mult 3−5 0.404∗ 0.402∗ 0.278∗ 0.439∗ 0.271∗ 0.264∗ 0.258∗ 0.293 LR2-F-mult 3−5 0.390∗ 0.363∗ 0.292∗ 0.395∗ 0.275∗ 0.273∗ 0.256∗ 0.306∗ LR3-R-mult 3−5 0.420∗ 0.395∗ 0.272∗ 0.453 0.267∗ 0.266∗ 0.259∗ 0.288 ROUGE-L-single 1 0.453 0.347∗ 0.335∗ 0.450∗ 0.258∗ 0.277∗ 0.248 0.289
Table 5: Pearson correlation (higher is better) and MSE (lower is better), reported by domain of the original sentence or paragraph; best results in bold;refs=number of references used to compute the metric.
model generated compression
ILP Objectives designed to lead incarcerated youth to an understanding of grief and loss related influences on their behavior.
ILP In Forster’s A Passage to India is created. SEQ2SEQ Jogged my thoughts back to Muscat Ramble.
[image:7.595.71.291.421.507.2]SEQ2SEQ Between Sagres and Lagos, pleasant beach with fishing boats, and a market. T3 Your support of the Annual Fund maintaining the core values in GSAS the ethics.
Table 6: Sentences for which raters were unsure if they were perceived as problematic due to fluency or content issues, together with the model which generated them.
metric refs train? Pearson MSE
1 SVR: 3−5 yes 0.594 0.217
ROUGE+WPSLOR
2 ROUGE-LM 3−5 no 0.496 0.252
3 ROUGE-L-mult 3−5 no 0.430 0.273
4 WPSLOR 0 no 0.439 0.270
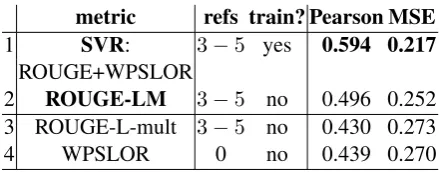
Table 7: Combinations; all differences except for 3 and 4 are statistically significant;refs=number of references used to compute the metric; ROUGE=ROUGE-L-mult; best results in bold.
based metric ROUGE-LM. In order to make this second experiment comparable to the SVR-based one, we use the same1955test examples.
5.2 Results and Discussion
Results are shown in Table 7. First, we can see that using SVR (line 1) to combine ROUGE-L-mult and WPSLOR outperforms both individual scores (lines 3-4) by a large margin. This serves as a proof of concept: the information contained in the two approaches is indeed complementary.
Next, we consider the setting where only refer-ences and no annotated examples are available. In
contrast to SVR (line 1), ROUGE-LM (line 2) has only the same requirements as conventional word-overlap metrics (besides a large corpus for train-ing the LM, which is easy to obtain for most lan-guages). Thus, it can be used in the same settings as other word-overlap metrics. Since ROUGE-LM—an uninformed combination—performs sig-nificantly better than both ROUGE-L-mult and WPSLOR on their own, it should be the metric of choice for evaluating fluency with given refer-ences.
6 Related Work
6.1 Fluency Evaluation
Fluency evaluation is related to grammatical er-ror detection (Atwell,1987;Wagner et al.,2007; Schmaltz et al., 2016; Liu and Liu, 2017) and grammatical error correction (Islam and Inkpen, 2011;Ng et al.,2013,2014;Bryant and Ng,2015; Yuan and Briscoe,2016). However, it differs from those in several aspects; most importantly, it is concerned with the degree to which errors matter to humans.
has been rare. Heilman et al. (2014) predicted the fluency (which they called grammaticality) of sentences written by English language learn-ers. In contrast to ours, their approach is super-vised. Stent et al.(2005) andCahill(2009) found only low correlation between automatic metrics and fluency ratings for system-generated English paraphrases and the output of a German sur-face realiser, respectively. Explicit fluency eval-uation of NLG, including compression and the related task of summarization, has mostly been performed manually. Vadlapudi and Katragadda (2010) used LMs for the evaluation of summariza-tion fluency, but their models were based on part-of-speech tags, which we do not require, and they were non-neural. Further, they evaluated longer texts, not single sentences like we do. Toutanova et al. (2016) compared 80 word-overlap metrics for evaluating the content and fluency of compres-sions, finding only low correlation with the latter. However, they did not propose an alternative eval-uation. We aim at closing this gap.
6.2 Compression Evaluation
Automatic compression evaluation has mostly had a strong focus on content. Hence, word-overlap metrics like ROUGE (Lin and Och, 2004) have been widely used for compression evaluation. However, they have certain shortcomings, e.g., they correlate best for extractive compression, while we, in contrast, are interested in an approach which generalizes to abstractive systems. Alter-natives include success rate (Jing, 2000), simple accuracy (Bangalore et al.,2000), which is based on the edit distance between the generation and the reference, or word accuracy (Hori and Furui, 2004), the equivalent for multiple references.
6.3 Criticism of Common Metrics for NLG
In the sense that we promote an explicit evaluation of fluency, our work is in line with previous criti-cism of evaluating NLG tasks with a single score produced by word-overlap metrics.
The need for better evaluation for machine translation (MT) was expressed, e.g., by Callison-Burch et al.(2006), who doubted the meaningful-ness of BLEU, and claimed that a higher BLEU score was neither a necessary precondition nor a proof of improved translation quality. Similarly, Song et al.(2013) discussed BLEU being unreli-able at the sentence or sub-sentence level (in con-trast to the system-level), or for only one single
reference. This was supported by Isabelle et al. (2017), who proposed a so-called challenge set ap-proach as an alternative.Graham et al.(2016) per-formed a large-scale evaluation of human-targeted metrics for machine translation, which can be seen as a compromise between human evaluation and fully automatic metrics. They also found fully au-tomatic metrics to correlate only weakly or moder-ately with human judgments. Bojar et al.(2016a) further confirmed that automatic MT evaluation methods do not perform well with a single refer-ence. The need of better metrics for MT has been addressed since 2008 in the WMT metrics shared task (Bojar et al.,2016b,2017).
For unsupervised dialogue generation,Liu et al. (2016) obtained close to no correlation with hu-man judgements for BLEU, ROUGE and ME-TEOR. They contributed this in a large part to the unrestrictedness of dialogue answers, which makes it hard to match given references. They em-phasized that the community should move away from these metrics for dialogue generation tasks, and develop metrics that correlate more strongly with human judgments. Elliott and Keller(2014) reported the same for BLEU and image caption generation.Duˇsek et al.(2017) suggested an RNN to evaluate NLG at the utterance level, given only the input meaning representation.
7 Future Work
The work presented in this paper brings up multi-ple interesting next steps for future research.
First, in Subsection4.7, we investigated the per-formances of WordSLOR and WPSLOR in de-pendence of the domain of the considered text. We concluded that an application was possible even for unrelated domains. However, we did not experiment with alternative LMs, which leaves the following questions unresolved: (i) Would training LMs on specific domains improve Word-SLOR’s and WPWord-SLOR’s correlation with human fluency judgments, i.e., to what degree are the properties of the training data important? (ii) How does the size of the training corpus influence per-formance? Ultimatly, this research could lead to answering the following question: Is it better to train a LM on a small, in-domain corpus or on a large corpus from another domain?
eval-uation ofevaluation metricsis hard, an important topic for future research would be the investigation of better ways to do so, or to study under which conditions a metric’s performance can be assessed best.
Last but not least, a straight-forward continua-tion of our research would encompass the investi-gation of SLOR as a fluency metric for other NLG tasks or languages. While the results for com-pression strongly suggest a general applicability to a wider range of NLP tasks, this has yet to be confirmed empirically. As far as other languages are concerned, the question what influence a given language’s grammar has would be an interesting research topic.
8 Conclusion
We empirically confirmed the effectiveness of SLOR, a LM score which accounts for the ef-fects of sentence length and individual unigram probabilities, as a metric for fluency evaluation of the NLG task of automatic compression at the sentence level. We further introduced WP-SLOR, an adaptation of SLOR to WordPieces, which reduced both model size and training time at a similar evaluation performance. Our exper-iments showed that our proposed referenceless metrics correlate significantly better with fluency ratings for the outputs of compression systems than traditional word-overlap metrics on a bench-mark dataset. Additionally, they can be applied even in settings where no references are available, or would be costly to obtain. Finally, for given references, we proposed the reference-based met-ric ROUGE-LM, which consists of a combination of WPSLOR and ROUGE. Thus, we were able to obtain an even more accurate fluency evaluation.
Acknowledgments
We would like to thank Sebastian Ebert and Samuel Bowman for their detailed and helpful feedback.
References
Eric Steven Atwell. 1987. How to detect grammatical errors in a text without parsing it. InEACL.
Srinivas Bangalore, Owen Rambow, and Steve Whit-taker. 2000. Evaluation metrics for generation. In
INLP.
Ondrej Bojar, Christian Federmann, Barry Haddow, Philipp Koehn, Matt Post, and Lucia Specia. 2016a. Ten years of WMT evaluation campaigns: Lessons learnt. In Translation Evaluation: From Frag-mented Tools and Data Sets to an Integrated Ecosys-tem.
Ondˇrej Bojar, Yvette Graham, and Amir Kamran. 2017. Results of the WMT17 metrics shared task. InWMT.
Ondˇrej Bojar, Yvette Graham, Amir Kamran, and Miloˇs Stanojevi´c. 2016b. Results of the WMT16 metrics shared task. InWMT.
Christopher Bryant and Hwee Tou Ng. 2015. How far are we from fully automatic high quality grammati-cal error correction? InACL-IJCNLP.
Aoife Cahill. 2009. Correlating human and automatic evaluation of a german surface realiser. In ACL-IJCNLP.
Chris Callison-Burch, Miles Osborne, and Philipp Koehn. 2006. Re-evaluating the role of BLEU in machine translation research. InEACL.
Noam Chomsky. 1957.Syntactic structures. Walter de Gruyter.
Noam Chomsky. 1964. Aspects of the Theory of Syn-tax. MIT Press.
Jacob Cohen. 1968. Weighted kappa: Nominal scale agreement provision for scaled disagreement or par-tial credit.Psychological bulletin, 70(4):213.
Ondˇrej Duˇsek, Jekaterina Novikova, and Verena Rieser. 2017. Referenceless quality estimation for natural language generation. arXiv:1708.01759.
Desmond Elliott and Frank Keller. 2014. Comparing automatic evaluation measures for image descrip-tion. InACL.
Yvette Graham, Timothy Baldwin, Meghan Dowling, Maria Eskevich, Teresa Lynn, and Lamia Tounsi. 2016. Is all that glitters in machine translation qual-ity estimation really gold? InCOLING.
Michael Heilman, Aoife Cahill, Nitin Madnani, Melissa Lopez, Matthew Mulholland, and Joel Tetreault. 2014. Predicting grammaticality on an or-dinal scale. InACL.
Sepp Hochreiter and J¨urgen Schmidhuber. 1997. Long short-term memory. Neural computation, 9(8):1735–1780.
Chiori Hori and Sadaoki Furui. 2004. Speech summa-rization: An approach through word extraction and a method for evaluation. IEICE Transactions on In-formation and Systems, 87(1):15–25.
Aminul Islam and Diana Inkpen. 2011. Correcting dif-ferent types of errors in texts. InCAIAC.
Hongyan Jing. 2000. Sentence reduction for automatic text summarization. InANLP.
Diederik Kingma and Jimmy Ba. 2014. Adam: A method for stochastic optimization.
arXiv:1412.6980.
Kevin Knight and Daniel Marcu. 2000. Statistics-based summarization – step one: Sentence compres-sion. InAAAI.
Jey Han Lau, Alexander Clark, and Shalom Lappin. 2017. Grammaticality, acceptability, and probabil-ity: A probabilistic view of linguistic knowledge.
Cognitive Science, 41(5):1202–1241.
Chin-Yew Lin and Franz Josef Och. 2004. Auto-matic evaluation of machine translation quality us-ing longest common subsequence and skip-bigram statistics. InACL.
Chia-Wei Liu, Ryan Lowe, Iulian Serban, Mike Nose-worthy, Laurent Charlin, and Joelle Pineau. 2016. How NOT to evaluate your dialogue system: An em-pirical study of unsupervised evaluation metrics for dialogue response generation. InEMNLP.
Zhuo-Ran Liu and Yang Liu. 2017. Exploiting un-labeled data for neural grammatical error detec-tion. Journal of Computer Science and Technology, 32(4):758–767.
Christopher D Manning. 2003. Probabilistic syntax.
Probabilistic linguistics.
Marianna J Martindale and Marine Carpuat. 2018. Flu-ency over adequacy: A pilot study in measuring user trust in imperfect MT. arXiv:1802.06041.
Ryan McDonald. 2006. Discriminative sentence com-pression with soft syntactic evidence. InEACL.
Frederick J Newmeyer. 1983.Grammatical theory: Its limits and its possibilities. University of Chicago Press.
Hwee Tou Ng, Siew Mei Wu, Ted Briscoe, Christian Hadiwinoto, Raymond Hendy Susanto, and Christo-pher Bryant. 2014. The CoNLL-2014 shared task on grammatical error correction. InCoNLL.
Hwee Tou Ng, Siew Mei Wu, Yuanbin Wu, Christian Hadiwinoto, and Joel Tetreault. 2013. The CoNLL-2013 shared task on grammatical error correction. InCoNLL.
Kishore Papineni, Salim Roukos, Todd Ward, and Wei-Jing Zhu. 2002. BLEU: a method for automatic evaluation of machine translation. InACL.
Robert Parker, David Graff, Junbo Kong, Ke Chen, and Kazuaki Maeda. 2011. English Gigaword fifth edi-tion, Linguistic Data Consortium.
Adam Pauls and Dan Klein. 2012. Large-scale syntac-tic language modeling with treelets. InACL.
Ellie Pavlick and Joel Tetreault. 2016. An empiri-cal analysis of formality in online communication.
TACL, 4:61–74.
Fabian Pedregosa, Ga¨el Varoquaux, Alexandre Gram-fort, Vincent Michel, Bertrand Thirion, Olivier Grisel, Mathieu Blondel, Peter Prettenhofer, Ron Weiss, Vincent Dubourg, Jake VanderPlas, Alexan-dre Passos, David Cournapeau, Matthieu Brucher, Matthieu Perrot, and Edouard Duchesnay. 2011. Scikit-learn: Machine learning in Python. Journal of Machine Learning Research, 12:2825–2830.
Allen Schmaltz, Yoon Kim, Alexander M Rush, and Stuart M Shieber. 2016. Sentence-level grammatical error identification as sequence-to-sequence correc-tion. arXiv:1604.04677.
M Schuster and K Nakajima. 2012. Japanese and Ko-rean voice search. InICASSP.
Carson T Sch¨utze. 1996. The empirical base of lin-guistics: Grammaticality judgments and linguistic methodology. University of Chicago Press.
Xingyi Song, Trevor Cohn, and Lucia Specia. 2013. BLEU deconstructed: Designing a better MT eval-uation metric. International Journal of Computa-tional Linguistics and Applications, 4(2):29–44.
Jon Sprouse. 2007. Continuous acceptability, categor-ical grammatcategor-icality, and experimental syntax. Bi-olinguistics, 1:123–134.
Amanda Stent, Matthew Marge, and Mohit Singhai. 2005. Evaluating evaluation methods for generation in the presence of variation. InCICLing.
Martin Sundermeyer, Ralf Schl¨uter, and Hermann Ney. 2012. Lstm neural networks for language modeling. InISCA.
Kristina Toutanova, Chris Brockett, Ke M Tran, and Saleema Amershi. 2016. A dataset and evaluation metrics for abstractive compression of sentences and short paragraphs. InEMNLP.
Ravikiran Vadlapudi and Rahul Katragadda. 2010. On automated evaluation of readability of summaries: Capturing grammaticality, focus, structure and co-herence. InNAACL-HLT SRW.
Joachim Wagner, Jennifer Foster, and Josef van Gen-abith. 2007. A comparative evaluation of deep and shallow approaches to the automatic detection of common grammatical errors. InEMNLP-CoNLL.
Zheng Yuan and Ted Briscoe. 2016. Grammatical er-ror correction using neural machine translation. In