Original Article
Effects of BDNF-ERK-CREB signaling pathways on
cognitive function and neural plasticity in
a rat model of depression
Wei Zhang1,2,3, Xiaojin Liu4, Wanbo Xu5, Xiaodan Wei6, Jie Zhang6, Bin Wang2
1Shandong Medical Imaging Research Institute, Shandong University, Jinan, Shandong Province, China; 2Binzhou Medical University, Yantai, Shandong Province, China; 3Dezhou University, Dezhou, Shandong Province, China; Departments of 4Pharmacy, 5Radiology, Dezhou People’s Hospital, Dezhou, Shandong Province, China; 6School of Pharmacy, Binzhou Medical University, Yantai, Shandong Province, China
Received February 16, 2019; Accepted March 12, 2019; Epub June 15, 2019; Published June 30, 2019
Abstract: Objective: The aim of the current study was to investigate the effects of BDNF-ERK-CREB signaling path-ways on cognitive function and neural plasticity in a rat model of depression. Methods: A total of 60 clean-grade male Wistar rats were obtained, with 10 randomly selected as the normal group. The remaining rats were used to establish a rat model of depression. They were divided into 4 groups, including the model group (without any treatment), negative control (NC) group (intraperitoneally injected with saline), PMA group (intraperitoneally inject-ed with Phorbol 12-myristate 13-acetate (PMA), which is an activator of BDNF-ERK-CREB signaling pathway), and U0126 group (intraperitoneally injected with U0126, which is an inhibitor of BDNF-ERK-CREB signaling pathway). Behavioral indicators of depression, including body weight changes, sugar water preferences, and immobility times in the tail suspension test were measured. H&E staining was used to detect pathological changes of hippocampal neurons. Moreover, qRT-PCR and Western blotting were performed to detect expression levels of extracellular regu-lated protein kinases 1/2 (ERK1/2), phosphoryregu-lated ERK1/2 (p-ERK1/2), cAMP-response element binding protein (CREB), phosphorylated CREB (p-CREB), brain-derived neurotrophic factor (BDNF), glutamate receptor 1 (GluR1), glial fibrillary acidic protein (GFAP), and soluble protein-100β (S100β). Expression levels of inflammatory factors (5-hydroxytryptamine (5-HT), BDNF, interleukin-6 (IL-6), tumor necrosis factor α (TNF-α), and interferon-γ (IFN-γ)) were measured by ELISA. Results: After 28 days of continuous stimulation, body weights and sugar water prefer-ences of depression model rats decreased more significantly, compared with normal rats. Immobility times in the tail suspension tests increased significantly (all P<0.05), indicating that modeling was successful. Compared with the normal group, body weights and sugar water consumption and preferences, as well as mRNA and protein ex-pression levles of ERK1/2, p-ERK1/2, CREB, p-CREB, GluR1, GFAP, 5-HT, and BDNF, were reduced in other groups (all P<0.05). However, pure water consumption, immobility times in the tail suspension test, and mRNA and protein expression levels of S100β, IL-6, TNF-α, and IFN-γ were elevated in the other groups (all P<0.05). Compared with the model group, body weights, sugar water consumption and preferences in the PMA group, as well as mRNA and protein expression of ERK1/2, p-ERK1/2, CREB, p-CREB, GluR1, GFAP, 5-HT, and BDNF, were significantly increased (all P<0.05). In contrast, pure water consumption, immobility times in the tail suspension test, and mRNA and pro-tein expression levels of S100β, IL-6, TNF-α, and IFN-γ were decreased in the PMA group (all P<0.05). Compared with the model group, results in the U0126 group were opposite to those in the PMA group (all P<0.05). There were no significant differences in indicators between the model group and NC group (all P>0.05). Conclusion: Activation of BDNF-ERK-CREB signaling pathways inhibited the release of inflammatory factors in a rat model of depression. Furthermore, it enhanced neural plasticity, improved cognitive function, and promoted recovery from depression. Contrarily, inhibition of BDNF-ERK-CREB signaling pathways aggravated depression in a rat model.
Keywords: BDNF-ERK-CREB signaling pathway, depression rat, cognitive impairment, neural plasticity
Introduction
Depression is a mental disorder, characterized by high prevalence, recurrence rates, disability
nearly 20% of people around the world suffer from depression. By 2030, depression is ex- pected to be the main cause of the worldwide burden of disease [3]. At present, there are many problems with using antidepressant
med-ications, including low efficiency, slow onset of
action, and considerable side effects. The- refore, development of new antidepressant treatments is a top priority.
In addition to persistently low moods, cognitive impairment is a common symptom of depres-sion. Patients with cognitive impairment may
manifest impaired thinking ability, difficulties in
concentration, and memory loss [4]. At present, cognitive impairment has become one of the criteria for diagnosis of depression, according to American Diagnostic and Statistical Manual of Mental Disorders (5th Edition) (DSM-5) and
International Classification of Diseases (10th
Edition) (ICD-10) [5]. Previous studies have found that causes of cognitive impairment in depression may be related to structural chang-es in the nervous system and neurotransmit-ters, as well as other factors [6, 7].
In recent years, studies have found that struc-tural changes and functional impairment of some brain regions of the limbic system have also occurred in animal models of depression. The area closely related to depression is the hippocampus. Astrocytes, fundamental neural cells in the hippocampus, play an important role in hippocampal neuronal regulation, nerve regeneration, and synaptic remodeling. As- trocytes are characterized by cell markers,
such as glial fibrillary acidic protein (GFAP) and central nervous-specific protein (S100β).
An-tidepressants can activate intracellular signal-ing pathways that promote neural plasticity and reverse pathological changes caused by de- pression. This suggests that roles of neural plasticity mechanisms in the pathogenesis and treatment of depression. Brain derived trophic factor (BDNF), a member of the neuro-trophic factor family, can induce neuronal structural changes by stimulating the hippo-campus, amygdala, and prefrontal cortex through related pathways [8, 9]. BDNF-ERK-CREB signaling pathways play an important role in neural differentiation and development of synaptic function, while maintaining normal physiological functioning of central and periph-eral nervous systems. It also contributes to learning, memory formation, and maintenance
[10, 11]. At the same time, BDNF is involved in the pathogenesis of various mental disorders, such as schizophrenia. However, the roles of BDNF-ERK-CREB signaling pathways in the pathogenesis of depression are not fully under-stood, requiring further investigation.
The current study explored treatment mecha-nisms of depression based on cognitive impair-ment and neural plasticity through BDNF-ERK-CREB signaling pathways, aiming to enrich treatment methods for depression.
Materials and methods
Animal modeling
A total of 60 clean-grade male Wistar rats (Shanghai Slack Laboratory Animals Co., Ltd., China), weighing 205.25±6.27 g at 7-8 weeks old, were obtained. All rats were individually housed in mesh cages at a temperature of 25°C under 12-hour light (06:00-18:00) and 12-hour dark (18:00-06:00) cycles. Ten of them were randomly selected as the normal group. The rest were used for depression mod-eling. The modeling method was based on the study by Chen [12]. Rats experienced continu-ous stimulation for 28 days, including food and water deprivation (24 hours), wet bedding (24 hours), cage tilting (45°C, 24 hours), light and dark reversal (24 hours), and heat stress (45°C, 5 minutes), followed by ice water baths (4°C, 5 minutes), tail pinching (1 minute), and horizon-tally cage shaking (80 times/min, 20 minutes). Only one stimulation method was used each day and the same stimulation method did not
appear for 2 consecutive days. To avoid influ -encing the other animals, the rats were individ-ually brought to the procedure room to receive the stimuli, except for food and water depriva-tion. All rats were returned to the animal breed-ing room at the same time upon completion of stimulation. Rats in the normal group were given free access to drinking water and diet without any stimulation. This study was app- roved by the Laboratory Animal Ethics Com- mittee of School of Pharmacy, Binzhou Medical University, complying with the principles of ani-mal care and use.
Animal grouping
immobility times in the tail suspension test were measured. Compared with normal rats, body weights and the sugar water intake of the
model rats decreased significantly. Immobility times in the tail suspension test significantly
increased, indicating that modeling was suc-cessful. Successfully modeled depression rats were divided into 4 groups, including the model group (without any treatment), NC group (intra-peritoneally injected with 10 mg/kg saline (Qingdao Nisuvi Sehuu Biotechnology Co., Ltd., China)), PMA group (Intraperitoneally injected with 10 mg/kg Phorbol 12-myristate 13-ace-tate (PMA) (Beijing Biolab Technology Co., Ltd., China), which is an activator of BDNF-ERK-CREB signaling pathway), and U0126 group (intraperitoneal injection of 10 mg/kg U0126 (Shanghai GeGene Biotechnology Co., Ltd., China), which is a BDNF-ERK-CREB signaling pathway inhibitor). The next day, after success-ful modeling, the rats received intraperitoneal injections according to the protocol. They were received once a day for 3 consecutive days. On the 37th day of the experiment, all rats
under-went behavioral tests [13]. A total of 5 mL of tail blood was collected before they were eutha-nized by cervical dislocation under anesthesia. Tissues were harvested for subsequent experi- ments.
Body weight gain
Body weights of the rats were measured 1 day before the experiment and on the 37th day of
the experiment. Weight gain = (body weight at 37th day-body weight at 1 day before the ex-
periment).
Sugar water intake testing
Sugar water intake testing was conducted based on the study by Duan et al. [14]. On the 37th day, the animals were trained to adapt to
sugary drinking water by placing 2 bottles of 1% sugar water in each cage. After adaptation, each group of rats was subjected to sugar water intake testing, after food and water depri-vation for 24 hours. The rats were given one bottle of 1% sugar water and one bottle of pure water at the same time. After 24 hours, the two bottles were retrieved and weighed. Sugar water consumption, pure water consumption, and sugar water preferences were calculated for each animal. Sugar water preference (%) =
sugar water consumption/total liquid consump-tion * 100%.
Tail suspension testing
On the 40th day after completion of sugar water
intake testing, the rats were suspended 35 cm from the ground by taping 1.5 cm-2 cm tail to the suspension rack with their heads pointing downwards. They were left dangling for 6 min-utes. Times from the rats ceasing efforts to get to an upright position to the end of the test (immobility times) were measured.
Tissue harvesting
After completion of all behavioral tests, 5 mL of tail vein blood was taken and stored at -80°C. The rats were anesthetized with pentobarbital sodium (Hubei Hongyun Long Biological Te-
chnology Co., Ltd., China) and sacrificed by cer -vical dislocation. The brain was removed. The hippocampus was isolated. One part of the hip-pocampus was frozen at -80°C. the other part
was used for paraffin sections, which were 4 μm thick.
H&E staining
Paraffin sections were routinely dewaxed and
stained with hematoxylin (Beijing Leagene Biotechnology Co., Ltd., China) for 10 minutes at room temperature. Sections were rinsed with tap water for 60 seconds, then dipped in 1% hydrochloric alcohol for 1 minute. Sections were rinsed with tap water again for 1 minute and stained with eosin (Shanghai Bogoo Biotechnology Co., Ltd., China) at room temper-ature for 5 minutes. Sections were washed with distilled water, then dehydrated using a gradi-ent of ethanol for 1 minute. Sections were
deparaffinized in xylene twice, for 1 minute
each time, then sealed with Permount. An opti-cal microscope (Boshida Optiopti-cal Instrument Co., Ltd., China) was used to observe and pho-tograph morphological changes.
Quantitative real time PCR (qRT-PCR)
Table 1. qRT-PCR primer sequences
Gene Primer sequence
ERK1 F: 5’-CTGGCTTTCTGACCGAGTATGTG-3’ R: 5’-CAATTTAGGTCCTCTTGGGATG-3’ ERK2 F: 5’-GACATGGAGCTGGACGACTTAC-3’
R: 5’-GGGACACCGACATCTGAACG-3’ CREB F: 5’-GCAGTGACTGAGGAGCTTGT-3’
R: 5’-ACTCTGCTGGTTGTCTGCTC-3’ BDNF F: 5’-GTGACAGTATTAGCGAGTG-3’
R: 5’-TATCCTTATGAACCGCCAGCC-3’ GluR1 F: 5’-CCATCAATGAAGCCA TACG-3’
R: 5’-TCTGCTCCAGTTACAATCC-3’ GFAP F: 5’-CAGAGAACAACCTGGCTGCG-3’
R: 5’-AGCGTCTGTCGAGTCTGCAA-3’
S100β F: 5’-TTTTAAGCTTCACCATGTGTGAGCTGGAGAAGGC-3’ R: 5’-TTTTCTCGAGTTGCATGACCGTCTCTGTTACAG-3’ GAPDH F: 5’-GGTGTGAACCACGAGAAATATGAC-3’
R: 5’-TCATGAGCCCTTCCACAATG-3’
Note: ERK1: Extracellular regulated protein kinase 1; ERK2: Extracel-lular regulated protein kinase 2; CREB: cAMP-response element binding protein; BDNF: Brain-derived neurotrophic factor; GluR1:
Glutamate receptor 1; GFAP: Glial fibrillary acidic protein; S100β: Soluble protein-100β; GAPDH: Glyceraldehyde-3-phosphate dehydro -genase.
S100β, and GAPDH primers were designed and
synthesized by Takara Bio USA, Inc. (Table 1). RNA was reverse transcribed into cDNA accord-ing to manufacturer instructions of the Reverse Transcription Kit (Fermentas, USA). The master mix was subjected to qRT-PCR in accordance with instructions of SYBR® Premix Ex TaqTM II
Kit (Xingzhi Biotechnology Co., Ltd., China). The
total reaction volume was 50μL: SYBR® Premix
Ex TaqTM II (2×) 25 μL, PCR upstream primer 2 μL, PCR downstream primer 2 μL, ROX Re-ference Dye (50×) 1 μL, DNA template 4 μL,
and ddH2O 16 μL. Moreover, qRT-PCR was per -formed using the ABI PRISM® 7300 system
(Shanghai Kunke Instrument Co., Ltd., China). Reaction conditions were pre-denaturation at 95°C for 10 minutes, denaturation at 95°C for 15 seconds, and annealing at 60°C for 30 sec-onds. After 32 cycles, extension at 72°C was applied for 1 minute. GAPDH was used as an internal reference. Furthermore, 2-ΔΔCt indicates the ratio of gene expression of each group to the normal group. The formula is as follows:
ΔΔCT = ΔCtexperimental group - ΔCtcontrol group. Western blotting
Hippocampus tissues of each animal were freshly frozen in liquid nitrogen and ground to
respectively: p-ERK1/2 (1:1,000, Abcam, UK), p-CREB (1:5,000, Abcam, UK), BNDF (1:100, Abcam, UK), GluR1 (1:2,000, Abcam, UK), GFAP
(1:10,000, Abcam, UK), S100β (1:1,000,
Abcam, UK), and GAPDH (1:1,000, Abcam, UK). Membranes were incubated at 4°C overnight. They were rinsed with TBST 3 times for 10 min-utes each. HRP-labeled goat anti-mouse I gG secondary antibody (1:2,000, Abcam, UK) was added and the membranes were incubated for 2 hours at room temperature. They were rinsed with TBST 3 times, for 10 minutes each time, before immersion in the DAB color develop-ment solution. A gel imaging system (Bio-Rad, USA) calculated the ratio of the gray value of the protein of interest to the internal reference, calculated as the relative expression level of the protein.
5-HT, BDNF, IL-6, TNF-α, and IFN-γ expression
levels measured by ELISA
Determination of 5-HT and BDNF expression levels: Hippocampal tissues of each animal mixed with 2 mL PBS were homogenized in a tissue homogenizer. The tissue homogenate was centrifuged at 4°C and 3,000 rpm for 20 minutes. The supernatant was transferred into
fine powder. Next, 1 mL of tissue lysis buf -fer (Beijing Solarbio Technology Co., Ltd., China) was added and the mixture was homogenized on ice. Cell lysis buffer (Beijing Solarbio Technology Co., Ltd., China) was added and the mixture was incubated at 4°C for 30 minutes. Samples were centrifuged for 15 minutes at 4°C and 12,000 r/min. The supernatant was collected to determine protein concentra-tions, using the BCA Protein Assay Kit (Pierce, USA). Protein concentrations
were adjusted to 1 μg/μL and loaded to the sample well with a volume of 20 μg
a 1.5 mL centrifuge tube. Expression levels of 5-HT and BDNF in the hippocampus were determined according to manufacturer instruc-tions of the ELISA kit (BD, USA).
Determination of IL-6, TNF-α, and IFN-γ expres -sion levels: Serum of each animal was centri-fuged at 3,000 r/min for 30 minutes. The mea-surement procedure was in accordance with
manufacturer instructions of IL-6, TNF-α, and IFN-γ ELISA kits (Shenzhen Jingmei
Bioen-gineering Co., Ltd., China). After measurement, optical density (OD) values of each well, at a wavelength of 450 nm, were read by means of a microplate reader (BioTek Synergy 2, USA). A standard curve was depicted with the concen-tration of the reference standard as the abscis-sa and OD values as the ordinate.
Statistical analysis
All data were processed using SPSS 21.0 soft-ware. Quantitative data are expressed as mean ± standard deviation (_x ± sd). Comparisons between multiple groups were analyzed by one-way ANOVA, followed by Bonferroni’s
post-hoc test. P<0.05 indicates that differences are statistically significant.
Results
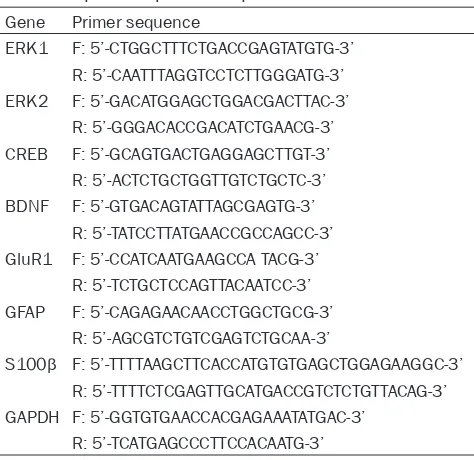
Successful modeling
After 28 days of continuous stimulation, com-pared with the normal group, body weights and sugar water preferences of depression model
rats decreased significantly. Immobility times in the tail suspension test increased signifi
-cantly (all P<0.05), indicating that modeling
was successful. See Figure 1.
Comparison of body weights
Body weight changes of each group are shown in Figure 2. There were no significant differenc -es between groups before the experiment (all
P>0.05). Compared with the normal group,
body weights and weight gain of the other
groups significantly decreased on the 37th day
(all P<0.05). Compared with the model group,
body weights and weight gain of the PMA group
significantly increased on the 37th day (all
P<0.05), while body weights and body weight
gain of the U0126 group on the 37th day signifi
-cantly decreased (all P<0.05). There were no
differences in body weights and body weight gain between the model group and NC group
(all P>0.05). Compared with the PMA group,
body weights and weight gain of the U0126
group decreased significantly on the 37th day
(all P<0.05).
Comparison of sugar water intake
Sugar water intake levels of each group are shown in Figure 3. Compared with the normal group, sugar water intake and preferences
were significantly lower in the other groups. Pure water consumption was significantly in-creased (all P<0.05). Compared with the model
group, sugar water intake and preferences
of the PMA group increased significantly. Consumption of pure water decreased signifi
-cantly (all P<0.05). Contrarily, sugar water
intake and preferences of the U0126 group decreased, while pure water consumption
increased significantly (all P<0.05). There were no significant differences between the model
group and NC group regarding those
parame-ters (all P>0.05). Compared with the PMA
[image:5.612.96.520.72.193.2]group, sugar water intake and preferences in Figure 1. Comparison of body weights, sugar water preferences, and immobility times in the tail suspension test. A: Body weights of normal rats and depression model rats; B: Sugar water preferences of normal rats and depres-sion model rats; C: Immobility times of normal rats and depresdepres-sion model rats in the tail suspendepres-sion test; *P<0.05
Figure 3. Comparison of liquid consumption and sugar water preferences. A: Liquid consumption of each group; B: Sugar water preferences in each group; *P<0.05 compared with the normal group; #P<0.05 compared with the
model group; %P<0.05 compared with the PMA group.
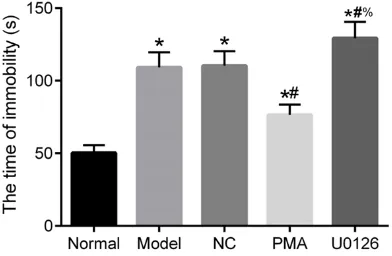
Figure 4. Comparison of immobility times in the tail suspension test. *P<0.05 compared with the normal
[image:6.612.96.524.282.429.2]group; #P<0.05 compared with the model group; %P<0.05 compared with the PMA group.
Figure 2. Body weight changes of each group. A: Body weights of each group at 1 day before the experiment and on the 37th day of the experiment; B: Body weight gain of each group; *P<0.05 compared with the normal group; #P<0.05 compared with the model group; %P<0.05 compared with the PMA group.
the U0126 group decreased, while pure water
consumption significantly increased (all P<
0.05).
Comparison of immobility times in the tail sus-pension test
Immobility times in the tail suspension tests of each group are shown in Figure 4. Compared with the normal group, immobility times of the
other groups significantly increased (all P<
0.05). Compared with the model group, immo-bility times of the PMA group decreased
(P<0.05), while immobility times of the U0126 group significantly increased (P<0.05). There were no significant difference between the model group and NC group (P>0.05). Compared
with the PMA group, immobility times of the
U0126 group significantly increased (P<0.05).
H&E staining of hippocampal neurons
[image:6.612.91.287.493.621.2]hippocampal neurons in the normal group appeared normal. In the model group and NC group, the number of hippocampal neurons decreased and intercellular space enlarged. The morphology appeared abnormal and there were apparent deformed neurons. The U0126 group showed more obvious morphological changes than the model group. However, the PMA group showed mild neuronal morphologi-cal changes and number reduction, compared with the model group.
Related gene mRNA expression measured by
qRT-PCR
Results of qRT-PCR are shown in Figure 6. Compared with the normal group, mRNA expression of ERK1/2, CREB, BDNF, GluR1,
and GFAP in the other groups significantly decreased, while mRNA expression of S100β significantly increased (all P<0.05). Compared
group significantly decreased, while mRNA expression of S100β significantly decreased (all P<0.05).
Related protein expression measured by
Western blotting
Western blotting results are shown in Figure 7. Compared with the normal group, protein expression of p-ERK1/2, p-CREB, BDNF, GluR1, and GFAP decreased in the other groups, while
expression of S100β increased (all P<0.05).
The PMA group showed more expression of p-ERK1/2, p-CREB, BDNF, GluR1, and GFAP,
but less expression of S100β, compared to the model group (all P<0.05). Contrarily, the U0126
group had less expression of p-ERK1/2, p- CREB, BDNF, GluR1, and GFAP but more
expres-sion of S100β, compared with the model group (all P<0.05). There were no differences in
[image:7.612.91.526.74.202.2]expression levels of each protein between the Figure 5. H&E staining of hippocampal neurons.
Figure 6. mRNA expression of hippocampus-related genes. *P<0.05
com-pared with the normal group; #P<0.05 compared with the model group; %P<0.05 compared with the PMA group.
with the model group, mRNA expression of ERK1/2, CREB, BDNF, GluR1, and GFAP of the PMA group increased, while
mRNA expression of S100β significantly decreased (all P<0.05). Compared with the
model group, mRNA expres-sion of ERK1/2, CREB, BDNF, GluR1, and GFAP of the U0126 group decreased, while mRNA
expression of S100β increased (all P<0.05). There were no sig
-nificant differences between
the model group and NC group
(all P>0.05). Compared with
[image:7.612.92.371.249.407.2]model group and NC group (all P>0.05).
Compared with the PMA group, expression of p- ERK1/2, p-CREB, BDNF, GluR1, and GFAP in the U0126 group decreased, but expression of
S100β significantly increased (all P<0.05).
Serum levels of inflammatory indicators mea -sured by ELISA
Results of ELISA are shown in Figure 8. Compared with the normal group, expression of
5-HT and BDNF significantly decreased in the
other groups, while expression levels of IL-6,
pared with the PMA group, expression of 5-HT and BDNF decreased in the U0126 group, but
IL-6, TNF-α, and IFN levels significantly in-creased (all P<0.05).
Discussion
[image:8.612.94.524.73.292.2]According to the World Health Organization (WHO), depression is the most common ease, worldwide, and the leading cause of dis-abilities. About 350 million people, worldwide, suffer from depression [15]. At present, clinical treatment methods available for depression Figure 7. Protein expression of hippocampus-related genes. A: Western blot results of each protein; B: Relative expression of each protein; *P<0.05 compared with the normal group; #P<0.05 compared with the model group; %P<0.05 compared with the PMA group.
Figure 8. Comparison of inflammatory factors. *P<0.05 compared with the
normal group; #P<0.05 compared with the model group; %P<0.05 compared
with the PMA group.
TNF-α, and IFN-γ significantly increased (all P<0.05). The
PMA group showed more ex- pression of 5-HT and BDNF but
less expression of IL-6, TNF-α, and IFN-γ, compared to the model group (all P<0.05).
Contrarily, the U0126 group showed less expression of 5-HT and BDNF but more
expression of IL-6, TNF-α, and IFN-γ, compared with the mo-del group (all P<0.05). There were no significant differences in inflammatory factor levels
between the Model group and
[image:8.612.91.370.358.498.2]Com-are relatively scarce. Various viewpoints and hypotheses on the pathogenesis of depression exist, including genetic predisposition, the cyto-kine theory, the serotonin (5-HT) theory, and psychosocial factors [16, 17]. Researchers have proposed corresponding treatment meth-ods from these aspects. The current study explored mechanisms of BDNF-ERK-CREB sig-naling pathways on cognitive impairment and neural plasticity in depression model rats,
aim-ing to find alternative treatment methods for
depression.
In the current study, compared with the normal group, body weights and sugar water intake and preferences in other depression model groups were reduced. Moreover, mRNA and protein expression levels of ERK1/2 and p-ERK1/2, CREB and p-CREB, BDNF, GluR1,
GFAP, and inflammatory factors, such as 5-HT and BDNF, were significantly reduced. This indi -cates that depression jeopardizes the physio-logical functions of animals. Other studies have
also confirmed that serum BDNF is downregu
-lated in patients with depression and levels of BDNF are correlated with degree of depression. Abnormal expression of BDNF may be involved in the pathophysiological mechanisms of de-
pression [18]. Specifically, under normal cir -cumstances, BDNF is abundant in the brain and higher in serum. When BDNF is reduced, neurotrophic effects are impaired. This may cause depression. Moreover, serum levels of 5-HT in patients with depression are also de- creased, correlating with severity of de- pression.
Furthermore, compared with the model group, mRNA and protein expression levels of ERK1/2,
CREB, BDNF, GluR1, and GFAP were significant -ly increased, while mRNA and protein
expres-sion levels of S100β were significantly
de-creased in the PMA group. Elevated expression of GFAP is a prominent marker of astrocyte acti-vation. Activated astrocytes can synthesize and release a variety of neurotrophic factors, sup-porting neuron and axon growth and playing an
important role in neuron damage repair. S100β
can increase the survival rate of neurons, pro-mote the neurite outgrowth of glial cells, and promote the extension of axons. GluR1 reduces damage to synaptic plasticity and memory
function induced by inflammatory factors
caused by glial cell activation.
Present H&E staining results showed that the number and morphology of hippocampal neu-rons in the normal group appeared normal. In contrast, the number of hippocampal neurons decreased in the model group and NC group, with enlarged intercellular space, abnormal cel-lular structures, and apparently deformed cells.
These changes reflect the alteration of neural
plasticity in the hippocampus of depression model rats. As a part of the limbic system, the hippocampus is currently the most popular brain area in depression research. Its roles in memory, study, and cognitive impairment have been well established. A previous study demon-strated that hippocampal atrophy found in depression patients is associated with cogni-tive impairment [19].
Many studies have shown that BDNF is a cru-cial regulator of neuronal plasticity. It has many physiological functions, such as promotion of the development, growth and differentiation of neurons and prevention of neuronal apoptosis [20, 21]. Zhang found that the loss of BDNF and
its specific receptor TrkB might be the main
pathogenesis of hippocampal neuron atrophy and apoptosis, leading to depression [22]. The role of BDNF is mainly achieved by activating its
Clinically, levels of pro-inflammatory cytokines
in the serum of patients with depression are
often significantly increased, indicating that increased cytokines (including pro-inflammato
-ry cytokines and anti-inflammato-ry cytokines)
can be considered a potential biomarker of depression [25]. Studies have shown that cyto-kine levels in the peripheral circulation are closely related to degrees of anxiety, depres-sion, and cognitive impairment. Moreover,
cyto-kines, such as IL-1β, IL-6, and TNF-α, can act
directly or indirectly on the brain, activating the hypothalamic-pituitary-adrenal (HPA) axis. This affects the release of monoamine neurotrans-mitters and leads to development of depres-sion [26, 27]. In the current study, expresdepres-sion
levels of inflammatory factors IL-6, TNF-α, and IFN-γ were significantly lower in the PMA group,
compared with the model group.
In summary, the current study found that anti-depressant therapy can increase expression levels of key proteins, such as ERK and CREB, in downstream cascade signaling pathways by increasing expression of BDNF. This inhibits the
release of inflammatory cytokines in depres -sion model rats, enhancing neural plasticity and promoting the rehabilitation of depression model rats.
Therefore, medications directly acting on BDNF-ERK-CREB signaling pathways are a new re- search direction for treatment of depression, with great application prospects. However,
results should be further confirmed in clinical
practice, examining possible side effects and other problems. However, with the rapid devel-opment of medicine, application of BDNF-ERK-CREB signaling pathways fort treatment and diagnosis of depression may lead to new
break-throughs, greatly benefitting those suffering
from depression.
Disclosure of conflict of interest
None.
Address correspondence to: Bin Wang, Binzhou Medical University, No.346 Guanhai Road, Laishan District, Yantai 264003, Shandong Province, China. Tel: +86-5356-9130002; E-mail: wangbin2q@163. com
References
[1] Pearlstein T. Depression during pregnancy. Best Pract Res Clin Obstet Gynaecol 2015; 29:
[2] Aalbers S, Fusar-Poli L, Freeman RE, Spreen M, Ket JC, Vink AC, Maratos A, Crawford M, Chen XJ and Gold C. Music therapy for depression. Cochrane Database Syst Rev. 2017; 11: CD004517.
[3] Lo A. Lifestyle factors on depression, effects of. in: pachana na, editors. encyclopedia of geropsychology. Singapore: Springer Singa-pore 2017: p. 1-9.
[4] Bruggink A, Huisman S, Vuijk R, Kraaij V and Garnefski N. Cognitive emotion regulation, anxiety and depression in adults with autism spectrum disorder. Research in Autism Spec-trum Disorders 2016; 22: 34-44.
[5] American Psychiatric Association. Diagnostic and statistical manual of mental disorders (DSM-5®). Edited by American Psychiatric As-sociation. American Psychiatric Pub; 2013. [6] MacQueen GM and Memedovich KA. Cognitive
dysfunction in major depression and bipolar disorder: assessment and treatment options. Psychiatry Clin Neurosci 2017; 71: 18-27. [7] Fossati P. Is major depression a cognitive
dis-order? Rev Neurol (Paris) 2018; 174: 212-215. [8] Sleiman SF, Henry J, Al-Haddad R, El Hayek L,
Abou Haidar E, Stringer T, Ulja D, Karuppa-gounder SS, Holson EB, Ratan RR, Ninan I and Chao MV. Exercise promotes the expression of brain derived neurotrophic factor (BDNF) through the action of the ketone body beta-hy-droxybutyrate. Elife 2016; 2: 5.
[9] Wurzelmann M, Romeika J and Sun D. Thera-peutic potential of brain-derived neurotrophic factor (BDNF) and a small molecular mimics of BDNF for traumatic brain injury. Neural Regen Res 2017; 12: 7-12.
[10] Yi LT, Li J, Liu BB, Luo L, Liu Q and Geng D. BDNF-ERK-CREB signalling mediates the role of miR-132 in the regulation of the effects of oleanolic acid in male mice. J Psychiatry Neu-rosci 2014; 39: 348-359.
[11] Wang C, Li Z, Han H, Luo G, Zhou B, Wang S and Wang J. Impairment of object recognition memory by maternal bisphenol A exposure is associated with inhibition of Akt and ERK/ CREB/BDNF pathway in the male offspring hip-pocampus. Toxicology 2016; 341-343: 56-64. [12] Chen Q, Luo Y, Kuang S, Yang Y, Tian X, Ma J,
Mai S, Xue L and Yang J. Cyclooxygenase-2 sig-nalling pathway in the cortex is involved in the pathophysiological mechanisms in the rat model of depression. Sci Rep 2017; 7: 488. [13] Yamamoto Y, Ueyama T, Ito T. Downregulation
of growth hormone 1 gene in the cerebellum and prefrontal cortex of rats with depressive-like behavior. Physiological Genomics 2015; 47: 170-176.
hippocampus in the rat of depression. Zhong-guo Zhen Jiu 2008; 28: 369-73.
[15] Kessler RC, Barber C, Birnbaum HG, Frank RG, Greenberg PE, Rose RM, Simon GE and Wang P. Depression in the workplace: effects on short-term disability. Health Aff (Millwood) 1999; 18: 163-71.
[16] Kessler RC. The costs of depression. Psychiatr Clin North Am 2012; 35: 1-14.
[17] Assari S. Social determinants of depression: the intersections of race, gender, and socio-economic status. Brain Sci 2017; 7.
[18] Wang Q, Yong L, Qiang Z and Sun SQ. Changes of BDNF expression in hippocampus and se-rum of rats with artificial chronic obstructive pulmonary disease. Acta Physiologica Sinica 2011; 63: 505.
[19] Lee AL, Ogle WO and Sapolsky RM. Stress and depression: possible links to neuron death in the hippocampus. Bipolar Disord 2002; 4: 117-128.
[20] Bjorkholm C and Monteggia LM. BDNF - a key transducer of antidepressant effects. Neuro-pharmacology 2016; 102: 72-79.
[21] Castren E and Kojima M. Brain-derived neuro-trophic factor in mood disorders and antide-pressant treatments. Neurobiol Dis 2017; 97: 119-126.
[22] Zhang JC, Yao W and Hashimoto K. Brain-de-rived neurotrophic factor (BDNF)-TrkB signaling in inflammation-related depression and poten-tial therapeutic targets. Curr Neuropharmacol 2016; 14: 721-731.
[23] Poo MM. Neurotrophins as synaptic modula-tors. Nat Rev Neurosci 2001; 2: 24-32.
[24] Agosto-Marlin IM and Mitchell GS. Spinal BDNF-induced phrenic motor facilitation re-quires PKCtheta activity. J Neurophysiol 2017; 118: 2755-2762.
[25] Schiepers OJ, Wichers MC and Maes M. Cyto-kines and major depression. Prog Neuropsy-chopharmacol Biol Psychiatry 2005; 29: 201-217.
[26] Yang K, Xie G, Zhang Z, Wang C, Li W, Zhou W and Tang Y. Levels of serum interleukin (IL)-6, IL-1beta, tumour necrosis factor-alpha and leptin and their correlation in depression. Aust N Z J Psychiatry 2007; 41: 266-273.


![European Communities (Feedingstuffs Intended for Particular Nutritional Purposes) Regulations, 2008 [S I No 389 of 2008]](data:image/gif;base64,R0lGODlhAQABAIAAAP///wAAACH5BAEAAAAALAAAAAABAAEAAAICRAEAOw==)