Solidification Process and Behavior of Alloying Elements
in Ni-Based Superalloy Inconel718
*1Seung-Hun Kang
1;*2, Yuho Deguchi
1;*2, Kaoru Yamamoto
1, Keisaku Ogi
1and Makoto Shirai
21
Department of Materials Science and Engineering, Faculty of Engineering, Kyushu University, Fukuoka 812-8581, Japan
2Japan Aerospace Exploration Agency, Tsukuba 305-8505, Japan
The thermal and metallographic analysis of Inconel718 alloy revealed that the solidification proceeds in the order of primaryat 1615 K, (+ NbC) eutectic at 1561 K, and (+ Ni2Nb) eutectic at 1452 K. Additional equilibrium evaluation performed using Thermo-Calc predicts the
following solidification sequences: primaryat 1633 K, followed by (+ NbC) eutectic at 1555 K. The (+ Ni2Nb) eutectic phase does not
appear in the equilibrium calculation, indicating that the (+ Ni2Nb) phase crystallizes as a non-equilibrium eutectic phase. The partition
coefficients of alloying elements in the primaryand eutectic phases were also determined experimentally (k(Exp.)) and compared with the values calculated using Thermo-Calc (k(T-C)). The behaviors of alloying elements during solidification were estimated usingk(Exp.)andk(T-C)in various solidification models. It was found that the results of the experiments are in agreement with the calculations obtained using the Clyne-Kurz model.
(Received February 23, 2004; Accepted June 11, 2004)
Keywords: solidification, nickel-based superalloy, partition coefficient, Thermo-Calc, segregation
1. Introduction
Ni-based superalloy Inconel12) 718 exhibits superior
corrosion and oxidation resistance in addition to good creep and fatigue properties at moderate temperatures. However, it is highly susceptible to hot cracking in the heat affected zone
(HAZ) during arc welding.1) This micro-fissuring could be
attributed to its coarse grain structure and an increased presence of low-melting-point phases that are the result of
heavy inter-dendritic segregation.2,3) The elucidation of the
behavior of alloying elements during the solidification of Inconel718 is vital to control both its structure and properties and thus enhance the weldability of this alloy.
Moreover, the thermodynamic software, Thermo-Calc,4)
enables us to make predictions regarding the phase behavior of multi-component alloys through calculations of the phase diagrams (CALPHAD). This method of analyses is based on the thermodynamic database. However, with regard to the highly alloyed multi-component materials, particularly Ni-based superalloys, little is known about the accuracy and validity of the estimated results using the Thermo-Calc in terms of the behavior of alloying elements and its application to non-equilibrium solidification.
The main purpose of this study is to investigate the validity
of the estimated results (i.e., solidification sequence, partition
coefficient, and phase diagram) using Thermo-Calc against the experimentally determined ones. First, in order to elucidate the behavior of the alloying elements of Incon-el718, the thermal and microstructure analyses were per-formed on a series of alloy specimens quenched during solidification, and the partition coefficients of the alloying
elements between the liquid and the primary as well as
between the liquid and the eutectic phase were determined
experimentally (k(Exp.)). The values hence obtained were
compared with the calculated values using Thermo-Calc (k(T-C)). The behaviors of the alloying elements during
solidification were estimated by using k(Exp.) and k(T-C) in
Scheil’s model (except for C in the equilibrium model).
2. Experimental Procedure
[image:1.595.305.550.346.413.2]The chemical composition of Inconel718 is shown in
Table 1.5)
Using 30 g specimens, the samples were melted in a siliconit furnace by heating them to 1700 K under a pure Ar atmosphere. They were kept at 1700 K for 600 s and then cooled at 0.16 K/s through the solidification temperature range. The specimens were then polished with diamond paste and electro-etched in 10% oxalic acid. The microstructure was observed by light optical microscopy, and the chemical composition of alloying elements for each phase was quantitatively measured using an electron probe micro analyzer (EPMA).
Moreover, the equilibrium partition coefficients of the
alloying elements in the primaryphase were determined by
using specimens held for 3.6 ks at the beginning of solid-ification and were calculated using Thermo-Calc. The behaviors of the alloying elements in the liquid phase during solidification were estimated using several models. The equilibrium phase diagram was calculated by using the Thermotech Ni superalloy Database 11 of Thermo-Calc and the calculated result was compared with the experimental one.
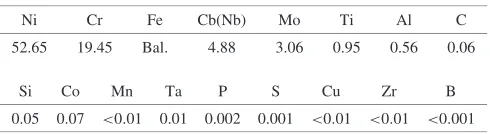
Table 1 Chemical composition (mass%).5Þ
Ni Cr Fe Cb(Nb) Mo Ti Al C
52.65 19.45 Bal. 4.88 3.06 0.95 0.56 0.06
Si Co Mn Ta P S Cu Zr B
0.05 0.07 <0:01 0.01 0.002 0.001 <0:01 <0:01 <0:001
*1This Paper was Originally Published in Japanese in J. Japan Inst. Metals 67(2003) 675–680.
3. Results and Discussion
3.1 Solidification sequence of Inconel718
A carbide and a Ni2Nb intermetallic phase solidifies in the
inter-dendritic spaces. The composition and microstructure of each phase are shown in Fig. 1. Phase(I) crystallized as MC and contains 76.5 mass% Nb, 12.4 mass% C, and
8.13 mass% Ti; and phase(II) crystallized as Ni2Nb and
contains 39.2 mass% Ni, 28.1 mass% Nb, 13.8 mass% Cr, and 11.3 mass% Fe.
Three phase transformations were observed during cooling
as shown in Fig. 2: primary at 1615 K, followed by ( +
NbC) eutectic at 1561 K, and finally ( + Ni2Nb) eutectic at
1452 K.
On the other hand, Thermo-Calc evaluation shows the
following equilibrium solidification sequences: primary at
1633 K, followed by (+ NbC) eutectic at 1555 K, as shown
in Fig. 3. The ( + Ni2Nb) eutectic phase can not be seen in
the equilibrium calculation, indicating that the ( + Ni2Nb)
phase crystallizes as a non-equilibrium eutectic phase.
Fig. 1 S-BSE and RE images quenched in 1413 K and EPMA analysis of Carbide and Ni2Nb of Inconel718.
1573
1673
1773
Time,
t
/s
Ι) 1567 K
Liquid Phase
Primary γ
200µm
ΙΙ) 1468 K
200
µ
m
200
µ
m
ΙΙΙ
) 1413 K
T
emperatur
e,
T
/K
Ni
2Nb
NbC
25µm
1373
1473
NbC
Liquid
Phase
25µm
1615 K
1561 K
1452 K
1 ks
Fig. 2 Solidification sequence of Inconel718.
0.0 0.2 0.4 0.6 0.8 1.0
1000 1200 1400 1600 1800
Temperature, T/K
Fraction of Solid,
f
s
Liquid
NbC Ni3Nb
σ
M23C6
γ
1633 K 1555 K
1493 K
[image:2.595.48.292.71.225.2] [image:2.595.320.535.201.409.2] [image:2.595.63.541.455.766.2]3.2 Behavior of alloying elements during solidification
The behavior of the alloying elements during solidification is determined by the partition coefficient at the interface between the liquid and solid phases. The specimens weighing 30 g were remelted in a 99.99% Ar atmosphere at approx-imately 100 K above the liquidus temperature and were then cooled to just below liquidus. Following this, they were held for 3.6 ks and quenched in water.
The alloying contents in the dendrite and liquid phase
just before quenching were measured by EPMA, and the
partition coefficients of the alloying elements (k) were
determined by the ratio of the composition in the phase
(CS) to the one in the liquid phase (CL). The microstructure of
the quenched specimen was composed of the coarsened
primary dendrite and the mixture of fine dendrites and
eutectic phases. Since the line analysis barely revealed microsegregation in the intra-dendritic region in comparison to that in the inter-dendritic region (rapid solidification
structure), the average alloying contents of the primary
were analyzed with a finely focused beam at several dendrites cores and those of quenched liquid were measured by a
scanning electron beam at several regions.6)
The partition coefficients of alloying elements in eutectic
carbide (kE/NbC) and (kE/) were determined byCE/NbC=
CE/LandCE/=CE/L, respectively, by the same method.
By using Thermo-Calc, the equilibrium partition
coeffi-cients of the alloying elements in the primary and eutectic
phase were evaluated.
The experimental equilibrium partition coefficients of the
alloying elements in the primary phase are shown in
Table 2, which were compared to the values calculated by Thermo-Calc. No significant difference was observed
be-tween the calculated and experimentalkvalues. Ni, Cr, and
Fe values were larger than unity and are consequently distributed in the solid phase. On the other hand, Nb, Mo, Ti, Al, and C are segregated in the liquid phase. EPMA analysis gives C concentration is much larger than expected one because of the contamination caused by the EPMA electron beam. Therefore, the partition coefficient calculated by Thermo-Calc was applied to the following calculations for C. The experimental partition coefficients of the alloying
elements in the (+ NbC) eutectic phase were calculated by
the following equation, using the specimen quenched just
below the beginning of the ( + NbC) solidification, which
are shown in Table 3.
kE¼fE/kE/þfE/NbCkE/NbC ð1Þ
where, kE is the partition coefficient of the ( + NbC)
eutectic phase,fE/ is the fraction of the eutectic phase in
the ( + NbC) eutectic phase (0.93), kE/ is the partition
coefficient of the eutecticphase,fE/NbCis the fraction of the
eutectic NbC phase in the ( + NbC) eutectic phase (0.07),
and kE/NbC is the partition coefficient of the eutectic NbC
phase. These values are close to the ones obtained using Thermo-Calc.
Moreover, the variation in concentrations of the residual liquid during solidification was calculated by using the experimental partition coefficients with Scheil’s
solidifica-tion equasolidifica-tion (eq. (2)).7) This equation is used with the
assumption that the alloying contents are homogeneous in the residual liquid, and that there is no back-diffusion in the solid phase.
CL ¼CL0ð1fsÞk1 ð2Þ
(The equilibrium equation and k(T-C) were applied for the
estimation of the concentration of C that completely diffuses in the solid).
Where CL is the alloy composition in residual liquid
(mass%),CL0 is the initial alloy composition (mass%),fs is
the fraction of the solid phase, and k is the partition
coefficient in the primary or (+ NbC) eutectic phase.
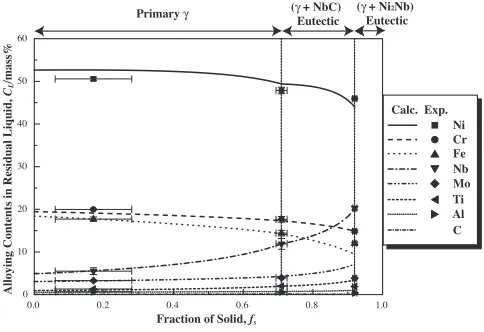
The changes in alloying contents were calculated by using the experimental partition coefficients, which were assumed to be constant values during solidification aimed at easy calculation, and are shown in Fig. 4 with the experimental
concentrations at fS¼0:71 and fS¼0:92 measured by
EPMA analysis. Regarding Nb concentration, when it
reached a value of approximately 12 mass% at fS¼0:71,
[image:3.595.305.547.93.194.2]( + NbC) eutectic solidification began. Since the partition
Table 2 Partition coefficient of alloying element in the primaryphase.
Ni Cr Fe Nb Mo Ti Al C
CS(mass%) 51.7 21.4 20.5 1.88 2.50 0.60 0.49 0.78
CL(mass%) 50.2 19.6 17.1 6.67 3.42 1.44 0.61 1.04
k(Exp.) 1.03 1.09 1.20 0.28 0.73 0.41 0.79 0.74
k(T-C) 1.02 1.07 1.18 0.20 0.63 0.42 0.97 0.12
Table 3 Partition coefficient of alloying element in the (+ NbC) eutectic phase.
Ni Cr Fe Nb Mo Ti Al C
CE/NbC(mass%) 1.64 0.75 0.57 76.5 0.00 8.13 0.01
CE/(mass%) 52.3 21.1 20.4 2.00 2.53 0.60 0.47
CL(mass%) 47.9 17.6 14.4 11.9 3.94 1.98 0.58
kE/NbC(Exp.) 0.03 0.04 0.04 6.43 0.00 4.11 0.02
kE/(Exp.) 1.09 1.20 1.41 0.17 0.64 0.30 0.81
kE(Exp.) 1.02 1.12 1.32 0.61 0.60 0.57 0.76
kE(T-C) 1.01 1.18 1.26 0.44 0.66 0.59 1.03 2.53
Alloying Contents in Residual Liquid,
CL
/mass%
Fraction of Solid, fs
Calc. Exp. Ni Cr Fe Nb Mo Ti Al C
Primary γ (γ + Ni2Nb)
Eutectic
0.0 0.2 0.4 0.6 0.8 1.0 0
10 20 30 40 50 60
(γ + NbC) Eutectic
[image:3.595.306.548.592.758.2] [image:3.595.46.290.722.786.2]coefficient of Nb was 0.61 for eutectic solidification, Nb concentration shows a higher increase to approximately
20 mass% at fS¼0:92. The calculated plots and the
experimental data for both of the alloying contents and the fraction of each solid phase are in agreement.
To investigate the effect of the variation of the partition
coefficient,kNbwas changed continuously with the changes
in alloying contents in the liquid phase during solidification.
In the case of the partition coefficient of primarycalculated
using Thermo-Calc, it changed from an initial value of 0.20 just after the beginning of solidification to 0.25 just before the
( + NbC) eutectic crystallization. The change in Nb
concentration estimated using variable kNb was almost the
same as that calculated by using constantkas shown in Fig. 4.
In order to evaluate the influence of diffusion in a freezing crystal on the redistribution of alloying elements during
solidification, Brody-Flemings8) and Clyne-Kurz9) models
were applied on back-diffusion in solids as follows:
CL ¼CL0½1 ð1BkÞfsk1=1Bk ð3Þ
¼4DStf=22 ð4Þ
where,Dsis the diffusion coefficient in solid (m2/s),tf is the
local solidification time (s), and2is the secondary dendrite
arm spacing (m).
The diffusion coefficient was expressed as Arrhenius’ equation as follows:
DS¼D0expðQ=RTÞ ð5Þ
where, D0 is the diffusion constant (m2/s), Q is the molar
activation energy (J/mol), R is the molar gas constant
(8.31 J/(molK)), andT is the absolute temperature (K).
In this study,tf ¼1011s,2¼62:9106m. For eq. (3),
B¼0 in the Scheil model, B¼2in the Brody-Flemings
model,B¼2ð1expð1=ÞÞ expð1=2Þin the
Clyne-Kurz model, and B¼1 in the equilibrium model. When
D0(Nb)¼5:6104 (m2/s) and Q¼28:6104 (1433
1616K) (J/mol)10,11)are selected for the distribution of Nb in
-Fe, for example at the melting point,ðNbÞ ¼0:32could
be calculated by using eqs. (4) and (5).
When D0(C)¼1:2105(m2/s) and Q¼14:2104
(8731673K) (J/mol)11)are chosen for the distribution of
C in Ni for example,ðCÞ ¼313:21at the melting point. The
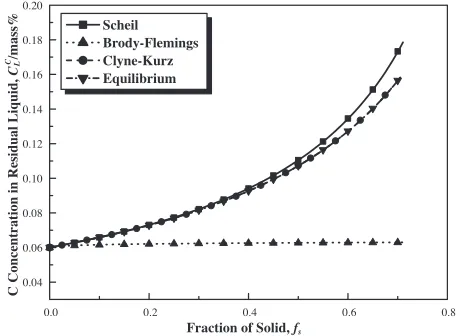
changes in Nb and C concentrations were calculated using these data, under the assumption that these are constant in the temperature interval from 1561 to 1615 K. The results are shown in Fig. 5 and Fig. 6. The experimental Nb concen-tration is in agreement with the results calculated by using the Scheil, Brody-Flemings, and Clyne-Kurz models, and this
result shows that the diffusion of Nb in primary is very
limited.
On the other hand, for the behavior of C, there is an agreement between the results calculated by the Clyne-Kurz and equilibrium models. Here, the measurements of C were much higher than expected ones because of the contami-nations in the electron beam of EPMA; hence, these results are not seen in Fig. 6. The Brody-Flemings model shows that it is impossible to obtain a value that is in agreement with the
experimental result whenis larger than 0.5. To solve this
problem, Clyne-Kurz subsequently developed their modified
model9)as a first approximation, which can be used for the
evaluation whenis larger than 0.5. Since(C) is 313.21,
this model is applicable to this case.
3.3 Validation of the solidification diagram by Thermo-Calc
To validate the calculation by Thermo-Calc, the changes in the alloying contents were calculated using calculated partition coefficients and are shown in Fig. 7 with the experiments. As can be seen in Tables 2 and 3, the experimental and calculated partition coefficient values are similar. Thus, the behavior of the alloying elements
calcu-lated using k(T-C) also does not differ widely from the
measurements.
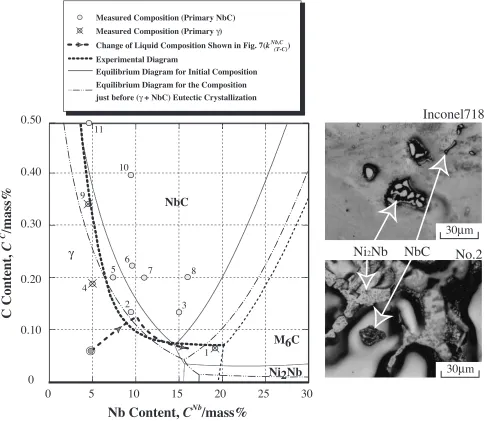
The changes in Nb and C concentrations on the pseudo-ternary liquidus surface diagram calculated using Thermo-Calc are shown in Fig. 8, where the behaviors of Nb and C influence the crystallization process of the secondary phases. Moreover, specimens with these compositions were systematically altered from 4.88 to 20.0 mass% of Nb and from 0.06 to 0.50 mass% of C. The microstructures, thus produced, were investigated to clarify which phase is the first to crystallize, as shown in Fig. 8. Specimen No. 2, containing
Scheil Brody-Flemings Clyne-Kurz Equilibrium Experiment
0.0 0.2 0.4 0.6 0.8 4
6 8 10 12 14
Nb Concentration in Residual Liquid,
CL
/mass%
Nb
Fraction of Solid, fs
Fig. 5 The changes estimated in various solidification models of Nb concentration in residual liquid during the solidification of Inconel718.
0.0 0.2 0.4 0.6 0.8 0.04
0.06 0.08 0.10 0.12 0.14 0.16 0.18 0.20
Scheil Brody-Flemings Clyne-Kurz Equilibrium
C Concentration in Residual Liquid,
CL
/mass%
C
Fraction of Solid, fs
[image:4.595.312.541.74.249.2] [image:4.595.312.543.305.473.2]9.81 mass% of Nb and 0.13 mass% of C shows that primary
NbC crystallizes in a plate shape at the middle of the
dendrite. The ( + NbC) eutectic line that depends on the
existence of primary NbC can be seen as a broken line in Fig. 8 and it is also close to that of the calculated one by Thermo-Calc, except that it is on the lower side of the C concentration.
In this diagram, the changes of alloying contents calcu-lated by using the calcucalcu-lated partition coefficients shown in Fig. 7 are plotted using the dashed and a dotted line. As soon
as the primary crystallization was completed, the
solid-ification of the ( + NbC) eutectic phase began at
10.11 mass% Nb and 0.12 mass% C. The concentration of Nb increased and that of C decreased with the progress of eutectic solidification until the completion of solidification. In fact, since microsegregation can be seen during solid-ification, the Nb concentration in the liquid increases to a
higher value at the end of solidification; therefore, ( +
Ni2Nb) eutectic crystallizes as a non-equilibrium phase.
As a result, especially during the final solidification
Alloying Contents in Residual Liquid,
CL
/mass%
Fraction of Solid, fs
Calc. Exp. Ni Cr Fe Nb Mo Ti Al C Primary γ ( Eutecticγ + NbC) (γ + Ni2Nb)
Eutectic
0.0 0.2 0.4 0.6 0.8 1.0 0
10 20 30 40 50 60
Fig. 7 The changes in the alloying contents of the residual liquid during the solidification of Inconel718, estimated usingk(T-C).
5
10
15
20
25
30
0
0.10
0.20
0.30
0.40
0.50
0
2
1 11
5 10
9
4
6
3
7 8
Change of Liquid Composition Shown in Fig. 7(k (T-C)) Measured Composition (Primary γ)
Ni
2Nb
NbC
Inconel718
No.2
Measured Composition (Primary NbC)30
µ
m
30
µ
m
Nb,C
Nb Content,
C
Nb/mass%
C Content,
C
C
/mass%
Experimental Diagram
Equilibrium Diagram for Initial Composition
Equilibrium Diagram for the Composition
just before (γ + NbC) Eutectic Crystallization
γ
NbC
M6C
Ni2Nb
[image:5.595.48.291.76.237.2] [image:5.595.59.546.335.756.2]process, there exists a large difference between the equili-brium diagram calculated by Thermo-Calc and the exper-imental one for this kind of alloy. This is because the diagram calculated by Thermo-Calc is for the initial composition of this alloy, even though the alloying contents may change with the progress of solidification. As can be seen by the dashed and two-dot line in Fig. 8, the diagram for the composition at
the end of primary crystallization was calculated by
Thermo-Calc and, following this, the (+ NbC) eutectic line
shifted to the lower Nb side. The effect of some elements and microsegregation should be taken into account for the estimation of the overall solidification process in this alloy.
4. Conclusions
The analysis of the solidification process was carried out to study the behavior of the alloying elements of Inconel718, and the results were then evaluated using the Thermo-Calc software. The following conclusions were obtained.
(1) The solidification sequence of Inconel718 shows the
primaryat 1615 K, followed by (+ NbC) eutectic at
1561 K, and finally (+ Ni2Nb) eutectic at 1452 K. On
the other hand, the Thermo-Calc evaluation shows the
primary at 1633 K, followed by the ( + NbC)
eutectic at 1555 K.
(2) The experimental partition coefficients of primary
and ( + NbC) eutectic of alloying elements are not
significantly different from the calculated ones. (3) The experimental and calculated partition coefficients
in the Clyne-Kurz solidification model provide a good description the behavior of alloying elements during solidification.
(4) There exists a small difference between the ( + NbC)
eutectic line on the equilibrium diagram by Thermo-Calc and the one on the experimental diagram. The behavior of alloying elements in this alloy during solidification can be estimated by using the pseudo-ternary liquidus surface diagram calculated using
Thermo-Calc.
(5) The ( + Ni2Nb) eutectic was not identified on the
equilibrium diagram calculated by Thermo-Calc,
be-cause ( + Ni2Nb) eutectic crystallizes as a
non-equilibrium phase. The effect of some elements and microsegregation should be taken into account for the estimation of the overall solidification process in this alloy.
Acknowledgements
This research was supported by the Japan Aerospace Exploration Agency. The authors would also like to thank Dr. D. M. Stefanesucu and Dr. F. R. Juretzko (Department of Metallurgical & Materials Engineering, University of Ala-bama, U.S.A.) for their helpful discussions on this paper.
REFERENCES
1) I. Woo, K. Nishimoto, K. Tanaka and M. Shirai: Quarterly Journal of the Japan Welding Society17(1999) 456–465.
2) M. J. Cieslak, T. J. Headley, G. A. Knorovsky, A. D. Roming, Jr. and T. Kollie: Metall. Trans.21A(1990) 479–488.
3) G. A. Knorovsky, M. J. Cieslak, T. J. Headley, A. D. Roming, Jr. and W. F. Hammetter: Metall. Trans.20A(1989) 2149–2158.
4) B. Jansson, M. Schalin, M. Selleby and B. Sundman: Proc. 2nd Int. Symposium on Computer Software in Chemical and Extractive Metallurgy, eds. C. W. Bale and G. A. Irons, (The Metallurgical Society of CIM, Quebec, 1993) pp. 57–71.
5) Ishikawajima Precision Castings Co., Ltd.
6) Y. Ono, T. Takechi, N. Murai and K. Ogi: J. Japan Inst. Metals56
(1992) 802–809.
7) E. Scheil: Z. Metallk.34(1942) 70–72.
8) H. D. Brody and M. C. Flemings: Trans. Metall. Soc. AIME236(1966) 615–624.
9) T. W. Clyne and W. Kurz: Metall.Trans.12A(1981) 965–971. 10) L. Nastac and D. M. Stefanescu: AFS Trans.104(1996) 425–434. 11) The Japan Inst. Metals:Kinzoku Databook, (ed. by Maruzen, 1974)
pp. 24–29.