JOURNAL OF FOREST SCIENCE, 61, 2015 (8): 339–344
doi: 10.17221/15/2015-JFS
Energy yield of logging residues of the south-eastern
region of the Czech Republic
T. Badal, J. Kšica, V. Vala, D. Šafařík
Faculty of Forestry and Wood Technology, Mendel University in Brno, Brno, Czech Republic
ABSTRACT: The study analyses data obtained from the production of energy chips from logging residues. Geographi-cally, the data come from the south-eastern portion of the Czech Republic. 6,671 t of energy chips were analysed by means of samples, their total energy content being 63.92 TJ. Based on the results of laboratory analyses of samples of wood chips with energy contents, ratio (reference) variables were derived and can be used as input (basic) data for the modelling of the energy potential of logging residues of the territory.
Keywords: wood chips; renewable sources; energy potential
In this country, the volume of logging residues generated as wood-harvesting waste is derived from the volume of harvested wood assortments pro-duced, i.e. as a ratio variable that is very difficult to quantify. When designing biomass-utilising proj-ects, it is very important to know the production limits of the attraction region to enable the effective planning of supplies of energy raw materials, as well as energy development projects. The variability of forest ecosystems, particularly in terms of growth and production conditions, limits the amount of woody biomass available in the region. The study aims at analysing data sourced within a specific ter-ritory; consequently, the results can be applied, to some extent, to other forest units provided that con-tinuous validation and specification are ensured. In the Czech Republic, there is an absolute absence of such aggregated information, a fact that mostly af-fects researchers, operators of energy sources and minor forest owners. Businesses active in trading and manufacturing chiefly employ the “best judge-ment” in their decision-making processes and pro-tect their experience as corporate know-how. Even so, very often there is under- or overestimation of production data and problematic planning of
pro-duction and sales. On the other hand, large forest owners offer logging residues on the “cubic metre of harvested wood” basis, stemming from the fact that a unit marketed in this way is the most easy-to-grasp for them on the basis of their wood assortment production records. Any potential buyer of logging residues is required to agree to this business model. This creates a sort of a “black box” with volumes of logging residues per quantity of harvested wood be-ing the input on the one hand, and bulk cubic metres of wood chips with energy content being the output on the other hand.
The present study thus aims at deriving propor-tional (reference) quantities that can be re-used in planning and optimising the energy use of waste woody mass in the region of interest as well as in the business and production model used in the Czech Republic.
MATERIAL AND METHODS
The present study made use of data derived solely from the production of wood chips with energy content from logging residues, which can be
fined as a woody mass remaining after tree felling, debranching and sorting, i.e. branches, treetops, splinters and handling shavings of characteristic diameter of < 7 cm (EN 14961-1:2010).
Data sourced from primary production and sales records of forest holdings and trading companies active in the production of wood chips with ener-gy content were used for deriving the proportional values. The data were divided into nine production sites (“PS”) of production of wood chips with energy content. To prevent disclosure of commercial con-fidentiality and anonymity of data contributors, the paper makes use of data aggregated into production sites (“PS”) labelled with Latin letters A through I. This lack of spatial location accuracy of data sources is partly eliminated by detailed description of the raw material and extent of the analysed database.
The database was acquired in 2012 (January to December) and contained a total of 433 business cases representing 7,715 recorded numerical val-ues. Of these, 258 business cases were used for the purpose of this study. The selection was made based on the completeness of the records; i.e. the business cases with incomplete data were not used for the purposes of the study. Data used for the
analysis represented 44,971 m3 of harvested wood
inside bark (i.b.) (timber to the top of 7 cm o.b.) and 6,671 t of wood chips with energy content (LUTRO – air dried), the total energy content being 63.92 TJ (17.76 GWh, 1,531 toe, 605,996 thm).
The resources for the production of wood chips with energy content involved forest stands after planned major felling operations, or more spe-cifically, logging residues resulting from such ac-tivities. The age of the forest stands ranged from 92 to 110 years, while the average felling log volume
(mean stem) was 0.82 m3 inside bark. The logging
residues were collected on an area of 108.36 ha,
which equals an average stand stock of 415 m3 per
hectare. Aggregated representation of woody spe-cies: spruce 62%, larch 10%, pine 9%, oak 6%, fir
5%; other coniferous and deciduous tree species amounted to 4%. The territorial unit belongs to CZ NUTS 064 – South Moravian Region (a south-east-ern portion of the Czech Republic).
The quality characteristics of the resulting energy raw material were taken from the results of ATRO (absolutely dry) acceptances at the customer (ČEZ Hodonín). The wood chips with energy content were sourced by the customer under the
quantita-tive and qualitaquantita-tive acceptance (EN 14778:2011) on
customer premises. The shipping weight was deter-mined by direct measurement using a weighbridge as the difference between the weight of the load in-cluding the means of transport (gross weight) and that of the vehicle alone (tare). Before unloading each shipment, six random samples were collected to determine quality.
Quality parameters were evaluated as described above for samples with the time from extraction to laboratory analysis being not more than 4 weeks. The threshold was chosen on the basis of produc-tion and supply possibilities and customs of the data contributors.
RESULTS
The summary values are compiled in Table 1, which makes it apparent that the greatest amount of data was obtained from the production sites (PS) G and H – about 66% of the total data. A significant amount of data was sourced from PS E and F – a total of about 20%. The remaining 14% of the data were shared by the remainder of the production sites which equalled five. Analysis of the data ac-cumulated in the production database first derived aggregated data characterizing the wood chips with energy content sourced from individual production sites. The results are compiled in Table 1.
[image:2.595.64.529.635.725.2]Deriving the ratio variables characterizing the wood chips with energy content produced from
Table. 1. Aggregated data of the input database characterizing the resulting product based on ATRO acceptances – wood chips with energy content
Production sites
A B C D E F G H I Σ
Fuel energy content (GJ) 2,015 1,484 2,084 3,203 8,180 5,327 24,441 15,060 2,119 63,919
Actual weight (t) 172 139 197 307 800 522 2,451 1,820 263 6,671
ATRO weight (At) 140 103 144 222 576 370 1,689 1,024 145 4,415
TMib (m3) 800 780 1,070 1,680 5,400 3,515 16,423 13,207 2,096 44,971
Percentage 1.78 1.73 2.38 3.74 12.01 7.82 36.52 29.37 4.66 100
logging residues per PS in terms of quality was the next step in data analysis. The aggregate data were first split per PS and quality parameters (Table 2), then for each quality parameter, cumulatively for
all the PS, with use of arithmetic (x') and weighted
arithmetic average (–x), where the volume of
har-vested wood of 7 cm (TMib) was determined as the
weight of logged timber. The ratio variables were further tested statistically. The results are shown in Table 2.
DISCUSSION
The data analysis found the following:
Wrt–water content in the original sample (%) –
this variable is essential for the wood heating value to be useful (Kristensen et al. 2000; Paulrud 2004; Cutshall et al. 2013; Greene et al. 2014). This is the actual moisture content of the fuel (the index “t” denotes the raw status of the fuel – the actual weight that is referred to as LUTRO). The wood moisture content indicates the amount of water in the wood, expressed as a percentage. The field practice differentiates between “relative” and
“absolute” moisture content of the wood. Using wood to generate energy employs relative moisture content; this was the case in the wood chip
accep-tances we analysed – the index “r” (Wr – relative
moisture content). The average final moisture of the
data analysed: x' = 39.77%, –x = 42.34%. Cutshall
[image:3.595.63.535.73.336.2]et al. (2013) stated in their study that the initial moisture content of felled wood of 53% decreased during 4 weeks to a value of 43% due to transpi-ration drying, dropping further to 39% during the subsequent four weeks. The values we obtained for logging residues in the area of interest are correlat-ed with the results of this research, and a decrease in moisture content in freshly produced logging residues can be considered to be about 10% dur-ing the initial 4 weeks, which is very important in terms of technological use of the resulting material and is crucial for the cost-effectiveness of utilising of logging residues to generate energy. It is neces-sary to mention a study published by Jirjis (1995), in which the author also points to the opposite ten-dency, i.e. that in the case of long-term storage of biomass (over 11 months) in piles, the initial drop of moisture is followed by the material regaining its moisture content and losing its quality.
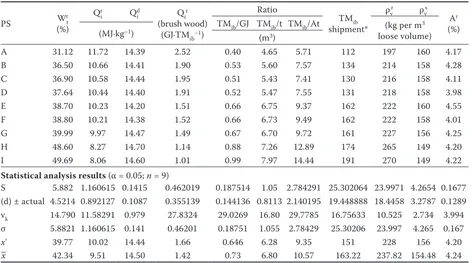
Table 2. Statistical analysis of the ratio variables obtained – resulting data
PS Wtr
(%)
Qir Q i
d Q
ir
(brush wood) (GJ·TMib–1)
Ratio
TMib shipment*
ρvr ρ vs
Ar
(%) TMib/GJ TMib/t TMib/At (kg per m3
loose volume) (MJ·kg–1)
(m3)
A 31.12 11.72 14.39 2.52 0.40 4.65 5.71 112 197 160 4.17
B 36.50 10.66 14.41 1.90 0.53 5.60 7.57 134 214 158 4.28
C 36.90 10.58 14.44 1.95 0.51 5.43 7.41 130 216 158 4.11
D 37.64 10.44 14.40 1.91 0.52 5.47 7.55 131 218 158 3.98
E 38.70 10.23 14.20 1.51 0.66 6.75 9.37 162 222 160 4.55
F 38.80 10.21 14.38 1.52 0.66 6.73 9.49 162 222 158 4.01
G 39.99 9.97 14.47 1.49 0.67 6.70 9.72 161 227 156 4.25
H 48.60 8.27 14.70 1.14 0.88 7.26 12.89 174 265 149 4.20
I 49.69 8.06 14.60 1.01 0.99 7.97 14.44 191 270 149 4.22
Statistical analysis results (α = 0.05; n = 9)
S 5.882 1.160615 0.1415 0.462019 0.187514 1.05 2.784291 25.302064 23.9971 4.2654 0.1677 (d) ± actual 4.5214 0.892127 0.1087 0.355139 0.144136 0.8113 2.140195 19.448888 18.4458 3.2787 0.1289 vk 14.790 11.58291 0.979 27.8324 29.0269 16.80 29.7785 16.75633 10.525 2.734 3.994 σ 5.8821 1.160615 0.141 0.46201 0.18751 1.055 2.78429 25.30206 23.997 4.265 0.167
x' 39.77 10.02 14.44 1.66 0.646 6.28 9.35 151 228 156 4.20
–
x 42.34 9.51 14.50 1.42 0.73 6.80 10.57 163.22 237.82 154.48 4.24 PS – production site; Wrt–water content in the original sample; Q
i
r – heating value of the energy raw material (wood chips);
Qid – dry matter heating value; TM
ib – amount of extracted and recorded timber in cubic metres inside bark; t – actual weight
(LUTRO); At – ATRO weight; *vehicle: a high-capacity walking floor trailer, cargo area capacity 90 stacked m3 (unpacked),
max. cargo weight 24 t; ρv – bulk (volume) weight; r, s – real condition, initial; s – bulk density of chipped material; (d) ±
act. – mean value of determination accuracy; vk – coefficient of variation; σ – variance (variation); x' – arithmetic average; –
Qir – heating value of the energy raw material
(wood chips) (MJ per kg). Qi (heating value)
rep-resents the heat released by the combustion of 1 kg
of fuel to produce CO2, SO2, N2 and steam (instead
of water). The heating value is determined by divid-ing the heat that is released when the fuel has com-pletely burned by the weight of the fuel when flue gases cool down to the initial temperature of the fuel.
Heating value Qi (Lower heating value) refers to the
heat released under the same conditions as the heat of combustion, but the resulting water is in the form of steam. Heating value is significantly influenced by fuel moisture content (Kristensen et al. 2000;
Bedane et al. 2011). Average heating value Qir
ob-tained from the analysed data: x' = 10.02 MJ·kg–1,
–x = 9.51 MJ·kg–1.
Qir of brushwood (GJ·m–3
VHir) refers to the
quan-tity derived by the author from the heating value of wood chips with energy content related to the amount of harvested wood inside bark (produced wood with a top diameter ≥ 7 cm). The relationship can be taken in writing using equation (1):
Qir
logging residues = Qi
r wood chips (GJ)
m3
VHib (GJ·m–3
VHib) (1)
The resulting average heating values of
brush-wood: x' = 1.66 GJ·m–3
VHib, –x = 1.42 GJ·m–3VHib.It can
therefore be stated that the analysed region can be expected to possess an energetic potential of the
logging residues generated of 1.66 GJ·m–3
VHib per
every cubic metre of wood (timber) inside bark.
Qid – dry matter heating value (MJ·kg–1). The
heating value of dry matter (the index “d” refers to dry matter, the index “daf” refers to the combus-tible matter, i.e. dry matter without ash) of wood chips with energy content produced from logging residues ranged from 14.38 to 14.70 MJ per kg. The average dry matter heating value for the analysed
data: x' = 14.44 MJ·kg–1, –x = 14.50 MJ·kg–1.
Ar – ash (%) is another important quality
param-eter of fuel (Narodoslawsky et al. 1996) and is classified as a ballast material, along with water. Since ballast materials reduce fuel efficiency, the heating value of fuel needs to be distinguished from that of the combustible matter, the latter not be-ing affected by the content of ballast matter. In the combustion process, a certain amount of the reac-tion heat is consumed to heat the ballast matter and evaporate water, which slows down the combustion process and causes the combustion stability to de-crease in extreme cases. An inde-creased content of ballast matter, particularly water and ash, increases transportation costs and production of
problem-atic solid combustion residues, which need to be managed as waste (Röser et al. 2011; Greene et al. 2014). The average ash content within the analysed
data (6.671 t of wood energy chips) was x' = 4.2%,
–x = 4.24% (max. of 4.55%, min. of 3.98%). The
result-ing ash content in our case is influenced by the type of woody mass, i.e. logging residues. The example of logging residues indicates that the proportion of ballast ash is higher than that of pure wood, proba-bly due to the higher content of bark (bark is higher in ash). Assumed can also be a greater share of im-purities (litter) mixed into the brushwood during brushwood picking and handling. The statement mentioned above can be supported by the research of Picchio et al. (2012) involving wood chips with energy content obtained from plantations of fast-growing tree species (FTS). Picchino et al. (2012) found that the proportion of ash in wood chips sourced from 2-year FTS reached the average level of 3.8%, which was 2.8% for three-year trees. Erol et al. (2010) found that the ash content in woody species was 5.75% for common ash and 3.47% for poplar. Dzurenda et al. (2012) analysed the green wood chips from poplar branches to find that the ash content per sample averaged 0.52% for wood, 6.86% for bark and 3.36% for wood mixed with bark. It indicates that an increased share of bark and a lesser proportion of wood have a negative effect on the resulting value of ash in wood chips with energy content (Sarenbo 2009). Liaquat (2011) and Gruduls (2013) revealed in their stud-ies an increase in ash content due to melting snow,
i.e. increased amount of impurities. ρv – bulk
(vol-ume) weight (kg per m3 loose volume) of chipped
material is defined as the mean density of bulk, dis-continuously distributed substance, i.e. it involves the bulk density of an unpacked material (Eq. 2).
s = ms/Vs (kg·m–3, kg·prms–1) (2)
where:
s – bulk density of chipped material, ms – weight of a given volume of chips (kg), Vs – geometric volume of the filled space (m3).
Bulk density for the analysed data ranged from
197 to 270 kg per kg·prms–1, with average values
being x' = 228, –x = 237.82. Bulk density of dry
mat-ter: x'= 156, –x = 154.48. Bulk density is an important
parameter in terms of logistics (Angus-Hankin et al. 1995; Hamelinck 2005; Ranta et al. 2006). Further, quantities were derived from the aggre-gate data in relation to the basic record-keeping
unit, i.e. m3 of harvested wood. It was found:
x' = 0.64 TMib, –x = 0.73 TMib (min. 0.40, max. 0.99) of harvested wood (timber), while producing a tonne (t) of wood chips necessitated the treatment of
log-ging residues that equalled x'; –x = 6.28; 6.8 TMib
(min. 5.71, max. 14.44).A truck = a shipment (V =
90 stacked m3, about 24 t) was fully filled with
log-ging residues that equalled the loglog-ging volume of x';
–x = 151; 163 (min. 112; max. 191) TM
ib. The
pro-duction of an atro tonne (At) of wood chips needed the processing of logging residues that equalled the
harvested wood quantity of x'; –x = 9.35; 10.57 (min.
5.71; max. 14.44) TMib.
Fig. 1 shows the average percentage of individual components represented in the fuel – produced and delivered wood chips. The water content was 40%, dry (combustible matter) matter was 55.80% and ash content was 4.20%.
CONCLUSIONS
Analysing the production data of the area of in-terest identified average quality characteristics of wood chips with energy content made exclusively from logging residues as follows: average moisture
content Wrt = 42.34%, heating value Q
i
r = 9.51 MJ
per kg, ash content Ar of 4.24%. Obtaining a unit of
energy (GJ) required an average of x' = 0.64 TMib,
–x = 0.73 TM
ib (min. 0.40, max. 0.99) of harvested
wood (timber), while producing a tonne of wood chips necessitated the treatment of logging residues
that equalled x'; –x = 6.28; 6.8 TMib (min. 5.71, max.
14.44). A truck = a shipment (V = 90 stacked m3,
about 24 t) was fully filled with logging residues that
equalled the logging volume of x'; –x = 151; 163 (min.
112; max. 191) TMib.The production of an ATRO
tonne (At) of wood chips needed the processing of logging residues that equalled the harvested wood
quantity of x'; –x = 9.35; 10.57 (min. 5.71; max. 14.44)
TMib. The data sourced from the research can be
used as an input for optimising models of seeking alternatives of efficient use of logging residues as a renewable energy raw material (Freppaz et al. 2004; Rentizelas et al. 2009; Schmidt et al. 2010; Rauch et al. 2011). The optimising models based on the collected data are to provide information on the available energy balance (Röser et al. 2011) of the region through which they will provide the best possible support for the energy utilisation of log-ging residues and the diversification of the energy mix of the region (Naik et al. 2010), while contrib-uting to the reduction of greenhouse gas emissions (Kobayashi 2011; Cocchi et al. 2013). Last but not least, the data will promote the motivation of small forest owners to market this source of energy (Conrad et al. 2011; Joshi et al. 2011).
References
Angus-Hankin C., Stokes B., Twaddle A. (1995): The trans-portation of fuelwood from forest to facility, Biomass and Bioenergy, 9: 1–5.
Bedane A.H., Afzal M.T., Sokhansanj S. (2011): Simulation of temperature and moisture changes during storage of woody biomass owing to weather variability, Biomass and Bioenergy, 35: 3147–3151.
Cocchi S., Castellucci S., Tucci A. (2013): Modeling of an air conditioning system with geothermal heat pump for a residential building. Mathematical Problems in Engineer-ing, 2013: 1–6.
Conrad J.L., Bolding M.C., Smith R.L., Aust W.M. (2011): Wood-energy market impact on competition, procure-ment practices, and profitability of landowners and forest products industry in the U.S. south. Biomass and Bioen-ergy, 35: 280–287.
Cutshall J.B., Greene W.D., Baker S.A. (2013): Transpirational drying effects on energy and ash content from whole-tree southern pine plantation chipping operations. Southern Journal of Applied Forestry, 37: 133–139.
Dzurenda L. (2012): Energetic characteristics green chips made of branches of wood species Populus × euroameri-cana clone Koltay grown on plantations. Acta Facultatis Xylologiae, 54: 115–122.
Erol M., Haykiri-Acma H., Küçükbayrak S. (2010): Calorific value estimation of biomass from their proximate analyses data. Renewable Energy, 35: 170–173.
Freppaz D., Minciardi R., Robba M., Rovatti M., Sacile R., Taramasso A. (2004): Optimizing forest biomass exploi-tation for energy supply at a regional level, Biomass and Bioenergy, 26: 15–26.
[image:5.595.113.227.57.185.2]Greene W.D., Cutshall J.B., Dukes C.C., Baker S.A.(2014): Improving woody biomass feedstock logistics by reducing ash and moisture content. BioEnergy Research, 7: 816–823. Fig. 1. Percentage of individual components per average
sample of wood chips produced Water content
40%
Ash 4% Dry matter
(DM) 56%
Water content
40% Dry matter
(DM) 56%
Gruduls K., Bardule A., Zalitis T., Lazidin A. (2013): Charac-teristics of wood chips from logging residues and quality influencing factors. In: Annual 19th International Scientific
Conference Proceedings. Research for Rural Development, 2: 49–54.
Hamelinck C.N., Suurs R.A., Faaij A.P. (2005): International bioenergy transport costs and energy balance. Biomass and Bioenergy, 29: 114–134.
Jirjis R. (1995): Storage and drying of wood fuel. Biomass and Bioenergy, 9: 1–5.
Joshi O., Mehmood S.R. (2011): Corrigendum to factors affecting nonindustrial private forest landowners’ willing-ness to supply woody biomass for bioenergy. Biomass and Bioenergy, 35: 186–192.
Kobayashi N., Fan L.S.(2011): Biomass direct chemical loop-ing process: A perspective. Biomass and Bioenergy, 35: 1252–1262.
Kristensen E.F., Kofman P.D. (2000): Pressure resistance to air flow during ventilation of different types of wood fuel chip. Biomass and Bioenergy, 18: 175–180.
Liaqat F. (2011): Effects of Storage and Geographical Loca-tion on Fuel Quality of Norway Spruce Forest Residues. Uppsala, Swedish University of Agricultural Sciences: 45. Naik S., Goud V.V., Rout P.K., Jacobson K., Dalai A.K. (2010): Characterization of Canadian biomass for alternative re-newable biofuel. Rere-newable Energy, 35: 1624–1631. Narodoslawsky M., Obernberger I. (1996): From waste to raw
material-the route from biomass to wood ash for cadmium and other heavy metals. Journal of Hazardous Materials, 50: 157–168.
Paulrud S., Nilsson C. (2004): The effects of particle char-acteristics on emissions from burning wood fuel powder. Fuel, 83: 7–8.
Picchio R., Spina R., Sirna A., Monaco A.L., Civitarese V., Giudice A.D., Suardi A., Pari L. (2012): Characterization of woodchips for energy from forestry and agroforestry production. Energies, 5: 3803–3816.
Ranta T., Rinne S. (2006): The profitability of transporting uncomminuted raw materials in Finland. Biomass and Bioenergy, 3: 231–237.
Rauch P., Gronalt M. (2011): The effects of rising energy costs and transportation mode mix on forest fuel procurement costs. Biomass and Bioenergy, 35: 690–699.
Rentizelas A., Tatsiopoulos I., Tolis A. (2009): An optimiza-tion model for multi-biomass tri-generaoptimiza-tion energy supply. Biomass and Bioenergy, 33: 223–233.
Röser D., Mola-Yudego B., Sikanen L., Prinz R., Gritten D., Emer B., Väätäinen K., Erkkilä A. (2011): Natural drying treatments during seasonal storage of wood for bioenergy in different European locations. Biomass and Bioenergy, 35: 4238–4247.
Sarenbo S. (2009): Wood ash dilemma-reduced quality due to poor combustion performance. Biomass and Bioenergy, 33: 1212–1220.
Schmidt J., Leduc S., Dotzauer E., Kindermann G., Schmid E. (2010): Potential of biomass-fired combined heat and power plants considering the spatial distribution of bio-mass supply and heat demand. International Journal of Energy Research, 34: 970–985.
Received for publication February 15, 2015 Accepted after corrections June 23, 2015
Corresponding author:
Ing. Tomáš Badal, Ph.D., Mendel University in Brno, Faculty of Forestry and Wood Technology,