Early Selection of Potato Clones with the
H1
Resistance
Gene – the Relation of Nematode Resistance
to Quality Characteristics
Dorota MILCZAREK
1, Anna PRZETAKIEWICZ
2, Piotr KAMIŃSKI
3and Bogdan FLIS
11Research Centre Młochów, Plant Breeding and Acclimatization Institute – National Research
Institute, Młochów, Poland; 2Research Centre Radzików, Plant Breeding and
Acclimatization Institute – National Research Institute, Błonie, Poland; 3Potato Breeding
Zamarte Ltd – IHAR Group, Kamień Krajeński, Poland
Abstract
Milczarek D., Przetakiewicz A., Kamiński P., Flis B. (2014): Early selection of potato clones with the H1 resist-ance gene – the relation of nematode resistresist-ance to quality characteristics. Czech J. Genet. Plant Breed., 50: 278–284. Breeding a new potato cultivar is a long-term process ending with a few elite individuals from initially large populations. Screening for resistance in the seedling and first clonal generations is a cost-effective and effi-cient way to reduce the time needed to create a new variety. Unlike the phenotypic assessment of resistance to nematodes, marker-assisted selection (MAS) can be applied at early stages of selection. The frequent question among breeders is about the impact of early selection for resistance on the agronomic value of finally selected resistant progeny. The study presents a relationship between the presence of markers TG689 and 57R and some agricultural traits in field grown seedlings and three successive vegetative generations. Both markers are linked to H1 gene, which confers resistance to the golden cyst nematode Globodera rostochiensis. Clones with these markers had higher total tuber and starch yield than those without the markers. A negative relationship between marker presence and quality was not observed.
Keywords: breeding; Globodera rostochiensis; marker-assisted selection; MAS; Solanum tuberosum
Potato is one of the most important crops whose production is limited by a number of various biological and environmental factors. Nematodes are among the most important agents affecting potato crops. Heavy infestations by Globodera rostochiensis can cause significant yield losses and limit the choice of potato cultivars that can be grown effectively (Oerke 2006). Resistance to nematodes is very important especially for starch potato, because of the weak crop rotation applied in areas of intensive starch potato produc-tion. Therefore, cultivation of resistant cultivars is the most effective and environmentally the safest method of protection. Resistance to nematodes was not found originally within Solanum tuberosum ssp. tuberosum. Thus, breeding for resistance to nema-todes is based on genes which were identified and successfully introduced into potato cultivars from
other Solanum species (Dalamu et al. 2012). Among them is H1, common in current cultivars (Biryukova et al. 2008; Karelov etal. 2013). The H1 gene was derived from S. tuberosum ssp. andigena and confers nearly complete and durable resistance to pathotypes Ro1 and Ro4 of G. rostochiensis (Gebhardt etal. 1993; Niewöhner et al. 1995). The pathotype Ro1 of G. rostochiensis is still the most common in Eu-rope (Evans & Stone 1977; Sobczak et al. 2005, Holgado & Magnusson 2010).
initially large numbers of individuals are gradually decreasing during selection. This process is laborious and long-lasting mainly due to low multiplication rate and environmental effects that interfere in the evaluation of the majority of tested traits. The ap-plication of molecular markers does not depend on such conditions and might improve selection even in early stages of breeding. However, the effects of MAS depend on the marker effectiveness, cost of its application and stage of selection at which it is applied. The repeated question among breeders is how obligatory selection for resistance to nematodes may influence a decrease in the agronomic value of selected resistant progeny. This can limit the use of markers in the initial phase of selection due to the concern of rejection of valuable individuals. None-theless, the evidences for a relationship between the presence of the markers of resistance genes and the observed level of quality are scarce. The aim of this research was to assess the relationship between the presence of the H1 gene markers and some quality traits important in potato breeding.
MATERIAL AND METHODS
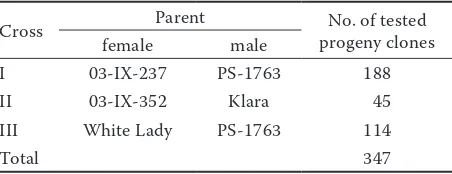
Plant materials. A total of 347 selections from
3 crosses were obtained in a crossing programme performed in Młochów Research Centre (Table 1). Seeds were sown in April and after 4 weeks, seedlings were transplanted into pots. At the end of May, seed-lings were transplanted into the field at 0.4 m × 0.4 m spacing. At the beginning of October, tubers were harvested from single plants. In the next three years, progeny clones were grown in 7-hill plots planted at the end of April and harvested in mid-September. In the 3rd year, each clone was planted in duplicate (2 × 7-hill plots).
All clones were screened for the set of agronomic traits: (a) tuber yield (kg per plant), (b) tuber size on a 9-grade scale (where 9 = the biggest) or on a 5-grade scale for seedlings (where 5 = the biggest), (c) the percentage of tuber starch content (determined
from specific gravity (Zgórska 2001)), (d) starch yield (kg per plant), (e) regularity of tuber shape on a 9-grade scale (9 = the most regular shape), (f ) eye depth on a 9-grade scale (1 = the eye depth > 5 mm; 9 = the eye depth = 0 mm) and (g) defects of tubers on a 4-grade scale (1 = high intensity of serious defects, 4 = no defects). Simultaneously, all these clones were evaluated for resistance to pathotype Ro1 of Globodera rostochiensis and screened with the markers TG689 and 57R linked to H1 gene.
Diagnostic PCR marker assays. Total genomic
DNA was extracted from frozen leaves using the GenElute Plant Genomic DNA Miniprep Kit (Sigma, Hamburg, Germany).
Tested clones were evaluated for the presence of markers TG689 and 57R linked to H1 gene. For the reactions with TG689 marker, the BCH marker of conserved regions of beta-carotene hydroxylase was added as an internal control for successful PCR (Brown et al. 2006).
The PCR amplification was performed in 20 µl of 0.2mM dNTPs, 0.4mM of each primer for TG689 and 57R, 0.2mM of each primer for BCH, contain-ing 1 U Taq DNA Polymerase in the reaction buffer provided by the manufacturer (Novazym, Poznań, Poland). The PCR temperature parameters and primer sequences for amplifying the used markers are de-scribed in Table 2. Amplified markers were analysed in 1% agarose gel.
Test for resistance to nematodes. The resistance
tests for pathotype Ro1 of G. rostochiensis were performed in pots with one litre of soil containing nematode cysts. There were four replicates. Plants were grown in a greenhouse for six weeks, then plants with soil were taken out and the cysts were counted. The relative susceptibility of tested breeding lines was calculated according to the formula:
(Pf of tested sample)/(Pf of susceptible standard cultivar) × 100%
where:
Pf – the mean number of cysts determined by count-ing all cysts from all replicates; cv. Desirée was a susceptible standard
Resistance was converted to a 9-grade scale, where score 9 indicates the highest level of resistance ac-cording to the EU Council Directive 2007/33/EC. The breeding line was regarded as resistant when the score was higher than 5 (OEPP/EPPO 2006)
Cost estimation. Costs of marker assays included
the cost of DNA isolation, PCR reaction and visuali-Table 1. Crosses: progenitors and number of evaluated
progeny genotypes
Cross Parent progeny clonesNo. of tested
female male
I 03-IX-237 PS-1763 188
II 03-IX-352 Klara 45
III White Lady PS-1763 114
[image:2.595.64.290.670.757.2]zation. Total labour time for DNA extraction, PCR and electrophoresis was estimated for 800 genotypes. On this basis, the time needed to test one genotype was calculated as well as the labour costs according to the cost of 1 h of work of the personnel involved.
The costs of phenotypic screening for resistance to nematode including the labour costs of preparing the inoculum, planting, watering, rinsing roots and counting cysts, etc. per genotype were calculated.
The costs of materials and labour were increased by 30% overhead for indirect costs.
Statistical analyses. For comparisons of mean
values for groups of clones with or without markers, Student’s t-test with unequal variances was applied. ANOVA was used for the results of replicated field experiment. To assess the relationships between various classes of clones, Fisher’s two-tailed test was used.
RESULTS
All selected parental forms were resistant to patho-type Ro1 of G. rostochiensis and found to be TG689 and 57R-positive, clearly indicating the presence of the H1 gene. A total of 347 seedling plants were obtained from three crosses and screened with both markers. All selections were evaluated for phenotypic resistance to pathotype Ro1 of G. rostochensis. From among the evaluated progenies, 316 (i.e. 91%) and 325 (94%) clones matched the observed phenotype with the results of applying TG689 or 57R marker,
respectively (Table 3). For each contingency table, Fisher’s exact test confirmed a strong relationship between marker presence and resistance (P < 0.001), hence the usefulness of these markers for selecting resistant individuals.
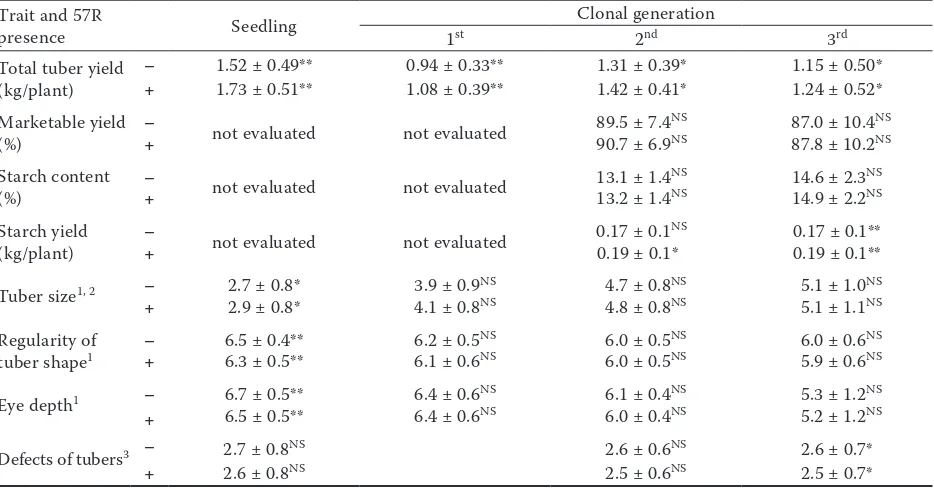
[image:3.595.60.532.101.307.2]The mean values and range for evaluated traits of individuals at the seedling stage and for subsequent clonal generations are presented for the groups dif-fering in the presence or absence of specific markers (Tables 4 and 5). At the seedling stage, clones that had TG689 or 57R marker revealed higher yield and this relationship was also observed for subsequent generations. Seedlings having TG689 or 57R marker had bigger tubers than seedlings without this marker, but this relationship was not observed for subsequent Table 2. The PCR temperature parameters and primer sequences for amplifying the used markers
Marker/gene Type Product size (bp)1 Primer sequence (5'-3') Temperature parameters for PCR Reference
TG689/H1 PCR (SCAR) 141 (R)
Fw: TAA AACTCTTGGT-TATAGCCTAT Rv:
CAATAGAATGTGTT-GTTTCACCAA
95°C for 3 min initially then 35 cycles of:
94°C, 20 s; 55°C, 20 s; 72°C, 30 s and 72°C for 3 min finally
Walter De Jong (personal communication)
BCH PCR 290 (R, S)
Fw: CATGACATAGTTT-GAATTTTGAGTC Rv:
CGTTTGGCGCTGCCGTA-AGTT
57R/H1 PCR (SCAR) 1500 (R, S)450 (R)
Fw: TGC CTG CCT CTC CGA TTT CT
Rw: GGT TCA GCA AAA GCA AGG ACG TG
95°C for 3 min initially then 35 cycles of:
94°C, 30 s; 63°C, 15 s; 72°C, 1 min and 72°C for 3 min finally
Finkers-Tomc-zak et al. (2011)
1Size of the amplification products in resistant (R) and susceptible (S) plants
Table 3. Classification of clones according to phenotypic and genetic assessments
Marker and its presence
No. of clones expressing
Total resistance susceptibility
TG689
+ 241 20 261
– 11 75 86
total 252 95 347
57R
+ 243 13 256
– 9 82 91
total 252 95 347
[image:3.595.306.532.594.715.2]generations. Tubers of seedlings with marker TG689 or 57R were more irregular in shape and had deeper eyes, but this relationship was not observed for successive
[image:4.595.65.532.112.358.2]generations. Clones with identified marker TG689 or 57R had similar starch content, but significantly higher starch yield compared with clones without Table 4. Agronomic traits of clones with segregating marker TG689 at the field seedling stage and successive vegetative generations (mean ± SD)
Trait and TG689
presence Seedling 1st Clonal generation 2nd 3rd
Total tuber yield
(kg/plant) –+ 1.52 ± 0.49**1.72 ± 0.51** 0.93 ± 0.32**1.08 ± 0.39** 1.31 ± 0.39*1.42 ± 0.41* 1.13 ± 0.51**1.24 ± 0.52** Marketable yield
(%) – not evaluated not evaluated 90.0 ± 7.2
NS 86.9 ± 10.5NS
+ 90.5 ± 7.0NS 87.8 ± 10.2NS
Starch content
(%) – not evaluated not evaluated 13.1 ± 1.4
NS 14.6 ± 2.3NS
+ 13.2 ± 1.4NS 14.9 ± 2.2NS
Starch yield
(kg/plant) – not evaluated not evaluated 0.17 ± 0.1
NS 0.17 ± 0.1**
+ 0.19 ± 0.1NS 0.19 ± 0.1**
Tuber size1, 2 – 2.7 ± 0.8** 3.9 ± 0.9NS 4.7 ± 0.8NS 5.0 ± 1.0NS
+ 2.9 ± 0.8** 4.1 ± 0.8NS 4.7 ± 0.8NS 5.1 ± 1.1NS
Regularity of
tuber shape1 – 6.5 ± 0.4** 6.2 ± 0.5
NS 6.0 ± 0.5NS 6.0 ± 0.6NS
+ 6.3 ± 0.5** 6.1 ± 0.6NS 6.0 ± 0.5NS 5.9 ± 0.6NS
Eye depth1 – 6.7 ± 0.5** 6.3 ± 0.6NS 6.1 ± 0.4NS 5.3 ± 1.2NS
+ 6.5 ± 0.5** 6.4 ± 0.6NS 6.0 ± 0.4NS 5.3 ± 1.2NS
Defects of tubers3 – 2.7 ± 0.8NS 2.6 ± 0.6NS 2.6 ± 0.7NS
+ 2.6 ± 0.8NS 2.5 ± 0.6NS 2.5 ± 0.7NS
*, **, NSdifference in mean values significant at P = 0.05 or 0.01 or insignificant; 1in 9 grade scale (9 = the biggest, the most
regular shape, the shallowest eyes); 2in 5 grade scale for seedlings (5 = the biggest); 3in 4 grade scale (1 = high intensity
of serious defects, 4 = no defects)
Table 5. Agronomic traits of clones with segregating marker 57R at the field seedling stage and successive vegetative generations (mean ± SD)
Trait and 57R
presence Seedling 1st Clonal generation2nd 3rd
Total tuber yield
(kg/plant) –+ 1.52 ± 0.49**1.73 ± 0.51** 0.94 ± 0.33**1.08 ± 0.39** 1.31 ± 0.39*1.42 ± 0.41* 1.15 ± 0.50*1.24 ± 0.52* Marketable yield
(%) – not evaluated not evaluated 89.5 ± 7.4
NS 87.0 ± 10.4NS
+ 90.7 ± 6.9NS 87.8 ± 10.2NS
Starch content
(%) – not evaluated not evaluated 13.1 ± 1.4
NS 14.6 ± 2.3NS
+ 13.2 ± 1.4NS 14.9 ± 2.2NS
Starch yield
(kg/plant) – not evaluated not evaluated 0.17 ± 0.1
NS 0.17 ± 0.1**
+ 0.19 ± 0.1* 0.19 ± 0.1**
Tuber size1, 2 – 2.7 ± 0.8* 3.9 ± 0.9NS 4.7 ± 0.8NS 5.1 ± 1.0NS
+ 2.9 ± 0.8* 4.1 ± 0.8NS 4.8 ± 0.8NS 5.1 ± 1.1NS
Regularity of
tuber shape1 – 6.5 ± 0.4** 6.2 ± 0.5
NS 6.0 ± 0.5NS 6.0 ± 0.6NS
+ 6.3 ± 0.5** 6.1 ± 0.6NS 6.0 ± 0.5NS 5.9 ± 0.6NS
Eye depth1 – 6.7 ± 0.5** 6.4 ± 0.6NS 6.1 ± 0.4NS 5.3 ± 1.2NS
+ 6.5 ± 0.5** 6.4 ± 0.6NS 6.0 ± 0.4NS 5.2 ± 1.2NS
Defects of tubers3 – 2.7 ± 0.8NS 2.6 ± 0.6NS 2.6 ± 0.7*
+ 2.6 ± 0.8NS 2.5 ± 0.6NS 2.5 ± 0.7*
*, **, NS - difference in mean values significant at P = 0.05 or 0.01 or insignificant; 1in 9 grade scale (9 = the biggest,
the most regular shape, the shallowest eyes); 2in 5 grade scale for seedlings (5 = the biggest); 3in 4 grade scale (1 = high
[image:4.595.65.532.484.728.2]these markers. Fourteen out of 18 clones with starch content over 19% (19.0–25.6%) had both markers. Clones that had marker TG689 or 57R revealed more defects of tubers (mainly slight secondary growth and skin condition defects), but this relationship was not observed in the seedling stage (Tables 4 and 5).
Out of the 347 tested clones, 100 had qualitative traits at an acceptable level and both markers were identified in 77 of them (Table 6). Fisher’s exact test revealed that the quality of selected clones is inde-pendent of the presence or absence of the marker. However, the probability of rejecting valuable geno-types in the absence of marker for the tested popula-tions amounts to 6.6% (23 clones out of 347 tested). Regarding the economic aspect of applying MAS, the costs of phenotypic evaluation of resistance to nema-todes were compared with the costs of applying each of the markers (Table 7). The cost of applying TG689 is a bit higher than the cost of using 57R due to the need of additional internal control of successful PCR in the case of TG689. The cost of phenotypic evaluation of nematode resistance of one tuber was estimated at 2.5 €. According to OEPP/EPPO phytosanitary procedures (OEPP/EPPO 2006) a single test is performed with at least four replicates per potato genotype. The results of tests should be confirmed by at least one more trial
performed in the next years. If results of the first year testing indicate complete susceptibility, no further test-ing is required. At Plant Breedtest-ing and Acclimatization Institute-National Research Institute (IHAR-PIB), the final score for resistant genotypes is based on 27 tubers evaluated over three seasons. However, even a single phenotypic test of resistance to nematodes is more expensive than the use of molecular markers.
DISCUSSION
Molecular markers could be used in parent selection for more efficient utilization of existing potato germ-plasm. Barone (2004) pointed out that molecular markers are useful for the introgression of genes from a wild species through a backcross breeding scheme. Nonetheless, in most of the previous simulations and analyses, MAS was considered simply within its role as an alternative to phenotypic selection.
In this study, two markers of the H1 gene (TG689 and 57R) were tested. Each of these markers produced a high percentage (more than 90%) of matching with phenotypic tests, confirming their usefulness in se-lection. Marker TG689 was previously applied and found to be useful in the selection of Polish breeding material (Galek et al. 2011; Milczarek et al. 2011). However, the use of 57R leads to a reduction in the number of susceptible recombinants as compared with TG689. This is favourable for breeding purposes because it is better to reject susceptible clones than maintaining them for further selection, when they are erroneously classified as resistant.
Other authors, who tested these markers, also con-cluded that the allelic association of marker 57R with the H1 resistant gene is stronger than that of marker TG689 (Shultz et al. 2012). Furthermore, the use of marker TG689 requires additional internal control for successful PCR, which increases the cost of the reaction.
[image:5.595.64.290.113.239.2]The cost of using a molecular marker is another important factor. The cost of applying MAS compared to conventional selection varies considerably among studies. Dreher et al. (2003) indicated that the cost effectiveness should be considered in individual cases. Factors that influence the cost of using mark-ers include inheritance of the trait and method of phenotypic evaluation (field/greenhouse and labour costs). If visual inspection in the field is sufficient for identifying segregating materials, conventional breeding methods can be very cost-effective (Dreher et al. 2002). However, in other cases, expensive and time-consuming phenotypic assays make the use of markers a more advisable method of selection. The Table 6. Clones with and without a marker and their general
qualitative assessment
Marker and its presence
General qualitative
assessment Total Fisher exact test P value positive negative
TG689
+ 77 184 261
0.68
– 23 63 86
total 100 247 347
57R
+ 77 179 256 0.42
– 23 68 91
total 100 247 347
Table 7. Costs of applying each of the tested markers com-pared with the costs of phenotypic evaluation of resistance to pathotype Ro1 of G. rostochiensis
Type of evaluation Cost per genotype (€)
Marker TG689 3.27
57R 3.25
Phenotypic evaluation 10–67.51
1the lower value corresponds to one-year evaluation in the
[image:5.595.64.291.647.705.2]comparison of MAS costs with the costs of phenotypic evaluation of nematode resistance in potato breeding programs in Poland presented here clearly shows that the use of markers is cheaper. Similar conclusions were drawn by Ortega and Lopez-Vizcon (2012) and Slater et al. (2013). Additionally using a multiplex PCR technique can significantly reduce the marker assay cost (Mori et al. 2011).
Equally important is the stage of breeding in which molecular markers will be used. At early stages, selection of desirable individuals is difficult, because a low number of plants per genotype prevents accurate evaluation of tuber yield and its components and leads to poor repeat-ability of yield assessments among the first generations. This also refers to traits less affected by environmental influences (Gopal 2006). Laboratory evaluations of resistance are of course less affected by environmen-tal factors, but at early stages of potato breeding they cannot be performed due to an insufficient amount of plant material for testing. Molecular markers could be used already at the seedling stage. However, a serious limitation to applying MAS at the seedling stage is the possibility that a large number of genotypes without positive marker results could be rejected, despite their potential possession of combination of other important characters that would make them a successful cultivar. In starch potato breeding, selection is based primarily on the starch yield. Resistance to nematodes is also very important for starch potato, because of intensive starch potato production with very limited crop rota-tion applied by starch potato growers. Some QTLs for tuber starch content are located on potato chromosome V (Shäfer-Pregl et al. 1998), like the H1 resistance gene. However, in our study, starch content did not vary between groups of clones indicating no association between the presence of markers of H1 gene and this trait. Clones that had these markers had significantly higher tuber and starch yield.
The negative relationship between marker presence and quality was not observed. Therefore, we conclude that marker-assisted selection of H1 gene at early gen-erations does not influence phenotypic selection.
Acknowledgements. This work was supported by the Pro-jects No. BH 4-3-00-7-02 and PB 4-3-00-6-02 of the Ministry of Agriculture and Rural Development of Poland.
References
Barone A. (2004): Molecular marker-assisted selection for potato breeding. American Journal of Potato Research,
81: 111–117.
Biryukova V.A., Zhuravlev A.A., Abrosimova S.B., Kostina L.I., Khromova L.M., Shmyglya I.V., Mo-rozova N.N., Kirsanova S.N. (2008): Use of molecular markers of potato golden nematode resistance genes H1 and GRO1. Russian Agricultural Sciences, 34: 365–368. Brown C.R, Kim T.S., Ganga Z., Haynes K., De Jong D.,
Jahn M., Paran I., De Jong W. (2006): Segregation of total carotenoid in high level potato germplasm and its relationship to beta-carotene hydroxylase polymorphism. American Journal of Potato Research 83: 365–372. Dalamu, Bhardwaj V., Umamaheshwari R., Shrama R.,
Kaushik S.K., Joseph T.A., Singh B.P., Gebhardt C. (2012): Potato cyst nematode (PCN) resistance: genes, genotypes and markers – an update. SABRAO Journal of Breeding and Genetics, 44: 202–228.
Dreher K., Morris M., Khairallah M., Ribaut J., Pan-dey S., Srinivasan G. (2002): Is marker-assisted selec-tion cost-effective compared with convenselec-tional plant breeding methods? The case of quality protein maize. In: Evenson R.E., Santaniello V., Ziberman D. (eds): Economic and Social Issues in Agricultural Biotechnol-ogy. CABI Publishing, New York, 203–236.
Dreher K., Khairallah M., Ribaut J., Morris M. (2003): Money matters (I): Costs of field and laboratory proce-dures associated with conventional and marker-assisted maize breeding at CIMMYT. Molecular Breeding, 11: 221–234.
Evans K., Stone A.R. (1977): A review of the distribution and biology of the potato cyst nematodes Globodera rostochiensis and G. pallida. Proceedings of the National Academy of Sciences of the United States of America,
23: 178–189.
Finkers-Tomczak A., Bakker E., de Boer J., van der Vossen E., Achenbach U., Golas T., Suryaningrat S., Smant G., Bakker J., Goverse A. (2011): Comparative sequence analysis of the potato cyst nematode resistance locus H1 reveals a major lack of co-linearity between three haplotypes in potato (Solanum tuberosum ssp.). Theoretical and Applied Genetics, 122: 595–608. Galek R., Rurek M., De Jong W.S., Pietkiewicz G.,
Augustyniak H., Sawicka-Sienkiewicz E. (2011): Application of DNA markers linked to the potato H1 gene conferring resistance to pathotype Ro1 of Globodera rostochiensis. Journal of Applied Genetics, 52:407–411. Gebhardt C. (2013): Bridging the gap between genome
analysis and precision breeding in potato. Trends in Genetics, 29: 248–256.
Gopal J. (2006): Considerations for successful breeding. In: Gopal J., Khurana S.M.P. (eds): Handbook of Potato Production, Improvement, and Postharvest Management. Food Products Press, Binghamton, 77–108.
Holgado R., Magnusson C. (2010): Management of PCN (Globodera spp.) populations under Norwegian condi-tions. Aspects of Applied Biology, 103: 83–92.
Karelov A.V., Pylypenko L.A., Kozub N.O., Bon-dus R.O., Borzykh O.I., Sozinov I.A., Blume Ya.B., Sozinov A.A. (2013): Allelic state of the molecular marker for golden nematode (Globodera rostochiensis) resistance gene H1 among Ukrainian and world potato (Solanum tuberosum ssp. tuberosum) cultivars. Cytology and Genetics, 47: 294–297.
Milczarek D., Flis B., Przetakiewicz A. (2011): Suit-ability of molecular markers for selection of potatoes resistant to Globodera spp. American Journal of Potato Research, 88: 245–255.
Mori K., Sakamoto Y., Mukojima N., Tamiya S., Na-kao T., Ishii T., Hosaka K. (2011): Development of a multiplex PCR method for simultaneous detection of di-agnostic DNA markers of five disease and pest resistance genes in potato. Euphytica, 180: 347–355.
Niewöhner J., Salamini F., Gebhardt C. (1995): Devel-opment of PCR assays diagnostic for RFLP marker alleles closely linked to alleles Gro1 and H1, conferring resist-ance to the root cyst nematode Globodera rostochiensis in potato. Molecular Breeding, 1: 65–78.
OEPP/EPPO (2006): Phytosanitary procedures: Testing of potato varieties to assess resistance to Globodera ros-tochiensis and Globodera pallida. OEPP/EPPO Bulletin 36, 419–420.
Oerke E.C. (2006): Crop losses to pests. Journal of Agri-cultural Science, 144: 31–43.
Ortega F., Lopez-Vizcon C. (2012): Application of mo-lecular marker assisted selection (MAS) for disease resist-ance in a practical potato breeding programme. Potato Research, 55: 1–13.
Schultz L., Cogan N.O.I., McLean K., Dale M.F.B., Bryan G.J., Forster J.W., Slater A.T. (2012): Evaluation and implementation of a potential diagnostic molecular marker for H1-conferred potato cyst nematode resist-ance in potato (Solanum tuberosum L.). Plant Breeding,
131: 315–321.
Shäfer-Pregl R., Ritter E., Concilio L., Hesselbach J., Lovatti L., Walkemeier B., Thelen H., Salamini F., Gebhardt C. (1998): Analysis of quantitative trait loci (QTLs) and quantitative trait alleles (QTAs) for potato tuber yield and starch content. Theoretical and Applied Genetics, 97: 834–846.
Slater A.T., Cogen N.O.I., Forster J.W. (2013): Cost analysis of the application of marker-assisted selection in potato breeding. Molecular Breeding, 32: 299–310. Sobczak M., Avrova A., Jupowicz J., Phillips M.S.,
Ernst K., Kumar A. (2005): Characterization of suscep-tibility and resistance responses to potato cyst nematode (Globodera spp.) infection of tomato lines in the absence and presence of the broad-spectrum nematode resist-ance Hero gene. Molecular Plant-Microbe Interactions,
18: 158–168.
Zgórska K. (2001): Determination of starch in potato tu-bers. In: Zimnoch-Guzowska E., Syller J., Sieczka M. (eds): The Methods of Evaluation and Selection Applied in Potato Research and Breeding. Plant Breeding and Acclimatization Instytute, Radzików, 111–114.
Received for publication May 20, 2014 Accepted after corrections September 29, 2014
Corresponding author: