CONTENTS
ORIGINAL PAPERS
Genetics and Breeding
VESELÁZ., PŘIBYL J., ŠAFUS P., VOSTRÝ L., ŠEBA K., ŠTOLC L.: Breeding value for type traits
in beef cattle in the Czech Republic ... 385 KATANOS J., SKAPETAS B., LAGA V.: Machine milking ability and milk composition of some
imported dairy goat breeds and some crosses in Greece ... 394
Nutrition and Feeding
TŘINÁCTÝ J., RICHTERM., HOMOLKA P., RABIŠKOVÁ M., DOLEŽAL P.: Comparison of the apparent and true digestibility of nutrients determined in dairy cows either by the nylon capsule or
in vivo method ... 402 ZELENKA J., ČEREŠŇÁKOVÁ Z.: Effect of age upon digestibility of starch in chickens with different
growth rate ... 411 SIMONOVÁ M., LAUKOVÁ A., ŠTYRIAK I.: Enterococci from rabbits – potential feed additive ... 416
Animal Products
ROSOCHACKI S.J., SAKOWSKI T., JUSZCZUK-KUBIAK E., BUTAREWICZ A., POŁOSZYNOWICZ J.: Cathepsin involvement in muscle proteolysis in meat-type bulls ... 422
Ecology
RYŠLAVÁ H., JANATOVÁ M., ČALOUNOVÁ G., SELICHAROVÁ I., BARTHOVÁ J., BARTH T.: Separation
Papers coming in future issues
of the Czech Academy of Agricultural Sciences
Journals
C
ZECHJ
OURNAL OFA
NIMALS
CIENCEComparison of long-term selection responses of breeding policy in dairy herds
ŠAFUS P., PŘIBYL J.
A comparison of passage parameters of nylon capsules and digesta calculated from faecal excretion data obtained in lactating cows
TŘINÁCTÝ J., RICHTER M., POZDÍŠEK J., KOWALSKI Z.M., FAJMONOVÁ E.
Effect of microbial oil, monensin and fumarate on rumen fermentation in artificial rumen JALČ D., ČERTÍK M.
Restoration of a river backwater and its influence on fish assemblage
HOHAUSOVÁ E., JURAJDA P.
Influence of the lecithin emulgator on the exploitation of nutrients and growth of piglets after weaning
DANĚK P., PASEKA A., SMOLA J., ONDRÁČEK J., BEČKOVÁ R., ROZKOT M.
Beef cattle production in the Czech Republic is a relatively new industry that has expanded since 1990. In total, twelve beef cattle breeds and their crosses are kept in the Czech Republic. Breeding value for the results of field test in beef cattle (calv-ing ease, birth weight and live weight at the age of 120, 210 and 365 days) has been evaluated by a multi-trait animal model since 2000 (Přibyl et al., 2003). In 2004 estimation of breeding value for the own growth of beef bulls at performance-test sta-tions was introduced (Přibylová et al., 2004; Přibyl et al., 2004).
Evaluation of the type is an integral part of cattle breeding. Objective evaluation of the type in beef cattle is significantly related with the expression of
meat performance. An evaluation method is given in methodical instructions for the description and evaluation of the type of beef cattle by Czech Beef Cattle Association (ČSCHMS, 1996).
Scientific papers pay great attention to the meth-od of linear evaluation of the type of dairy cattle (Thomson et al., 1981; Brotherstone et al., 1990) and to its relation to production traits (Meyer et al., 1987; Brotherstone, 1994; Veerkamp and Brotherstone, 1997; Royal et al., 2002) and lon-gevity (Setatti et al., 2004). Genetic parameters for type traits in Czech Piek cattle (dual-purpose type) were estimated by Bouška et al. (1991). The analy-sis of correlations between type traits of cows and their production traits, considered as important
Breeding value for type traits in beef cattle
in the Czech Republic
Z. VESELÁ
1, J. PŘIBYL
1, P. ŠAFUS
1, L. VOSTRÝ
1, K. ŠEBA
2, L. ŠTOLC
31Research Institute of Animal Production, Prague-Uhříněves, Czech Republic 2Czech Beef Cattle Association, Prague, Czech Republic
3Czech Agricultural University, Prague, Czech Republic
ABSTRACT: The type was evaluated in 5 424 young animals of twelve beef breeds. Ten type traits were evaluated: height at sacrum (HS), body length (BL), live weight (LW), front chest width (CW), chest depth (CD), pelvis (P), shoulder muscling (SM), back muscling (BM), rump muscling (RM) and production type (PT). The traits repre-sent two groups: (1) traits scoring body measurements and body capacity (HS, BL, LW, CW, CD, P) and (2) traits scoring muscling (SM, BM, RM, PT). These fixed effects were included in the model: breed, sex, HYS, mother’s age, linear regression on age at evaluation and average gain from birth to evaluation. Fixed effects in the model explained 40% to 60% of variability. The highest values of heritability coefficient were estimated for HS (h2 = 0.51) and LW (h2 = 0.50). BL had the lowest values of heritability coefficient (h2 = 0.25). The valuesh2 = 0.25–0.32 were calculated
for the traits scoring body capacity (CW, CD, P). The range of values for muscling traits was h2 = 0.26–0.35. The
coefficient of heritability for PT was h2 = 0.34. All traits scoring muscling and PT showed high genetic
correla-tions (rg > 0.95). The traits scoring body capacity (P, CW, CD) were highly genetically correlated with muscling rg > 0.83. Breeding values were determined by a multi-trait animal model. Standard deviations of breeding values were higher in HS (sBV = 0.71) and LW (sBV = 0.84), which was connected with a different method of evaluation of these traits. They were in the range of 0.19 (BL) to 0.30 (RM) in the other traits.
Keywords: animal model; beef cattle; breeding value; genetic correlation; heritability; type traits
386
Original Paper Czech J. Anim. Sci., 50, 2005 (9): 385–393
background data for effective selection in Czech Fleckvieh cattle, was carried out by Bouška et al. (1999). Evaluation of the type in beef cattle is pre-sented in literature less frequently. Gutiérrez and Goyache (2002) estimated genetic parameters in the beef cattle breed Asturiana de los Valles. They estimated genetic parameters for 10 type traits. They divided the traits into two groups: (1) traits scoring skeletal and muscular development and (2) traits scoring adjustment to the breed standard. Vági (1997) evaluated 27 type traits in Hungarian beef cattle by factor analysis. The relationship be-tween the type and longevity in beef cattle was ex-amined by Forabosco et al. (2004). Gutiérrez et al. (2002) studied genetic relationships between ma-jor reproductive traits in beef cattle (calving date, calving interval and age at first calving) and type traits in order to evaluate the usefulness of type classification in predicting reproductive perform-ance in beef cattle.
The objective of this paper was to estimate ge-netic parameters and breeding values for type traits of young animals of beef cattle breeds in the Czech Republic.
MATERIAL AND METHOD
In the Czech Republic beef cattle are evaluated according to methodical instructions for the de-scription and evaluation of the type of beef breeds of cattle developed by the Czech Beef Cattle Association (ČSCHMS, 1996). Evaluation is based on the scoring of an evaluated trait by 1 (minimum) to 10 (maximum) points within the biological ex-tremes of evaluated breed. Evaluating the scored traits, the classifier takes into account the popula-tion mean of evaluated breed and approved breed standard. Therefore the expression of the scoring scale for body traits according to the particular breeds is quite specific. The evaluation of the type involves 10 traits: height at sacrum – HS (meas-ured with a measuring staff), body length – BL, live weight – LW (determined by the weighing of the animal), front chest width – CW (width of the chest base between the front legs front view), chest depth – CD (chest depth behind the blade), pelvis – P (pelvis length and width), shoulder muscling – SM, back muscling – BM, rump muscling – RM and production type – PT (overall thoroughbredness, harmony of body conformation and sex expres-sion). A majority of traits is evaluated subjectively.
Height at sacrum and live weight are determined by measuring and weighing, and conversion tables are used to obtain their point scoring while age, sex and breed are respected.
Available were 5 424 records of young animals (de-scendants of 586 sires) of 12 beef breeds and cross-es with dairy and dual-purpose breeds (Aberdeen Angus – 1 156, Belgian Blue-White – 34, Blonde d’Aquitaine – 205, Galloway – 13, Gasconne – 34, Hereford – 496, Highland – 5, Charolais – 1 787, Limousine – 567, Beef Simmental – 970, Piemontese – 144, Salers – 13) evaluated at the age from 180 to 519 days. 84% of the evaluated individuals were purebred animals or with the proportion of beef breed higher than 88%. The other individuals were products of crossing with a higher proportion of beef breeds (at least 50%). The animals were evalu-ated at the time of weaning at the end of grazing season by one of nine classifiers or by a commis-sion at performance-test stations of beef bulls (64 bulls).
Breeding values and genetic parameters were es-timated by a multi-trait animal model.
REMLF90 programme (Misztal, 2002) was used to estimate genetic parameters. After omitting the groups with small numbers of contemporaries and individuals that did not have any sibs in the evaluat-ed set, the sample size for the estimation of genetic parameters was 5 128 individuals with the evalu-ated type. The total sample size (including three generations of ancestors) was 12 749 individuals.
A total of 17 030 individuals including 4 generations of ancestors was used in the estimation of breeding value. BLUPF90 programme (Misztal, 2002) was used for the estimation of breeding value.
To estimate genetic parameters and breeding value the traits were divided into two groups: (1) traits scoring body measurements and body ca-pacity (height at sacrum, body length, live weight, front chest width, chest depth and pelvis) and (2) traits scoring muscling and overall type (shoulder muscling, back muscling, rump muscling and pro-duction type).
For the first group of traits this model equation was used:
yijkl = µ + HYSi + Sj + AMk + aAEijkl + gijkl + eijkl (1)
For the second group of traits this model equa-tion was used:
where: yijk(l) = evaluation of the trait
µ = population mean
HYSi = fixed effect of the group of jointly
evalu-ated animals (herd, year, season)
Sj = fixed effect of the sex of the animal
(young bulls, heifers/twins, singles)
AMk = fixed effect of the age of mother at
calv-ing (younger than three years, four years old, five to seven years old, older than seven years and embryo recipients)
aAEijk(l) = regression on age at evaluation bDGijk = linear regression on average daily gain
from birth to the date of evaluation
gijk(l) = breeding value of the animal (random effect) – with the relationship matrix and genetic groups according to the breed
eijk(l) = random error
RESULTS AND DISCUSSION
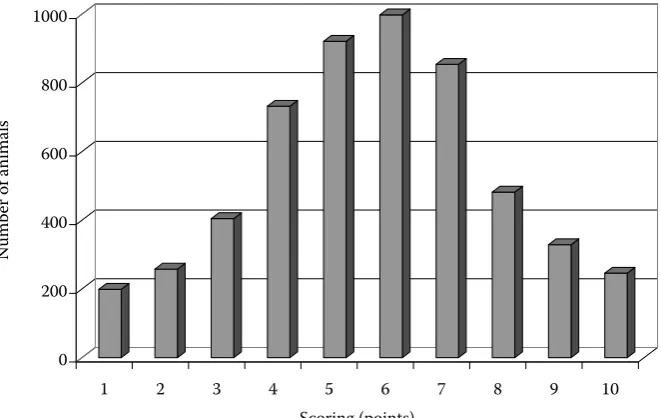
Table 1 shows basic statistical characteristics of the evaluated type traits. Standard deviations of the scoring of height at sacrum (s = 2.17) and live weight (s = 2.65) were higher than standard devia-tions of the scoring of other traits (s = 0.97–1.13). It was a result of different methods of evaluation. Height at sacrum and live weight were determined by objective methods (measuring and weighing) and converted to scores according to a conversion table taking into account age, sex and breed. The others traits were evaluated subjectively by a classifier. Figure 1 shows frequencies of distribution accord-ing to height at sacrum scoraccord-ing. It was flat normal distribution. The classes of the extremes (scores 1
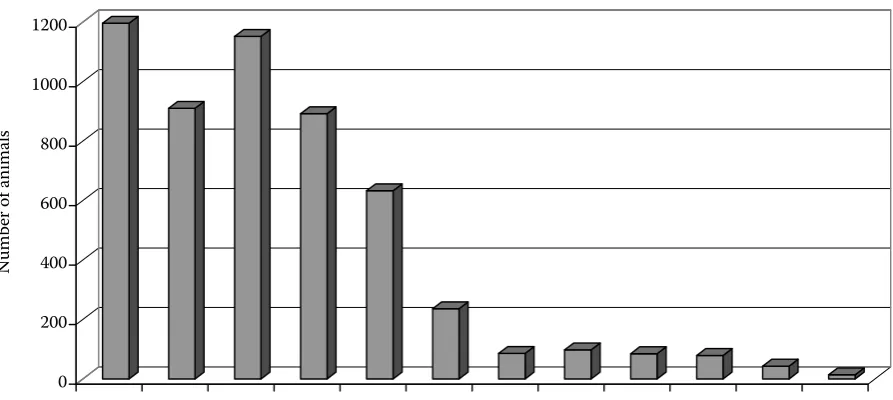
and 10) comprised a high number of individuals. On the contrary, the results of live weight did not show normal distribution (Figure 2). Most animals received higher scores in live weight evaluation. In both these traits (HS, LW) the whole scale from 1 to 10 was used for scoring. Figure 3 illustrates frequencies of distribution according to produc-tion type scoring. Scores from 2 to 9 were used for this evaluation and the results showed normal distribution. Similar distribution was found out in the other traits evaluated subjectively.
Figure 4 documents numbers of animals accord-ing to age at evaluation. A majority of the evaluated animals were at the age of 330 days and younger.
SAS/GLM procedure (SAS, 2004) was applied to test several models that included these fixed
ef-Table 1. Basic statistical characteristics of evaluated traits
Evaluated
trait Mean s Min Max
HS 5.66 2.17 1 10
BL 6.49 0.97 2 9
LW 6.76 2.65 1 10
CW 5.75 0.99 2 9
CD 6.19 0.98 2 9
P 5.81 0.99 2 9
SM 5.59 0.97 2 9
BM 5.76 0.98 2 9
RM 5.83 1.13 2 9
PT 5.84 1.13 2 9
0 200 400 600 800 1000
N
um
be
r o
f a
ni
m
al
s
1 2 3 4 5 6 7 8 9 10
[image:5.595.302.534.114.302.2]Scoring (points)
[image:5.595.68.399.543.752.2]388
Original Paper Czech J. Anim. Sci., 50, 2005 (9): 385–393
fects: sex, group of contemporaries (jointly evalu-ated animals), mother’s age, class of evaluation age (1–10 according to age at evaluation), linear or quadratic regression on age at evaluation and lin-ear regression on average daily gain from birth to evaluation. It was not possible to include the effect of classifier because it overlapped with the effect of the group of contemporaries (HYS). As shown in Table 2, fixed effects in models (1) and (2) ex-plained 40–60% of variability. The group of jointly evaluated animals (HYS) was the most important effect as it explained 28–35% of variability. This ef-fect involves several influences afef-fecting the whole group of animals. All included effects (HYS, sex, mother’s age, age at evaluation, gain from birth to evaluation) were statistically significant. The same
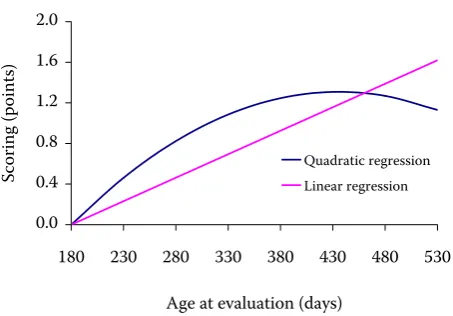
effects as in models (1) and (2) were included in another suitable model but it comprised quadratic regression on age at evaluation. Fixed effects in this model explained approximately the same variabil-ity as models (1) and (2) in HS, LW, CW and SM. In CD, P and BM it explained by 1% of variability more and in BL, RM and PT by 2% more. Figure 5 shows the regression line and curve of production type scoring in relation to the age of evaluation of the animal. The graph was constructed on the basis of regression coefficients estimated by animal model. The other type traits had a similar course of regression. It is obvious from the figure that the quadratic regression curve has an almost linear course approximately until the age of 330 days. As the type of young cattle was evaluated mostly in 0
200 400 600 800 1000
Number
of
animal
1 2 3 4 5 6 7 8 9 10
Scoring (points)
0 500 1000 1500 2000 2500
N
um
be
r o
f a
ni
m
al
1 2 3 4 5 6 7 8 9 10
[image:6.595.66.382.85.289.2]Scoring (points)
Figure 2. Frequencies according to scoring of weight
[image:6.595.64.402.539.749.2]tions for height at sacrum (σg = 1.27, σe = 1.25) and live weight (σg= 1.58, σe = 1.60) are markedly higher; it is a result of different method of evalua-tion of these two traits.
Coefficients of heritability h2, phenotypic
cor-relations rp and genetic correlations rg calculated from the model with linear regression on age at evaluation are given in Table 4.
The highest values of heritability coefficient (on the diagonal) were calculated for height at sac-rum (h2 = 0.51) and live weight (h2 = 0.50), but these characteristics do not have a very suitable distribution of frequencies. On the contrary, body length had the lowest values of heritability coef-ficient (h2 = 0.25). The coefficients of heritability for traits scoring the body capacity (CW, CD, P) ranged from h2 = 0.27 (CW) to h2 = 0.31 (P) and h2 = 0.32 (CD). As for the traits of muscling, the highest values h2 were found out for shoulder and 0
200 400 600 800 1000 1200
N
um
be
r o
f a
ni
m
al
s
180–190 190–210 210–240 240–270 270–300 300–330 330–360 360–390 390–420 420–450 450–480 480–518
[image:7.595.75.522.84.284.2]Age at evaluation (days)
Table 3. Standard deviations substituted into the estima-tion of breeding values
σg σe σg σe
HS 1.27 1.25 P 0.46 0.68
BL 0.41 0.71 SM 0.46 0.63
LW 1.58 1.60 BM 0.40 0.68
CW 0.44 0.71 RM 0.52 0.71
[image:7.595.63.293.553.758.2]CD 0.48 0.69 PT 0.53 0.73
Table 2. Variability explained by fixed effects in total and by the effect of group of contemporaries – HYS (%) in a selected model with linear regression on age at evalua-tion (Model 1) and in a model with quadratic regression on age at evaluation (Model 2)
Model 1 Model 2
total HYS total HYS
HS 48 35 48 35
BL 40 34 42 35
LW 44 35 44 35
CW 42 35 42 35
CD 40 35 41 35
P 43 33 44 33
SM 57 28 57 28
BM 56 29 57 30
RM 57 28 59 30
PT 60 29 61 30
animals younger than 330 days (Figure 1), models (1) and (2) involving linear regression were chosen for routine evaluation. Tables 3 and 4 show genetic parameters for models with linear regression on age at evaluation.
Table 3 shows estimated standard deviations (σg, σe) that were then substituted into the calculation of breeding values. The estimated standard
[image:7.595.299.532.654.758.2]390
Original Paper Czech J. Anim. Sci., 50, 2005 (9): 385–393
rump muscling (h2 = 0.35) while the value h2 for back muscling was lower (h2 = 0.26). A total char-acteristic – production type reached the values of heritability coefficient h2 = 0.34.
The calculated values of heritability coefficient correspond to data of other authors. Bouška et al. (1999) reported h2 = 0.41 for muscling and 0.34 for chest depth in Czech Fleckvieh cattle. Lower coefficients of heritability for muscling were given by Vukašinovič et al. (1994) in Swiss Brown cat-tle (0.15). In Hungarian beef catcat-tle Vági (1997) re-ported markedly higher coefficients of heritability for body length (0.70), chest depth (0.63), shoulder muscling (0.71), back muscling (0.44) and rump muscling (0.76). But Vági used a different method to estimate genetic parameters – factor analysis.
0.0 0.4 0.8 1.2 1.6 2.0
180 230 280 330 380 430 480 530
Age at evaluation (days)
Sc
or
in
g
(p
oi
nt
s)
[image:8.595.65.292.84.242.2]Quadratic regression Linear regression
Table 4. Coefficients of heritability h2 (on the diagonal), genetic r
g (above the diagonal) and phenotypic rp (below the diagonal) correlations calculated from the model with linear regression on age at evaluation
HS BL LW CW CD P SM BM RM PT
HS 0.51 0.70 0.72 0.27 0.28 0.25 0.20 0.17 0.09 0.24
BL 0.43 0.25 0.46 0.56 0.56 0.59 0.55 0.54 0.39 0.51
LW 0.54 0.39 0.50 0.53 0.51 0.44 0.38 0.41 0.37 0.43
CW 0.28 0.44 0.42 0.27 0.96 0.92 0.95 0.95 0.91 0.93
CD 0.27 0.42 0.41 0.59 0.32 0.89 0.87 0.89 0.83 0.87
P 0.26 0.43 0.42 0.64 0.58 0.31 0.92 0.95 0.92 0.92
SM 0.21 0.39 0.36 0.67 0.59 0.68 0.35 0.98 0.95 0.96
BM 0.20 0.38 0.37 0.62 0.57 0.67 0.69 0.26 0.98 0.96
RM 0.17 0.34 0.36 0.60 0.56 0.73 0.72 0.72 0.35 0.96
PT 0.26 0.42 0.42 0.66 0.62 0.74 0.75 0.74 0.87 0.34
The highest phenotypic correlations were deter-mined between the traits of muscling (SM, BM, RM) and production type (rp = 0.69–0.87). The lowest phenotypic correlations with most traits, particularly with muscling traits (rp = 0.17–0.21), were calculated for height at sacrum.
The highest genetic correlations (rg) were found out between back muscling and shoulder muscling, and between back muscling and rump muscling (rg = 0.98). Production type was in high genetic correlations with almost all scored characteristics except height at sacrum (rg = 0.24), body length (rg = 0.43) and live weight (rg = 0.51). It showed the highest correlations with all three traits of mus-cling – SM, BM, RM (rg = 0.96), chest width (rg = 0.93), pelvis (rg = 0.92) and chest depth (rg = 0.87). There existed high genetic correlations of all traits describing muscling of the animal with production type (rg > 0.95). We also calculated high genetic correlations of muscling with the traits describing body capacity – pelvis shape (rg > 0.92), chest width (rg> 0.91) and chest depth (rg > 0.83).
Table 5 shows coefficients of heritability h2,
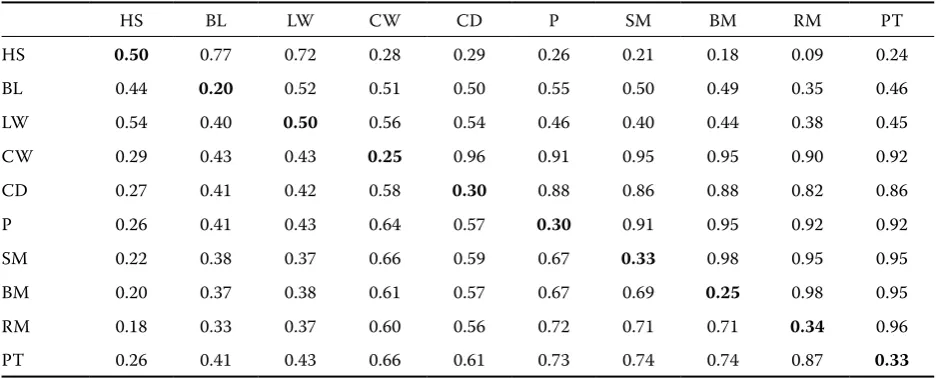
phe-notypic correlations rp and genetic correlations rg calculated from models with quadratic regression on age at evaluation. If quadratic regression on age at evaluation was used, coefficients of heritability of almost all traits were lower than with linear regres-sion. Coefficient of heritability for live weight was identical (h2 = 0.50). Body length had a markedly lower coefficient of heritability (lower by 0.05). In the other traits the difference between the
[image:8.595.64.535.568.758.2]Table 5. Coefficients of heritability h2 (on the diagonal), genetic r
g (above the diagonal) and phenotypic rp (below the diagonal) correlations calculated from the model with quadratic regression on age at evaluation
HS BL LW CW CD P SM BM RM PT
HS 0.50 0.77 0.72 0.28 0.29 0.26 0.21 0.18 0.09 0.24
BL 0.44 0.20 0.52 0.51 0.50 0.55 0.50 0.49 0.35 0.46
LW 0.54 0.40 0.50 0.56 0.54 0.46 0.40 0.44 0.38 0.45
CW 0.29 0.43 0.43 0.25 0.96 0.91 0.95 0.95 0.90 0.92
CD 0.27 0.41 0.42 0.58 0.30 0.88 0.86 0.88 0.82 0.86
P 0.26 0.41 0.43 0.64 0.57 0.30 0.91 0.95 0.92 0.92
SM 0.22 0.38 0.37 0.66 0.59 0.67 0.33 0.98 0.95 0.95
BM 0.20 0.37 0.38 0.61 0.57 0.67 0.69 0.25 0.98 0.95
RM 0.18 0.33 0.37 0.60 0.56 0.72 0.71 0.71 0.34 0.96
PT 0.26 0.41 0.43 0.66 0.61 0.73 0.74 0.74 0.87 0.33
mated coefficients of heritability was 0.01 to 0.02. Genetic correlations (rg) and phenotypic correla-tions (rp) were not markedly different compared to the model with linear regression on age at evalua-tion. HS and LW were in close genetic correlations with the other traits. On the other hand, genetic correlations were lower in BL.
Animal model provided the results shown in Tables 6–9.
[image:9.595.62.536.341.444.2]Table 6 documents the effect of calf sex on the type evaluation in comparison with single bulls. Mainly the effect of twins is expressed. The effect of sex is less marked because classifiers take it into account already in the evaluation of animals. In almost all traits bulls and heifers from twins receive lower scores than single bulls and heifers. Higher deviations were found out in height at sacrum and live weight, which is connected with the above-mentioned method of evaluation and distribution of frequencies.
Table 7 shows the effect of mother’s age on the results of evaluation of traits scoring body
meas-Table 6. The effect of calf sex (comparison with single bulls)
Twin bulls Single heifers Twin heifers Twin bulls Single heifers Twin heifers
HS –0.81 1.24 0.09 P –0.23 –0.08 –0.50
BL –0.25 –0.01 –0.36 SM –0.29 –0.06 –0.56
LW –1.40 –0.77 –1.41 BM –0.36 –0.05 –0.51
CW –0.29 –0.09 –0.50 RM –0.23 –0.07 –0.47
CD –0.34 –0.02 –0.53 PT –0.29 –0.04 –0.52
urements and body capacity. The highest scores in most traits were determined in calves after five- to seven-years old mothers and after mothers seven years old and older.
Table 8 presents regression coefficients of age at evaluation (in years) and of weight gain from the date of birth to evaluation (in kg). Age at evalua-tion influenced to the largest extent the scoring of
Table 7. The effect of age of mother at calving (com-parison with three-year mothers and younger)
Four years old
Five to seven years old
Eight years old and older
HS 0.60 0.96 0.79
BL 0.12 0.15 0.16
LW 0.50 1.14 0.92
CW 0.07 0.10 0.08
CD 0.07 0.12 0.10
[image:9.595.303.534.625.756.2]392
[image:10.595.65.532.102.154.2]Original Paper Czech J. Anim. Sci., 50, 2005 (9): 385–393
Table 8. Regression on age at evaluation (years) and weight gain from birth to evaluation (kg)
HS BL LW CW CD P SM BM RM PT
Age at evaluation 0.53 1.44 –1.76 1.66 1.61 1.43 1.66 1.60 1.39 1.69
Weight gain 0.79 0.66 0.78 0.68
live weight (–1.76), production type (+1.69), chest width (+1.66) and shoulder muscling (+0.66). The scoring of height at sacrum was influenced to the smallest extent (+0.53). The relatively markedly different regression coefficients of live weight and height at sacrum are probably influenced by a dif-ferent method of evaluation from that applied to the other traits. Classifiers consider the effect of age already at the moment of evaluation, nevertheless it is obvious from these regression coefficients that they tend to overestimate older animals in most traits.
Weight gain from birth to the date of evaluation was taken into account in traits scoring muscling (SM, BM, RM) and PT. Regression coefficients were in the range of 0.66 to 0.79 scores per 1 kg weight gain. Weight gain had the lowest effect on back muscling (0.66), on production type (0.68), rump muscling (0.78) and shoulder muscling (0.79).
Standard deviations, minimum and maximum values of breeding values are shown in Table 9. Standard deviations of breeding values were higher
in height at sacrum (sBV = 0.71) and live weight (sBV = 0.84). In the other traits standard deviations ranged from 0.19 (BL) to 0.30 (RM). Intrabreed standard deviations were determined by a linear model by one-factor analysis (GLM/SAS procedure). The ef-fect of breed was statistically significant in all traits, but it explained relatively low variability (from 7% to 13%). As shown in the table, intrabreed standard deviations were only a little lower than standard deviations of breeding values including interbreed differences. It is caused by the effect of classifiers again who consider interbreed differences already during the evaluation of animals.
CONCLUSION
We constructed a model for routine estimation of breeding value for a description of the type of young animals of beef cattle. If a majority of ani-mals under evaluation is younger than 11 months, it is possible to use a model with linear regression on age at evaluation; if the range of animal age is wider, it is suitable to apply a model with quad-ratic regression on age at evaluation. Deviations from normal distribution in the scoring of height at sacrum and live weight document that a differ-ent method of evaluation of these two traits should be used that would correspond with evaluation of the other traits. High genetic correlations between some evaluated traits show that the number of evaluated traits may be reduced in practice.
REFERENCES
Bouška J., Vacek M., Urban F. (1991): Analýza vlivu růz-ných faktorů na výsledky lineárního popisu exteriéru prvotelek. [Dílčí závěrečná zpráva.] VÚŽV, Praha-Uh-říněves.
Bouška J., Štípková M., Bartoň L., Jirmásek M. (1999): Genetic parameter estimates for linearly described traits and conformation evaluation of Czech Pied cat-tle (in Czech). Czech J. Anim. Sci., 44, 289–293. Table 9. Standard deviations, minimum and maximum
values of estimated breeding values and standard devia-tions of breeding values within the breeds
sBV
Min Max
across breeds within breeds
HS 0.71 0.66 –3.90 5.67
BL 0.19 0.18 –1.06 0.86
LW 0.84 0.80 –4.17 4.15
CW 0.23 0.22 –1.28 1.05
CD 0.24 0.23 –1.51 1.05
P 0.27 0.25 –2.64 1.36
SM 0.25 0.24 –1.27 1.30
BM 0.23 0.21 –1.64 1.32
RM 0.30 0.28 –2.17 1.59
[image:10.595.63.291.536.758.2]Brotherstone S. (1994): Genetic and phenotypic correla-tions between linear type traits and production traits in Holstein-Friesian dairy cattle. Anim. Prod., 59, 183– 187.
Brotherstone S., McManus Ch., Hill W.G. (1990): Estima-tion of genetic-parameters for linear and miscellaneous type traits in Holstein-Frisian dairy cattle. Livest. Prod. Sci., 26, 177–192.
ČSCHMS (1996): Metodika popisu a hodnocení zevnějšku masných plemen skotu. Český svaz chovatelů masného skotu, Praha. http://www.cschms.cz.
Forabosco F., Groent A.F., Bozzi R., Van Arendonk J.A.M., Filippini F., Boettcher P., Bijma P. (2004): Phenotypic relationships between longevity, type traits, and pro-duction in Chianina beef cattle. J. Anim. Sci., 82, 1572– 1580.
Gutiérrez J.P., Goyache F. (2002): Estimation of genetic parameters of type traits in Asturiana de los Valles beef cattle. J. Anim. Breed. Genet., 119, 93–100.
Gutiérrez J.P., Alvarez I., Fernandez I., Royo L.J., Diez J., Goyache F. (2002): Genetic relationship between calv-ing date, calvcalv-ing interval, age at first calvcalv-ing and type traits in beef cattle. Livest. Prod. Sci., 78, 215–222. Meyer K., Brotherstone S., Hill W.G., Edwards M.R.
(1987): Inheritance of linear type traits in dairy cattle and correlations with milk production. Anim. Prod., 44, 1–10.
Misztal I., Tsuruta S., Strabel T., Auvray B., Druet T., Lee D.H. (2002): BLUPF90 and related programs (BGF90). In: 7th WCGALP, August 19–23, Montpellier, France.
Přibyl J., Misztal I., Přibylová J., Šeba K. (2003): Multiple-breed, Multiple-traits evaluation of beef cattle in the Czech Republic. Czech J. Anim. Sci., 48, 519–532. Přibyl J., Vostrý L., Veselá Z., Přibylová J., Bohmanová J.
(2004): Odhad plemenné hodnoty býků v odchovnách.
In: Zborník referátov XVI. letná škola biometriky, 21.–25.6. Račkova dolina, Slovensko.
Přibylová J., Vostrý L., Veselá Z., Přibyl J., Bohmanová J. (2004): Breeding value for own growth of beef bulls in performance-test station. Anim. Sci. Pap. Rep., 2, 97– 103.
Royal M.D., Pryce J.E., Woolliams J.A., Flint A.P.F. (2002): The genetic relationship between commencement of luteal activity and calving interval, body condition score, production, and linear type traits in Holstein-Friesian dairy cattle. J. Dairy Sci., 85, 3071–3080. SAS (2004): SAS/STAT User’s Guide.
Setatti M.M., Norris D., Banga C.B., Benyi K. (2004): Re-lationships between longevity and linear type traits in Holstein cattle population of Southern Africa. Trop. Anim. Health Prod., 36, 807–814.
Thomson J.R., Freeman A.E., Wilson D.J., Chapin C.A., Berger P.J., Kuck A. (1981): Evaluation of linear type program in Holstein. J. Dairy Sci., 64, 1610–1617. Vági J. (1997): Utilisation of population genetic and
mul-tivariate methods in the evaluation of results of cattle type traits judgment. Acta Biol. Hung., 48, 105–112. Veerkamp R.F., Brotherstone S. (1997): Genetic
correla-tions between linear type traits, food intake, live weight and condition score in Holstein Friesian dairy cattle. Anim. Sci., 64, 385–392.
Vukašinovič N., Moll J., Künzi N. (1994): Analysis of type traits as predictor of longevity in Swiss Brows cattle: Genetic parameters and sire evaluation. In: 45th Ann.
Meet. EAAP, Edinburgh.
Received: 05–03–21 Accepted after corrections: 05–05–31
Corresponding Author
Ing. Zdeňka Veselá, Research Institute of Animal Production, P.O. Box 1, 104 01 Prague 114-Uhříněves, Czech Republic