Corrigendum
In the Research in Agricultural Engineering journal, the following paper was published:
Mizraee E., Rafiee S., Keyhani A., Emam-Djomeh Z., Kheiralipour K., 2009. Hydro-sorting of apricots based on some physical characteristic. 55(4): 159–164.
(Online at http: //www.agriculturejournals.cz/publicFiles/13312.pdf).
The original article was published in the Transactions of the ASAE journal five years ago:
Jordan R.B., Clark C.Y., 2004. Sorting of kiwifruit for quality using drop velocity in water. 47(6): 1991–1998.
Large sections of the original paper have been copied by the authors at the University of Tehran (Iran) word for word, without any indication that the material was quoted and without proper and sufficient citation.
The copied parts of the paper are therefore plagiarism and R.B. Jordan and C.Y. Clark are their rightful authors.
We apologize for this unfortunate matter to the authors of the original paper and to the Transactions of the ASAE journal (now called Transactions of the ASABE).
Editorial board
Electrical sizing mechanisms are overly expensive and mechanical sizing mechanisms react slowly (Tabatabaeefar & Rajabipour 2005). Also, fruit graders that employ near-infrared technologies are expensive and, more important, the calibration and maintenance they require tend to remain outside the skills of the packing house staff (Jordan & Clerk 2004).
Density, is a good indicator of fruit dry matter (Richardson et al. 1997; Jordan et al. 2000), thus becomes an interesting tool for the fruit qual-ity sorting because of its inherently lower cost and simpler operation. The sorting of products based on density is not new, patents and publications, in the potato industry for example, extend from 1950s to the present day (Kunkel et al. 1952; Wilson & Lindsay 1969; Bajema 2001). Other products (e.g., citrus fruits, blueberries, and tomatoes) have also been sorted by flotation techniques for quality or defects determination (Perry & Perkins 1968; Patzlaff 1980).
According to Jordan and Clerk (2004), an ap-proach to fruits sorting is to use the terminal velocity of fruit moving in a fluid that has a density above or below the target density. Fruits with different termi-nal velocities will reach different depths after flowing a fixed distance in a flume and may be separated by
suitably placed dividers. In this approach, water can be used as a sorting medium, which provides a great advantage in terms of the resulting low corrosion and disposal easiness, and in that it does not require any density adjustment. Additionally, this approach allows purely mechanical setting of the separation threshold by adjusting the divider positions while no change in the fluid density is required. Kheirali-pour (2008) studied the terminal velocities and ris-ing times of Redspar and Delbarstival apple varieties and reported that the apples reached their terminal velocity about 0.5 s after releasing, most fruits also showing little tendency to rotate and move in the horizontal direction.
The authors embarked on this study to test the dropping time of apricot fruits in a water column to find out if the potential exists for the dropping time methods utilisation in the sorting industry.
Material and Methods
dropping time measurement
Considering apricot fruits in water, the forces acting on the sample will be the gravitational force acting downward, buoyancy force acting upward, and drag force acting opposite to the direction of
hydro-sorting of apricots based on some physical
characteristics
e. Mirzaee
1, s. rafiee
1, a. Keyhani
1, Z. emam-djomeh
2, K. Kheiralipour
11
Department of Agricultural Machinery Engineering, Faculty of Agricultural Engineering
and Technology, University of Tehran, Karaj, Iran
2
Department of Food Science, Technology & Engineering, Faculty of Agricultural Engineering
and Technology, University of Tehran, Karaj, Iran
abstract: In this study, the dropping time of apricot fruits was followed experimentally using a water column. Some effective characteristics of apricots related to the dropping time were determined using standard methods. The best models for the dropping time of Nasiry, Rajabali, and Ghavami apricot varieties as a function of water and fruit densities, shape factor, and fruit volumes were executed with the determination coefficients of 0.95, 0.92, and 0.85, respectively. It was found that the differences between the fruits density minus the density of water had a major effect on their dropping time.
motion. The buoyancy and drag forces were cal-culated using the following equations, respectively (Crowe et al. 2001):
Fb = ρwvg (1)
Fd = 0.5ρwV 2CDAp (2) where:
Fb – buoyancy force (N)
ρw – water density (kg/m3)
v – fruit volume (cm3)
g – gravitational acceleration (m/s2)
Fd – drag force (N)
V – fruit velocity (m/s)
Ap – cross-sectional area of the fruit (cm2) which is
per-pendicular to the direction of motion
CD – drag coefficient which is a function of the fruit velocity
and can be modelled using Stokes’ law (Crowe etal. 2001):
24
CD = –––– (NR < 1) (3) NR
K
CD = ––––– (NR> 1) (4) NRn
and VD ρ
W
NR = –––––– (5)
µW
where:
µw – static viscosity of water (N.s/m2)
NR – Reynolds number (dimensionless)
K, n – constant factors
D – fruit diameter (mm)
The apricot fruit has NR> 1 in the water column (with means of 7428.18), therefore:
K3µWn
CD = ––––––––– (6)
VnDnρwn
Considering Newton,s second law, the combina-tion of these forces (gravitacombina-tional, buoyancy, and drag forces) accelerates the fruit proportionally to its mass (Crowe et al. 2001):
ma = Fw – Fd – Fb (7)
where:
Fw – gravitational force (N)
Substituting Fd and Fbfrom Eqs. (1) and (2) into Eq. (7) gives:
ma = mg – 0.5ρwV 2CDAp – ρwvg (8)
where:
m – fruit mass (g)
On the other hand, dividing Eq. (8) by m = vρf, gives:
ρW
a = g
(
1 – ––––)
– 0.5 ρWV 2CDAp/(vρf) (9) ρf
For a spherical object, A/v can be computed direct-ly as a function of the diameter, however, the apricot fruits are more hyper-ellipsoidal. By separating A/v
into two parts: a dimensionless shape factor (Sh), and the size (Jordan & Clerk 2004), the following relationship is obtained:
Ap Sh
–––– = ––––– =
[
Ap/v⅔]/[
v⅓]
(10)v size
and with diameter represented as: 6v ⅓
D = e
(
––––)
(11)π
where:
Sh – shape factor (dimensionless)
e – constant factor
Substituting CD, A/v and D from Eqs. (6), (10) and (11) into Eq. (9), gives:
ρw µn
w ρ 1–w( n) V(2–n)Sh
a = g
(
1 – –––)
– K1(
–––––––––––––––)
(12) ρfn+1
v (
3 )
ρf
When the apparent weight of a particle due to the gravitational force is equal to the drag and buoyancy forces, the particle comes at rest, and its maximum dropping velocity (terminal velocity) is reached (Crowe et al. 2001). Then, setting the acceleration to zero in Eq. (12), the terminal velocity (Vt) of the fruit becomes:
1 n+1 ––– –––– (ρf –ρw)
(
2–n)
v(
3(2–n))
V1 = K2–––––––––––––––––––– (13) n 1–n 1
––– ––– ––– µw
(
2– n)
ρw(
2–n)
Sh(
2–n)
Using the terminal velocity formula Eq. (13), one can estimate the time (Td) taken to reach the depth of X as:
X
Vt = –––– (14)
Td
and
1 –1 –n–1
––– ––– –––– Td = BX
[
Sh(
2–n)
(ρwhere:
Td – dropping time (s)
B – constant factor
The theory of KHAT 4 is derived by generalising Eq. (15) as (Kheiralipour 2008):
Td = A(ρf – ρw)b vc S h
d (16)
where:
A, b, c, d – the curve fitting parameters and take appropri-ate values
dropping time experiments
The twenty-five fruits of each Iranian apricot culti-var, that is Ghavami, Nasiry, and Rajabali, were trans-ferred to the laboratory in polyethylene bags to reduce the water loss during transport, in July 2008. The apri-cot fruits were kept in a cold store-room at 4°C. All the experiments were carried out at a room temperature. The fruit volume and density were determined by the water displacement method (Mohsenin 1986). The fruit mass was determined with an electronic balance with 0.1 g sensitivity. The apricots pictures were taken by Area Measurement System Delta T-England apparatus. Then, the projected areas (AP) were calculated by applying the software written in Visual Basic. A glued Plexiglas column was used having a height of 1200 mm and a cross-section of 350 × 350 mm as shown in Figure 1. The column was constructed with a diameter at least five times that of the fruit (Vanoni 1975). The column was filled with water to a height of 1100 mm.
Each fruit was placed manually on the top of the column and then released, and if any bubble ap-peared on it, it was removed by rubbing the fruit. The fruit was then positioned flat (i.e., with its largest
[image:4.595.305.534.155.710.2]two dimensions oriented horizontally) on the top of the column. In order to determine the dropping time of the fruit, a digital camera, JVC (770) with 25 fps, recorded simultaneously the moving of the fruit from the releasing point to the bottomof the water column. Each fruit was tested three times.
Figure 1. Water column and camera setting to the right side (Kheiralipour 2008)
Figure 2. Actual images of apricot positions in water column A: Apricot at rest
B: Apricot 0.52 s after releasing C: Apricot 1.52 s after releasing
(B) (A)
[image:4.595.65.291.559.728.2]Subsequently, the video to frame software was used to change the video film into images in order to cal-culate the dropping time of the fruit, knowing the fact that each picture takes 0.04 s. In other words, Td
was calculated using the following equation:
Td = 0.04 × N (17)
where:
N – number of images captured of a sample in its passing along the column from the tor to the bottom (1100 mm).
Three images of the Nasiry apricot variety were selected at the time of 0.00, 0.52, and 1.52 s as shown in Figure 2. The information on the trajectory of the fruit moving along the water column was plotted in a Microsoft Excel Worksheet. The dropping times of three varieties of Iranian apricots were modelled using SPSS 15 software and considering the Eq. (16). The model (theory KHAT 4) was optimised by ad-justing various combinations of the four parameters to maximise the determination coefficient (R2) and
to minimize root mean square error (RMSE) and reduced chi-square (χ2).
results and discussion
Two models were tested, and the results are sum-marized in Tables 1–3 for Nasiry, Rajabali, and
Ghavami apricot varieties, respectively.
For the Nasiry apricot variety, the effectiveness of all parameters including the shape factor, volume, and water and fruit densities for the dropping time determination is shown in Model 1 with R2, RMSE,
and χ2 of 0.95, 0.226, and 0.062, respectively.
Td = 4.29 × 10²⁰ (ρ
w – ρf)–8.63v0.108Sh0 .078 R2 = 0.95 By eliminating both the volume and the shape fac-tor in Model 2, a small reduction in R2 was observed.
With these models, it can be seen that the parameter most effective on the dropping time of the Nasiry
apricot variety is density.
For the Rajabali apricot variety, the effectiveness of all parameters including the shape factor, volume, and water and fruit densities for the dropping time determination is shown in Model 1 with R2, RMSE,
and χ2 of 0.92, 0.009, and 0.0001, respectively.
Td = 71 × 103 (ρ
w – ρf)–1.367v–0.023Sh0 .611 R2 = 0.92 When deleting both the volume and the shape fac-tor in Model 2, a small reduction in R2 was observed.
It can be stated based on these models that the most effective characteristic of the Rajabali apricot variety concerning its dropping time is density, like with the
Nasiry apricot variety. And for the Ghavami apricot
variety, the effectiveness of all parameters including the shape factor, volume, and water and fruit
densi-Table 1. Comparison of dropping time models developed with different parameters and corresponding determination coefficient with Nasiry apricot variety
Model A b c d R2 RMSE χ2
1 4.29 × 10²⁰ –8.63 0.108 0.078 0.95 0.226 0.062
2 6.37 × 1026 –8.63 0.000 0.000 0.94 0.271 0.080
Table 2. Comparison of dropping time models developed with different parameters and corresponding determination coefficient with Rajabali apricot variety
Model A b c d R2 RMSE χ2
1 71 × 103 –1.367 –0.023 0.611 0.92 0.0090 0.0001
2 4253.56 –0.953 0.000 0.000 0.87 0.0009 0.0002
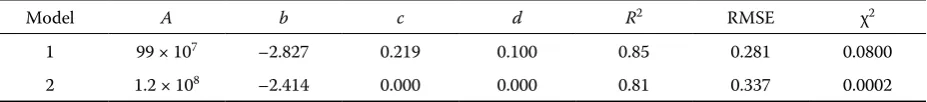
Table 3. Comparison of dropping time models developed with different parameters and corresponding determination coefficient with Ghavami apricot variety
Model A b c d R2 RMSE χ2
1 99 × 107 –2.827 0.219 0.100 0.85 0.281 0.0800
[image:5.595.69.531.490.542.2] [image:5.595.64.532.598.649.2] [image:5.595.68.532.705.756.2]ties for the dropping time determination is shown in Model 1 with R2, RMSE, and χ2 of 0.85, 0.281, and
0.08, respectively.
Td = 99 × 107 (ρ
w – ρf)–2.827v0.219Sh0 .1 R2 = 0.85 By deleting both the volume and the shape factor in Model 2, a small reduction in R2 was observed.
From these models, like with the Nasiry and Rajabali
apricot varieties, it can be derived that the most ef-fective characteristic of Ghavami apricot variety in relation to its dropping time is density. According to Jordan and Clerk(2004), fruit density is a strong indicator of the internal sugar status in kiwifruit, and its value minus the value of the density of the supporting fluid has a major effect on the dropping velocity and thus on the transit time to reach the bottom of a fluid tank. The fruit shape also affects the velocity but is not of such magnitude as to cause concern (Jordan & Clerk 2004). A similar research was conducted by Kheiralipour (2008). He concluded that the best model for the rising time of Redspar apples is:
Td = 6681 (ρw – ρf)–0.83v–0.88 + 1.6 R2 = 0.78
and also he reported that the fruit density had a major effect on the rising time of apples.
conclusions
In this study, the best models for the dropping times of the Nasiry, Rajabali, and Ghavami apricot varieties were found to be in the form of Eq. (16) as a function of the water and fruit densities, shape factor, and fruit volume. It can be concluded that density is the most effective parameter of these apri-cot varieties as concerns the dropping time, and that apricot fruits of approximately constant volume can be sorted based on their densities. This is due to the fact that fruits with approximately constant volume and different densities show different dropping times and can be separated accordingly.
acknowledgment
The authors acknowledge the University of Tehran and Mr. Farzad Mirzaee and Mr. Javad Mirzaee for their full support of this project.
list of selected symbols
D – fruit diameter (mm)
NR – Reynolds number (dimensionless)
Ap – projected area (cm2)
a – acceleration (m/s2)
v – fruit volume (cm3)
V – velocity (m/s)
M – fruit mass (g)
Vt – terminal velocity (m/s)
ρf – fruit density (kg/m3)
Td – dropping time (s)
Sh – shape factor of fruit
n – constant factor
G – gravitational acceleration (m/s2)
K – constant factor ρw – water density (kg/m3)
B – constant factor
µw – static viscosity of water (N.s/m2)
e – constant factor
Fd – drag force (N)
A – curve fitting parameter
Fb – bouncy force (N)
b – curve fitting parameter
Fw – gravitational force (N)
c – curve fitting parameter
CD – drag coefficient (dimensionless)
d – curve fitting parameter
references
Bajema R.W. (2001): System for Debris Elimination and Item Separation and Method of Use Thereof. United States. Patent No. 6293407.
Crowe C.T., Elger D.F., Roberson J.A. (2001): Engineer-ing Fluid Dynamics. 7th Ed. John Wiley and Sons, New
York.
Jordan R.B., Clerk C.J. (2004): Sorting of kiwifruit for qual-ity using drop velocqual-ity in water. ASAE, 47: 1991–1998. Jordan R.B., Walton E.F., Klages K.U., Seelye R.J. (2000):
Postharvest fruit density as an indicator of dry matter and ripened soluble solids of kiwifruit. Postharvest Biology Technology, 20: 63–173.
Kheiralipour K. (2008): Determination of Terminal Veloci-ties of Two Apple VarieVeloci-ties (cv. Redspar and Delbarstival) Using Water Column. [M.Sc. Thesis.] University of Tehran, Tehran.
Kunkel R., Gifford P.F., Edgar E.D., Binkley A.M. (1952): The mechanical separation of potatoes into spe-cific gravity groups. American Journal of Potato Research, 28: 690.
Mohsenin N.N. (1986): Physical Properties of Plant and Animal Materials. Gordon and Breach Science Publica-tion, New York.
Patzlaff A.W. (1980): Hydrodynamic Blueberry Sorting. United States. Patent No. 4225424.
Perry R.L., Perkins R.M. (1968): Separators for frost dam-aged oranges. Citro Graph, 53: 304–312.
Tabatabaeefar A., Rajabipour A. (2005): Modeling the mass of apples by geometrical attributes. Scientia Horti-culture, 105: 373–382.
Vanoni V.A. (1975): Sedimentation Engineering. Manual 54. ASCE, New York.
Corresponding author:
Dr. Esmaeil Mirzaee, University of Tehran, Faculty of Agricultural Engineering and Technology, Department of Agricultural Machinery Engineering, Karaj, Iran
tel: + 982 612 801 011, fax: + 982 612 808 138, e-mail:mirzaee1364 @yahoo.com, [email protected] abstrakt
Mirzaee E., Rafiee S., Keyhani A., Emam-Djomeh Z., Kheikalipour K. (2009): třídění meruněk ve vodním sloupci na základě fyzikálních vlasností. Res. Agr. Eng., 55: 159–164.
Ve studii byl sledován čas sedimentace meruněk ve vodním sloupci. Při použití standardních metod byly stanoveny některé vlastnosti, které čas sedimentace ovlivňují. Byly vypracovány nejvhodnější modely pro čas sedimentace odrůd Nasiri, Rajabali a Ghavami jako funkce hustoty vody a plodu, a tvaru a objemu plodu s koeficienty determinace 0,95, 0,92 a 0,85. Bylo zjištěno, že největší vliv na čas sedimentace měl rozdíl mezi hustotou plodu a vody.
Klíčová slova: sedimentační čas; hustota; objem; faktor tvaru; třídění ve vodním sloupcí; meruňky
Wilson J.H., Lindsay A.M. (1969): The relation between specific gravity and dry matter content of potato tubers. American Journal of Potato Research, 46: 323–328.