Microstructures of Cu-Ge Alloy Rods Pulled from a Hyperperitectic Melt by
the Czochralski Method
*1Yuji Imashimizu and Jiroˆ Watanabe´
*2Department of Materials Science and Engineering, Faculty of Engineering and Resource Science, Akita University, Akita 010-8502, Japan
Cu-Ge alloy rods were pulled from a hyperperitectic melt at three kinds of pulling rates while the melt temperatures were lowered at controlled rates, respectively by the Czochralski method. The relationship between the pulling rate and the Ge concentration in thephase that solidified first from the melt is approximated by the relation derived from the BPS expression for the effective distribution coefficient. A group of peritecticgrains is formed subsequent to the initial growth ofcrystal in the rods pulled at some rates. Growth of thegrains is followed by growth ofphase, resulting in the formation of alternating structures of the primaryand the peritectic which is accompanied by a simultaneous variation in rod thickness. This appears repeatedly at short intervals along the rod when it is pulled at a high rate. It is concluded that the alternating structures ofphase and peritecticgrains are formed by a peritectic solidification of Ge-rich melt at the cell boundary that develops on a constitutionally supercooled solid-liquid interface, and that their cessation is due to a decrease in Ge concentration of the liquid at the interface, with subsequent growth of thephase.
(Received December 24, 2002; Accepted August 21, 2003)
Keywords: copper-germanium alloy, hyperperitectic alloy, unidirectional solidification, Czochralski method, effective distribution coefficient, peritectic structure, peritectic solidification, peritectic transformation, constitutional supercooling
1. Introduction
The solidification of peritectic alloys involves dendritic growth of the primary phase and crystallization of the secondary phase from the melt between adjacent
dendrites,1) resulting in the introduction of dendritic struc-tures1–4)in ordinary Bridgman type freezing. Therefore, for the growth of a single phase with peritectic composition it would be necessary to carry out unidirectional solidification under high temperature gradients and low growth rates so as not to grow dendritically. However, it has been shown in the unidirectional solidification of hypoperitectic Sn-Sb and Zn-Cu alloys that theandphases deposit alternately to form a banded structure under conditions of largeG=Rratios (Gand
Rare the temperature gradient and growth rate, respectively). That is, steady state solidification with planar interface cannot occur.2)Such a banded structure is formed in other alloys which are not only hypoperitectic systems but also hyperperitectic systems.5,6) Thus, it appears generally diffi-cult to prepare peritectic phase crystal using the Bridgman process. However, it may be possible for the Pb-Bi system in which a transition fromphase tophase can occur without the banded structure at a very low growth rate with a high temperature gradient,5)resulting in longitudinal separation of the phase and phase.7) Such a separation into the two phases should be investigated in other peritectic systems.
On the other hand, it has been argued that zone melting of a hyperperitectic alloy rod must divide it into two distinct parts withandphases.8)This has been verified experimentally in the CdTe-In2Te3 system.9)Therefore, the technique may
be effective to grow peritectic phase crystal. The Czochralski technique would also be advantageous, since it is possible to control not only the solidification rate but also the melt temperature by the use of a simple apparatus that is commercially available. Moreover, this method enables the unidirectional solidification under high temperature gradients if a thin diameter pulling rod is used. However, the details of how the solidification proceeds during pulling of the peritectic alloy with the Czochralski method has not been extensively investigated.
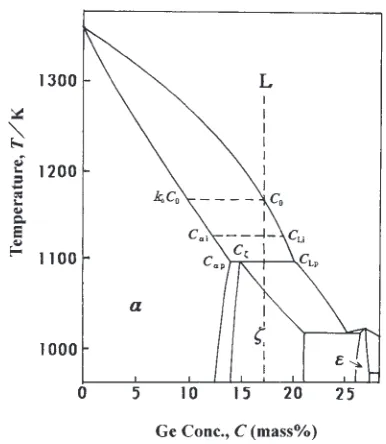
In this study, Cu-Ge alloy was selected as a peritectic system. The copper-rich side of the Cu-Ge equilibrium phase diagram10) is shown in Fig. 1, which indicates that the peritectic reaction,
Fig. 1 Copper-rich side of the Cu-Ge equilibrium phase diagram.10)
*1This Paper was Partly Presented at the Autumn Meeting of Japan
Institute of Metals, held in Sendai, on September 24 to 26, 1997 and at International Conference on Solid-Solid Phase Transformations PTM’99, held in Kyoto Japan, on May 24 to 28, 1999.
*2Professor Emeritus, Akita University
[image:1.595.329.522.547.769.2]Solid solution(13.5 mass%Ge)þLiquid(19.5 mass%Ge)
!Solid solution (14.4 mass%Ge) ð1Þ
occurs at 1097 K. The growth of the peritectic phase from a hyperperitectic melt is particularly interesting because it can be carried out at low temperatures compared to that from a hypoperitectic melt. Pullings from the hyperperitectic melt containing 17 mass% germanium were performed under various conditions by the Czochralski method and the microstructures and Ge distributions in the pulled rod were examined. We will discuss the relationship between the pulling conditions and the features of the peritectic structures to study how the peritectic phase grows from the hyper-peritectic melt in the Czochralski process.
2. Experimental Procedure
2.1 Pulling of Cu-Ge alloy rods
99.996 mass% purity copper (re-electrolyzed copper) and 99.999 mass% purity germanium were used as starting materials. Pulling of Cu-Ge alloy rods was done with a pulling apparatus fitted with the Czochralski head and radio frequency induction heater (DP-150 FB, Kokusai Electric Co. Ltd.). The copper and germanium (total weight about 0.1 kg, Cu-17 mass%Ge) were melted in a high-purity graph-ite crucible (30 mm inner diameter) under a stream of purified argon gas. The melt temperature was monitored by a Pt/Pt-Rh thermocouple inserted into the side wall of the crucible and adjusted according to specification by the programmable PID controller. After the melt was held at about 1203 K, a copper seed crystal 5 mm in diameter and 60 mm long oriented [111] and tapered to a tip diameter of about 1 mm, was dipped, kept for 600 s and then pulled upward at a constant rate. The pulling was performed at a low rate of
5:6107m/s, a medium rate of1:4106m/s or a high
rate of2:8106m/s, with a rotation rate of 1 rad/s while
the melt temperaure was lowered at a controlled rate. After the melt temperature was lowered at the set rate to about 1153 K, below which the melt starts to solidify, the melt was held at a constant temperature. When the pulling rod attained a length of 30 to 40 mm, it was separated from the melt at a high pulling rate of4:2104m/s and cooled in the furnace.
Pulling conditions in this experiment are listed in Table 1.
2.2 Analysis of microstructures in pulled rods of Cu-Ge alloy
Pulled rods were cut into two or three pieces. Longitudinal sections nearly coincident with the axis of the rods were ground, polished and etched with a 10 percent aqueous solution of (NH4)2S4O8, and the microstructures examined
with an optical microscope. Quantitative compositional analysis of the alloy specimens was performed by EDS (Tracor Northern Co. Ltd). Germanium distributions were investigated by carrying out point analysis at about 0.5 mm intervals along the entire length of pulled rods as well as at 50mmintervals across some specified microstructures.
3. Experimental Results
3.1 External shapes of Cu-Ge alloy rods and Ge distribution along the rod length
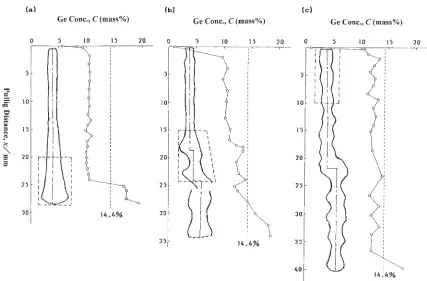
Examples of external shapes of pulled Cu-Ge alloy rods and macroscopic distributions of germanium along the rod length are shown in Fig. 2. In rod No. 1, which was pulled at the low rate, the diameter was nearly constant in the initial half length, but increased gradually toward the end (Fig. 2(a)). The Ge concentration was nearly constant in most of the rod except for the thick end, in which it increased sharply. Although rod No. 2 was pulled at the same rate as No. 1, the former was thicker and had a higher Ge concentration than the latter. The shape was rather similar to that of rods No. 3 and 4, which were pulled at the medium rate. The thickness of rods No. 3 and 4 did not appreciably increase in the initial portion, but increased and then decreased in the middle portion, showing a variation that tended to repeat itself in the second half (Fig. 2(b)). In rods No. 5 and 6, which were pulled at the high rate, the increase and decrease in thickness were alternately repeated at short intervals along the rod length (Fig. 2(c)). In the rods pulled at medium and high rates, the Ge concentration generally tended to change along the rod length, in step with the thickness, so that it was at a maximum near the thicker portions with the peritectic composition of 14.4 mass%, but it also increased steeply to a high value at the terminal end.
The average Ge concentrations in the initial 15 mm of pulled rods are given in Table 2. The first phase that solidified from the melt of Cu-17 mass% Ge alloy was the phase containing 10 to 12 mass%Ge, of which the highest
concen-Table 1 Pulling conditions of Cu-Ge alloy rod in this experiment. Rod Pulling Lowering rate of the No. rate, melt temperature,
R dT=dt ð1=RÞdT=dt* (106m s1) (103K s1) (103Km1)
1
0.56 1.7 3.0
2 3
1.4 5.6 4.0
4 5
2.8 8.3 3.0
6
[image:2.595.47.292.647.776.2]*The rate to a pulling distance.
Table 2 The average Ge concentration in the initial 15 mm (primary
phase) of pulled rods, and the distance from the seed to the first formed
structure.
Rod Ge concentration Location of the No. of the primary, first formed,
C(mass%) x*/mm
1 10.6 25
2 10.9 20
3 10.4 15
4 10.7 17
5 11.9** 1.6
6 11.9** 4.4
* Distance from the seed.
[image:2.595.305.550.650.767.2]tration appeared in the rods pulled at the high rate.
3.2 Microstructures and Ge distribution
Figures 3(a), (b) and (c) show low-magnification micro-graphs of longitudinal sections of the rods pulled at low, medium and high rates, which cover the areas surrounded by broken lines in Figs. 2(a), (b) and (c), respectively. A comparison of Fig. 2 with Fig. 3 shows that the first-formed
phase was a single crystal in all rods because no grain boundaries appeared, and the traces of Widmansta¨tten
lamellae which should be formed martensitically along the octahedral habit planes of supersaturated (fcc)11) aligned along the same directions. On the other hand, the character-istic microstructures of secondary phases were first formed in the thicker portions of the rods, which were located at different distances from the seed depending on the pulling
Fig. 2 External shapes and the Ge distributions along the length of Cu-Ge alloy rods pulled at (a) low, (b) medium and (c) high rates.
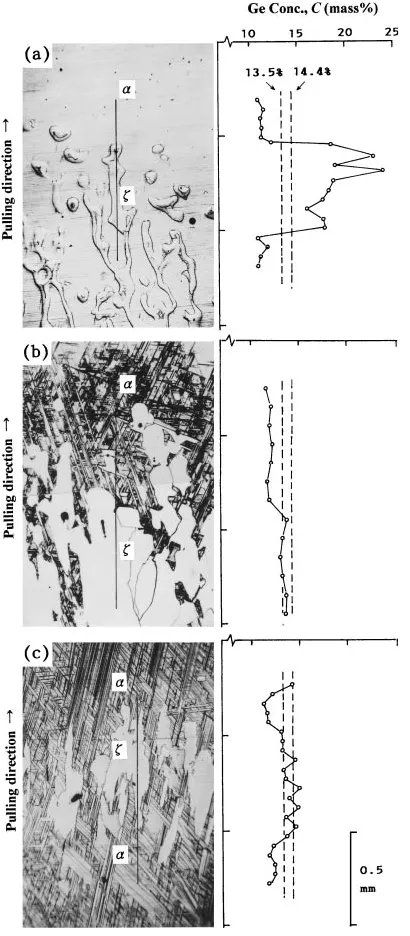
[image:3.595.83.510.67.348.2] [image:3.595.114.485.394.638.2]rate, as shown in Table 2. Figure 4 shows optical micrographs of a part of the microstructures shown in Fig. 3, and the Ge distributions along the line drawn on the micrographs, taken at a higher magnification. The average Ge concentrations over a growth distance crossing the matrix and the secondary phase are shown in Table 3.
In rod No. 1, which was pulled at the low rate, an island-like structure was introduced in the last thick portion (Figs. 3(a) and 4(a)). The Ge concentration in the island is higher than the peritectic compositionC, while that in thematrix
is low compared with composition Cp giving rise to
peritectic reaction (Fig. 4(a), Table 2). In rod No. 2, a mixed structure of Widmannsta¨tten lamellae and round grains of secondary phase were formed in a thicker portion of the second half.
In rods No. 3 and 4, which were pulled at the medium rate, the initial growth ofcrystal was followed by a succession of micromorphologies in the middle portion:phase containing prominently developed Widmansta¨tten lamellae, a group of secondary phase grains, andphase, as shown in Fig. 3(b). The Ge concentration of the secondary grains approx-imately coincides with C (Fig. 4(b) and Table 3). The
formation of thegrains was accompanied by a decrease in thickness, and subsequently phase instead of grains, which still contained a few dispersedgrains, grew again. It was accompanied with an increase in thickness and the second group ofgrains introduced alternatively.
In rods No. 5 and 6, which were pulled at the high rate, afterphase containing dense Widmansta¨tten lamellae grew initially, a group of grains, the composition of which is nearly equal to C, appeared in the initial thicker portion
(Figs. 3(c) and 4(c)). It is noticeable that the thickness of the rods decreased with growth of the grains, but increased again with the subsequent growth ofphase. The alternating structures with a variation in thickness repeatedly formed at short intervals along the rod length. Figure 5(a) shows a later group ofgrains formed in the second half of the rods. It can be seen that thegrains became large compared to those in the initial portion.
[image:4.595.69.274.72.540.2]Fig. 4 Magnified views of the microstructures shown in Fig. 3 and the microscopic Ge distributions along the lines drawn on the micrographs, which were formed in rods pulled at (a) low, (b) medium and (c) high rates.
Table 3 The Ge concentration of the secondary grains and their neighboring matrices.
Rod Ge concentration,
No. C(mass%)
Matrix Secondary
phase phase
1 11.6* 18.1*
2 12.6** 14.8**
3 12.0 13.7
4 13.0 14.5
5 12.1 13.4
6 12.3 14.0
* For the structure shown in Fig. 4(a).
** For a structure similar to that formed in the rods pulled at higher rates.
[image:4.595.302.550.94.224.2] [image:4.595.306.549.587.749.2]The terminal end of rods pulled at the medium and high rates generally exhibited a complicated structure, which contained dendritic structure as shown in Fig. 5(b) and had a very high Ge concentration compared toC (Figs. 2(b) and
(c)).
4. Discussion
4.1 Relationship between Ge concentration in pulled rod and its pulling rate
When a rod-like alloy crystal is grown unidirectionally from the stirred melt with an initial composition C0 by the Czochralski method, the solute concentration in the solid phase at the solid-liquid interfaceCSis given by
CSðfÞ ¼kC0ð1fÞk1; ð2Þ
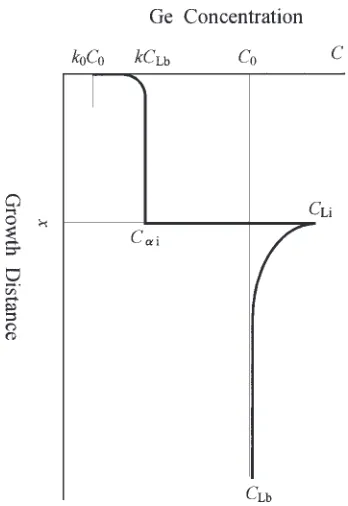
where f is the fraction of the melt solidified and k the effective distribution coefficient, and C0ð1fÞk1 corre-sponds to the bulk concentration in the meltCLbðfÞ. For a Cu-Ge alloy with an equilibrium distribution coefficientk0 less than unity, the solute concentration in the liquid at the solid-liquid interfaceCLiðfÞbecomes higher thanCLbðfÞbecause of the rejection of solute atoms from the advancing interface. Hence the Ge distribution profile near the advancing solid-liquid interface can be schematically drawn as shown in Fig. 6. In this figure, the growth distancexis related tof as
x¼4fW=ðd2Þ, whereWis the initial weight of the melt,
the density of the melt andd the diameter of the solidifying rod.
Provided that equilibrium prevails at the interface virtually independently of growth rate, Ge concentration in thesolid phase at the solid-liquid interfaceCiðxÞcan be related to that
in the liquid phase CLiðxÞ with the equilibrium distribution coefficientk0 as
CiðxÞ ¼k0CLiðxÞ ð3Þ
Moreover, according to the BPS theorem,12,13)if the growth rate of the solid phase is assumed to be nearly equal to the pulling rateR,kis expressed as
k¼ k0
k0þ ð1k0ÞexpðR=DÞ
ð4Þ
where Dis the diffusion coefficient of solute atoms in the liquid and the thickness of the diffusion layer at the interface.12)is given by
¼1:6D1=31=6!1=2; ð5Þ
where is the kinematic viscosity and ! is the angular velocity of the solid.12)
Since the solidified fraction in the present pulling of Cu-Ge alloy is estimated to be in the range of f
d2xmax=4W ¼0:01, assumingd¼2mm, xmax¼40mm,
W ¼0:1kg and¼8103kg/m3, eq. (2) can be approx-imately expressed as
CiðxÞ kC0: ð6Þ
That is, the Ge concentration in the pulling rod, especially in the initial portion, is almost independent of the pulled length. This is supported by the Ge concentration profiles of initial halves of the pulled rods shown in Fig. 2. Figure 7 shows the plots of Ge concentration in the rods pulled from the melt of Cu-17 mass%Ge as a function of pulling rate. Open circles designate the measured values shown in Table 2 and the solid line is a curve calculated from eqs. (4) and (6) assuming a proper value (1:96105s/m) for=D. The measured values
generally agree with the calculated curve and the value assumed for =D is valid because it is estimated to be
0:9105s/m from eq. (5) since!is 1 rad/s, if we assume
D¼2:0109m2/s (an estimated value of the diffusion coefficient of germanium in the copper alloy melt at 1100 K) and ¼5107m2/s (a value for the copper melt at melting point) referring to a data book.14)This shows that the
Fig. 6 Schematic drawing of the Ge distribution in the neighborhood of the advancing solid-liquid interface when Cu-Ge alloy solidifies unidirection-ally from the stirred melt.
[image:5.595.81.255.496.749.2] [image:5.595.323.530.555.748.2]relationship between the Ge concentration of the growing
solid phase and the pulling rate is approximated by the relation derived from the BPS expression for the effective distribution coefficient, though it should be applied to the dilute alloy.13)
4.2 Relationship between peritectic structure and pull-ing rate
4.2.1 Influence of lowering of the melt temperature
In crystal pulling, the temperature gradientGLin the liquid at the solid-liquid interface is assumed to be proportional to the differenceTbetween the melt temperatureTjust below the liquid element lifted by the pulling rod and the interface temperature Ti, according to the theory15) concerning the cross section of Czochralski crystals. In this experiment, the temperature of the bulk melt (Tb) was lowered at a rate that depended on the pulling rate (Table 1). Thus,Twas lowered at a corresponding rate. On the other hand, when Cu-Ge alloy rod is pulled at a constant rateR,Tiis surmised to correspond
to the melting temperature of the phase of composition
CiðxÞ given by eqs. (4) and (6). (Figs. 1 and 6). Hence,
lowering ofTbdecreasesT¼TTiand consequentlyGL, resulting in an increase in the diameter of the rod, as predicted from the theory.15)Thus, the increase in thickness of the pulled rod shown in Figs. 2 and 3 is thought to be attributable to a decrease in the temperature gradient GL at the interface.
On the other hand, it is known that the advancing solid-liquid interface becomes unstable to form a cellular structure due to constitutional supercooling under temperature gra-dients lower than a critical value.16–18) The critical temper-ature gradient increases with an increase in growth rate. Hence the constitutional supercooling would arise at an earlier stage under the higher pulling rate, if the melt temperature lowering rates at a particular pulling distance were the same between different pullings. This applies to the present experiment because the ratio of the lowering rate of the melt temperature to the pulling rate, ð1=RÞðdT=dtÞ was about the same between the pullings at different rates as shown in Table 1. Therefore, the variations of thickness and microstructure in the pulled rods can be explained as follows.
4.2.2 Formation of the secondarygrains
The formation of an island-like structure with a high Ge concentration in the last thick portion of rod No. 1 (Figs. 3(a) and 4(a)) can be attributed to a constitutional supercooling that should be brought about latest in this case because of the low pulling rate. The structure is thought to arise as a solidification of Ge-rich melt penetrates into the solid at the cell boundaries and nodes developed on the supercooled solid-liquid interface.17)
On the other hand, constitutional supercooling should arise at an earlier stage in the pulling of rods No. 3 and 4 at the medium rate. Hence the group of grains in the thickened middle portion of the rods (Fig. 3(b)) is also thought to be formed via a solidification of the Ge-rich melt trapped at cell boundaries developed on the supercooled interface. How-ever, those grains were formed in contact with each other (Fig. 4(b)), differing from the above island-like structures shown in Fig. 4(a) This shows that thephase between cell boundaries transformed into thephase at the same time that
Ge-rich melt penetrating into cell boundaries solidified to form the phase. The Ge concentration of the grains is nearly equal to the peritectic compositionC (Fig. 4(b) and
Table 3). Thus, thegrains are considered to be the peritectic phase which was formed by a peritectic reaction including
!peritectic transformation19,20)that nucleates at the/ Ge-rich melt interface, as described in the previous paper.21) From here on we will refer to the formation of thegrains as peritectic solidification. A mixed structure of the matrix and a dispersed round grains of compositionC (Table 3)
was formed in rod No. 2. This is attributed to the peritectic solidification caused by a fluctuation in growth conditions.
With high-rate pulling, constitutional supercooling should arise at the earliest stage of pulling. This resulted in the formation ofgrains of compositionCin the initial portion
of the pulled rods (Fig. 4(c) and Table 3) by the same process as that in the medium-rate pulling. However, the features of the microstructure ofgrains were different from that in the rods pulled at the medium rate. The reason for this is that when pulling proceeded at the high rate, the composition of
phaseCiðxÞwas nearer toCpthan when pulling was done at
the medium rate as shown in Fig. 7, and that thegrains were formed via the peritectic solidification under a smaller degree of constitutional supercooling.
4.2.3 Formation of alternating structures of the primary
and the peritectic
In the rods pulled at the medium and high rates, a group of peritecticgrains was formed subsequent to the growth of
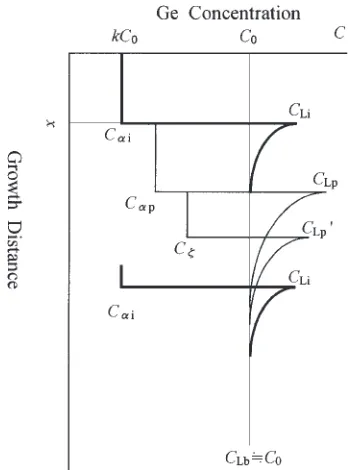
phase containing prominently developed Widmansta¨tten lamellae, but the growth ofgrains was followed by growth ofphase, resulting in the formation of alternating structures of and peritectic . This was accompanied by a simulta-neous variation in rod thickness (Figs. 3(b) and (c)). These things are interpreted by referring to the schematic drawings in Figs. 8 and 9, as follows.
The development of a cellular substructure of many depressions16)formed from Ge-rich melt on the constitution-ally supercooled solid-liquid interface (Fig. 8) is thought to increase the average Ge concentration in the liquid along the interface and consequently that in thesolid. We assume that the average Ge concentrations increase fromCLiandCi(on
the first thick line in Fig. 9) to about the limits of the peritectic horizontal CLp and Cp (on the first thin line in
Fig. 9), respectively. Although it is not known whether those increased average concentrations coincide withCLpandCp,
respectively, the assumption seems reasonable qualitatively. We surmise that such an increase in Ci resulted in the
growth ofphase containing Widmannsta¨tten lamellae that precipitated during cooling and the subsequent formation of peritecticgrains by the peritectic solidification (Fig. 8(b)). The increase in the average Ge concentrations in the liquid and solid along the interface also lowered the interface temperature Ti (Fig. 1) and consequently increased the temperature gradient GL, which is deduced from the discussion in 4.2.1. This produced a decrease in rod thick-ness, with the formation of a group of grains.
concentration in the liquid at the interface fromCLptoCLp0, and even further toCLi(on the second thin and thick lines in
Fig. 9), with cancellation of an increase in Ge concentration due to constitutional supercooling. Such a variation in the liquid composition at the interface allowedphase to grow again, instead of phase (Fig. 8(d)), and increasedTi. The
increase in Ti decreased the temperature gradient GL in further pulling and gradually increased the rod thickness again, This destabilized the advancing interface and intro-duced the second group ofgrains (Fig. 3(b) and (c)).
The grains in the initial portion of the rods that were pulled at the high rate were smaller than those in the middle portion of the rods that were pulled at the medium rate (Figs. 4(b) and (c)), but the later group ofgrains in the second half of the former became large to form a morphology similar to that in the latter (Fig. 5(a)). This is attributed to an increase in the magnitude of constitutional supercooling with lowering of the melt temperature.
4.2.4 Formation of related structures
In rod No. 1, island-like structures with a higher Ge concentration than C (Fig. 4(a)) which are different from
peritectic products were formed via a solidifying of the Ge-rich melt at the cellular interface and few Widmannsta¨tten lamellae precipitated in the phase. The reason for this is that the Ci was low compared toCp even at the onset of
constitutional supercooling because of low pulling rate (Table 3). On the other hand, the microstructures in the terminal end of the rods pulled at the medium and high rates (Fig. 5(b)) were very complicated and contained much more germanium than in the peritecticphase (Figs. 2(b) and (c)). This shows that those structures are also not peritectic products, but the phases or a probable eutectic ofand"
phases (see Fig. 1) that solidified directly from a Ge-rich melt. The formation of such structures is attributed to dendritic growth that should proceed under the large degree of constitutional supercooling that arose from a higher pulling rate.
5. Conclusions
Cu-Ge alloy rods were pulled from a hyperperitectic melt at three kinds of pulling rates while the melt temperatures were lowered at controlled rates, respectively by the Czochralski method. The microstructures and the Ge dis-tributions in the pulled rods were examined.
(1) The relationship between the pulling rate and the Ge concentration of thephase that solidified first from the melt is approximated by the relation derived from the BPS expression for the effective distribution coefficient.
(2) A group of peritecticgrains is formed subsequent to the initial growth ofcrystal in the rods pulled at some rates. The growth of phase is followed by phase growth, producing alternating structures of the primary and the peritectic which is accompanied by a simultaneous variation in rod thickness. This appears repeatedly at short intervals along the rod when it is pulled at a high rate.
(3) The alternating structures are formed by a peritectic solidification of Ge-rich melt at the cell boundary that develops on a constitutionally supercooled solid-liquid inter-face, and their cessation is due to a decrease in Ge
Fig. 8 Illustration for the formation process of a group of peritectic
grains. (a) the solid-liquid interface at the onset of constitutional supercooling, (b) peritectic solidification, (c) growth ofgrains, and (d) cessation ofgrain growth and growth of the secondphase.
Fig. 9 Schematic diagram of the presumed change of the Ge distribution near the solid-liquid interface that explains the formation of alternate
[image:7.595.83.243.68.411.2] [image:7.595.80.256.492.727.2]concentration in the liquid at the interface, with subsequent growth of thephase.
Acknowledgments
The authors wish to express their thanks to Mr. Mazlan Mohammad, who was a graduate student at Akita University, for his kind help with the experiments.
REFERENCES
1) D. R. Uhlmann and G. A. Chadwick: Acta Metall.9(1961) 835-840. 2) A. P. Titchener and J. A. Spittle: Acta Metall.23(1975) 497-502. 3) H. Fredriksson and T.Nyle´n: Metal Sci.16(1982) 283-294. 4) D. H. St. John and L. M. Hogan: J. Mater. Sci.19(1984) 939-948. 5) K. Tokieda, H. Yasuda, I. Ohnaka: Mater. Sci. Eng.A262(1999)
238-245.
6) H. Yasuda, N. Notake, K. Tokieda, I. Ohnaka: J. Crys. Growth210
(2000) 637-645.
7) R. Trivedi: Metall. Mater. Trans. A26A(1995) 1583-1589. 8) C. H. L. Goodman: Research, (London)7(1954) 168-177.
9) D. R. Mason and J. S. Cook: J. Appl. Phys.32(1961) 475-477. 10) R. W. Olesinski and G. J. Abbaschian, in: Binary Alloy Phase
Diagrams,1, (ASM, Ohio, 1986) pp. 919-921.
11) P. S. Kotval and R. W. K. Honeycombe: Acta Metall.16(1968) 597-607.
12) J. A. Burton, R. C. Prim and W. P. Slichter: J. Chem. Phys.21(1953) 1987-1991.
13) J. A. Burton, E. D. Kolb, W. P. Slichter and J. D. Struthers: J. Chem. Phys.21(1953) 1991–1996.
14) Nippon Kinzoku Gakkai: Kinzoku Deˆta Bukku, (Maruzen, Tokyo, 1993) pp. 16, 57.
15) R. G. Pohl: J. Appl. Phys.25(1954) 668-669.
16) H. Biloni, G. F. Bolling and G. S. Cole: Trans. Metall. Soc. AIME236
(1966) 930-935.
17) R. M. Sharp and A. Hellawell: J. Crys. Growth11(1971) 77-91. 18) D. T. J. Hurle: Solid-State Electron.3(1961) 37-44.
19) M. Hillert, in: Solidification and Casting of Metals, (The Metals Society, London, 1979) pp. 81-87.
20) K. Matsuura and M. Kudoh: Mater. Trans., JIM39(1998) 203-210. 21) Y. Imashimizu, J. Watanabe´ and M. Mohammad: Proc. Int. Conf. on