The Effect of Ram Speed on Mechanical and Thermal Properties
in ECAE Process Simulation
Sung Wook Chung
1*, Woo-Jin Kim
2, Masahide Kohzu
1and Kenji Higashi
11
Department of Metallurgy and Materials Science, Osaka Prefecture University, Sakai 599-8531, Japan
2Department of Metallurgy and Materials Science, Hong-ik University, Seoul 121-791, Korea
Mechanical and thermal properties during equal channel angular extrusion (ECAE) process are analyzed by finite volume method simulation. Chronological effective strain behavior during ECAE was visualized by 3-dimensional simulation. Local instability during ECAE was detected by the detailed analyses (named as ‘center-divided points’ and ‘cut-area points’), which are indicative of effective strain, effective stress, effective strain rate and temperature. Different ram speed caused different heat dissipation history and accordingly different mechanical and thermal properties during ECAE. In this simulation work, most of deformation occurred at the slip plane agreeing with theoretical prediction.
(Received October 21, 2002; Accepted March 19, 2003)
Keywords: equal channel angular extrusion, local instability, press speed, heat dissipation, finite volume method simulation
1. Introduction
Segal1)reported ECAE firstly as an effective hot-working process. By Segal, ECAE has proved its unique merits superior to other metal working methods; i.e., uniform structure and properties after working, large equivalent strain per pass without changing its cross-section, relatively low pressure needed for extrusion and controllable shear direction for homogeneous stress-strain state. ECAE process, which loads severe strain into material by simple shear, has been widely attempted by former researchers1,2)for making ultra fine grained superplastic material and showing its attractive merits, for example, very simple way to give superplasticity into various metals; Al and Al alloys,3–17) Mg alloys,18–20) Zn–Al and Pb–Sn alloy,21,22) Ti alloys23) and steels.24–26) Recently, there have been trials using simulation to analyze ECAE process.27–29) DeLo and Semiatin showed finite element modeling for ECAE27)and remarking the effect of shear localization, heat transfer, friction and die design on ECAE deformation successfully with 2-D simulation while limited results were available with 3-D simulation. Semiatin et al. showed material properties like effective strain, effective strain rate or effective stress during deformation affected by tooling design.28)Kim investigated the tempera-ture rise of the material during ECAE29)analytically.
Since half the 20th century, simulation by computerized calculation has been used for engineering analysis. In a viewpoint of plastic deformation analysis, simulation work has been carried out for super plastic forming analysis since 1990’s30) and mostly developed in thin sheet forming for aerospace industry with finite element method (FEM).31,32) There has been other numerical method for solving partial differential equations called as finite volume method (FVM) that calculates the values of the conserved variables averaged across the volume. Hyman et al.33) has derived local, accurate, reliable, and efficient finite volume methods that mimic symmetry, conservation, stability, and the duality relationships between the gradient, curl, and divergence
operators on nonuniform rectangular and cuboid grids. However, forming analysis simulated by FVM has been not so much applied rather than FEM though stiff increase of actual usage in industry.
In this work, severe plastic forming simulation (virtual ECAE process with 2 passes by route B) was performed varying high and low ram speed with using high-end computer and commercial FVM simulation solver named MSC.SuperForge.
2. Modeling
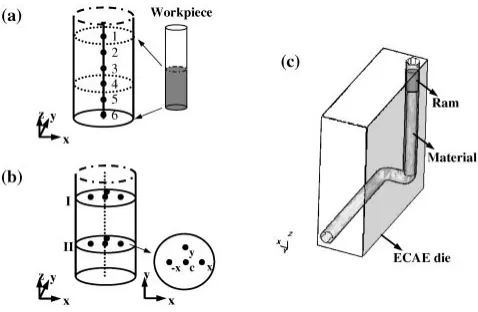
Full 3-D ECAE modeling was carefully prepared in order to understand virtual results of mechanical or thermal properties during ECAE process. Two ways of analyses were carried out newly; one is ‘center-divided points’ of which nodes are distributed on vertical line and the other is ‘cut-area points’ having horizontal nodal points. Schematic figure and geometry is shown in Figs. 1(a) and (b). These ‘points’ are calculated particularly in FVM solver, i.e. specified point set by user which is calculated individually as a particle in finite volume space. This particular technique
Fig. 1 Die and work piece geometry; (a) center-divided points, (b) cut-area points and (c) die geometry that were designed for 2 pass of route B.
*Graduate Student, Osaka Prefecture University.
[image:1.595.307.546.603.759.2]is supported in MSC.SuperForge2002, which is called as particle tracking option.34)
Geometry of center-divided points (Fig.1(a)) is consisted of uniformly divided 6 points on the central line of deformed workpiece block. Cut-area points (Fig.1(b)) were set on two areas of I and II where located 50% and 20% respectively apart from the bottom of initial rod. Actually, the points 1 and 4 in Fig.1(a) correspond to the central points of region I and II respectively in Fig. 1(b). In Fig. 1(c), channel of die is firstly bended to x-direction then, secondly bended to y-direction. This geometry can be replaced on 2 passes of route B (rotation 90 between pass). Die size was a cube of
70 mm226 mm226 mmand initial workpiece was a rod of 10 mm diameter and 150 mm height. Ram and die were assumed to rigid bodies which take no plastic deformation during ECAE simulation.
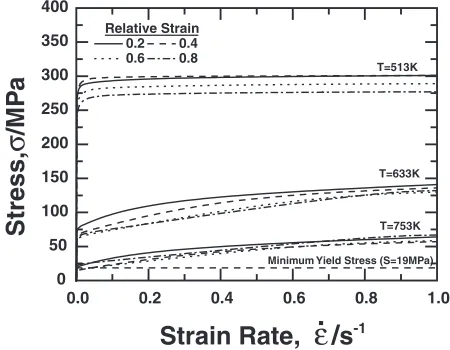
Material was chosen as commercial Al 5083 alloy of well-known initial material properties at elevated temperatures. Table 1 includes mechanical and thermal properties of virtual Al5083 alloy. At temperatures above the recrystalli-zation temperature, the influence of strain upon flow stress is insignificant, while the influence of strain rate becomes increasingly important. Those relations were prepared from database in MSC.SuperForge material references and ar-ranged in Table2as a function of yield constantCand strain-rate hardening exponent M, which depend on temperature and effective strain varied by each strain steps of 0.2 at varied temperatures as shown in Fig.2. The governing equation for plastic deformation in HOTMAT II,35) which was selected for high temperature and large plastic deformation, is
Y ¼MAXðS;C""""_MÞ ð1Þ
In Table2, theCandMvalues at any temperature are defined by linear interpolation between 513–753 K. After a hot forming material is defined (as the forms of Tables1and2) in MSC.SuperForge, the flow stress (Y) can be defined by the maximum value between the minimum yield stress (S, in the elastic deformation region) and the calculated stress
(C_""""M, in the plastic deformation region) by eq. (1). With
these flow relationships, the FVM solver in MSC.SuperForge calculates material flow through a fixed finite volume mesh built up with 8-node hexahedron elements at relative temperature. FVM method was chosen rather than FEM method because FVM’s solution efficiency for large defor-mation like metal flow is superior to that of FEM’s. (See APPENDIX A.1.)
[image:2.595.315.540.75.250.2]Working condition for simulation is arranged in Table 3. In this work, we focused on obtaining virtual but like-real full 3-D simulation of ECAE process. Virtual press was set as hydraulic press with constant ram speed of 1 mm/s and 20 mm/s. Friction coefficients at ram and die inner wall were set to 0.1. Temperatures of die, ram and work piece are all set to 623 K and atmosphere to room temperature. Thermal analyses on ECAE process were performed instantly with mechanical analysis and results are output as temperature distribution. (See APPENDIX A.2. for detailed explanation of thermal analysis preparation and friction coefficient
Table 1 Mechanical and thermal constants of virtual Al 5083 alloy used in FVM simulation.35)
Mechanical constants Heat material constant
Young’s Modulus,E/GPa 71 Thermal conductivity,k/Wm1K1 117
Poisson’s ratio 0.33 Specific heat capacityC/Jkg1K1 900
Plastic shear
0.1 Thermal expansion 2:38105
friction coefficient,m Coefficient,CTE/K1
Min. Yield Stress,S/MPa 19
[image:2.595.47.553.564.654.2]Density,/kg/m3 2660
Table 2 Heat material table-Al5083 (513–753 K).35)
513 K 633 K 753 K
" C M C M C M
0.2 3:00611eþ008 0.006 1:41343eþ008 0.095 6:41212eþ007 0.182
0.4 3:00611eþ008 0.001 1:35827eþ008 0.108 5:72265eþ007 0.208
0.6 2:8889eþ008 0.003 1:29621eþ008 0.111 5:86054eþ007 0.201
0.8 2:77169eþ008 0.002 1:3169eþ008 0.105 6:68791eþ007 0.161
Governing equation on plastic deformation is¼MAXðS;C""""_MÞ, whereSis the minimum yield stress. (Plastic form of HOTMAT II35))
0.0 0.2 0.4 0.6 0.8 1.0
0 50 100 150 200 250 300 350 400
Minimum Yield Stress (S=19MPa)
T=753K T=633K T=513K Relative Strain
0.2 0.4 0.6 0.8
Stress,
σ
/MP
a
Strain Rate,
ε
/
s
-1 [image:2.595.44.550.698.776.2]preparation.) In this work, we used CTRIA3 triangular shell element with three grid points to show 3-dimensional surfaces of workpiece and die; however, actual calculations were carried out with CHEXA brick element with eight grid points.35)In finite volume spaces, grid nodes are deformed in each space and solver calculates the effective strain, stress and other properties by the relationships of force and displacement from node of finite volume space. Detailed theory of FVM is beyond the scope of this report, but readers can find spatial references for FVM.36)
3. Results and Discussion
3.1 Chronological features of effective strain behavior during ECAE process
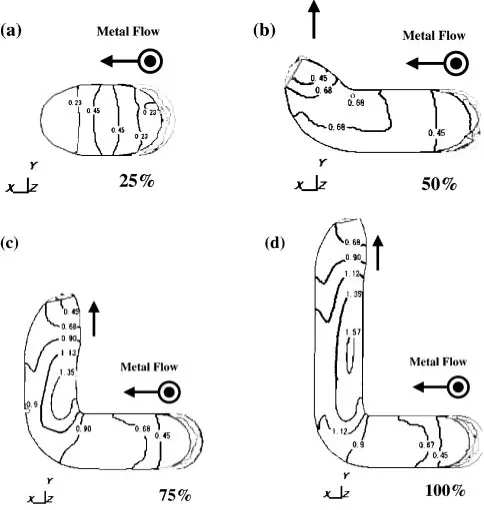
There are chronological figures of effective strain at the ram speed of 1 mm/s. with different camera views in Figs. 3 and 4. Figures 3(a)–(d) are XZ plane for 1st pass (cut plane normal to Y axis), and Figs. 4(a)–(d) show material flow at 2nd crossing channel at XY plane (cut plane normal toZ axis). Each step is divided by 25% of process time. As simulation proceeded, effective strain behavior has been developed to 1.6 at the maximum area at 100% process (equivalent to 2 passes, Fig.4(d)).
By theoretical aspects, the redundant strain afterNpasses
was represented as follows;1)
"N ¼N"i¼N
2
31=2cot an ð2Þ
where2is the angle between the channels. Iwahashiet al. developed more detailed form of accumulative strain per pass through the channel with inner working angle () and outer working angle ().37)Strain forN passes was introduced by Iwahashiet al.as equation below;37)
"¼ Nffiffiffi
3
p 2 cot
2 þ
2
þ cos ec 2 þ
2
ð3Þ
whereis inner angle of channel,is outer angle of channel and N is pass number. For the geometry of this work (¼90), theoretical strain for 2 passes is1:8.
Every deformation occurred firstly at the slip plane which locates 45(half of channel angle) crossing the channel. It is notable that higher effective strain area distributed from inner arc to outer arc after working channel (see Figs.3(a)–(d) and Figs. 4(b)–(d) on any deformed plane parallel to the slip plane). It is apparent that local instability rules the deforma-tion during ECAE process by an instant view on Figs. 3and
4. However, these contoured distribution results are
insuffi-Fig. 3 Effective strain features at (a) 25, (b) 50, (c) 75 and (d) 100% of processing step in a camera view of XZ plane (normal toY axis).
[image:3.595.48.553.84.174.2]Fig. 4 Effective strain features at (a) 25, (b) 50, (c) 75 and (d) 100% of processing step in a camera view of XY plane (normal toZ axis). Table 3 Working conditions used for ECAE simulation.
Temperature Ram Element
Work Piece 623 K Stroke 120 mm Surface CTRIA
ECAE Die 623 K Speed 1 and 20 Number of nodes 3
mm/s (Type) (triangle)
Ram 623 K Bulk (FV mesh) CHEXA
Atmosphere 298 K Number of nodes 6
[image:3.595.306.548.208.463.2]cient to understand local differences during deformation comprehensively.
3.2 Center-divided points and Cut-area points-effective strain, effective stress, effective strain rate, temperature
We suggested new way of simulation analysis for ECAE at the former chapter, which were called as center-divided points and cut-area points. The former is analysis at each point divided at central line in the rod-type block and the later is analysis at points located on the cut planes (named I and II) crossing the rod (Figs.1(a) and (b)).
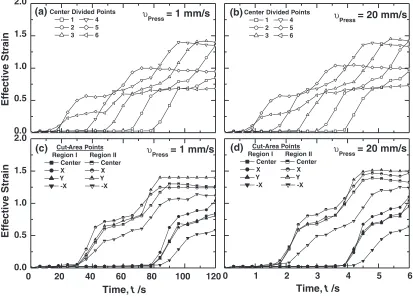
The chronological behaviors of effective strain at center-divided points are shown as a function of process time for low ram speed (1 mm/s, Fig.5(a)) and high ram speed (20 mm/s, Fig. 5(b)). First saturation of effective strain is 0:7 and second saturation is1:4. These trends are similar for both high press speed (20 mm/s) and low press speed (1 mm/s). The front leg area (points of 5 and 6 indicated in Fig. 1(a)) show relatively lower value of strain, which could come from limited deformation forward free spaces where are X-direction tube accommodating to first pass and Y-X-direction tube accommodating to second pass.
When we compared the theoretical eq. (3) to this simulation work, calculated strain was 0:91N (where
andis both 90), while resultant average effective strain by this simulation work is 0:7 for 1 pass. However, assumption of homogeneous deformation during ECAE seems not realistic because inhomogeneous deformation may be occurred locally in slip plane for each pass by the die
geometry such as the angles of inner and outer arc or friction to the surface of die,23)which causes inhomogeneous metal flow.
In Figs. 5(c) and (d), effective strain distribution at each cut-plane shows apparently that the effective strain peaks were occurred at the slip plane area but local instability of deformation at slip plane. Region I (including points Center, X, Y and X) keeps zero state until the second working channel (at first slip plane for region I) because there was no plastic deformation yet, then, shows first deformation at the slip plane of second channel (from Z-axis to X-axis). Region II shows apparent tendency of deformation at slip planes accommodating first pass (From Z axis to X axis) and second pass (From X axis to Y axis). In the results of region I and II, we can find out the fact that any points of local position in XY-plane crossing the initial rod were mostly deformed at slip plane depending on the distance from the inner arc of the channel. In the second channel (see Fig. 5(c)), effective strains at each point are ranged from 0.5–0.9 and arranged for each points of region I,i.e., XI>CenterI¼YI>XI, which
means maximum deformation occurred in point XI closest to
the inner arc of channel and minimum deformation occurred in point XI far from the inner arc. Similar trend was
obtainable in region II. In region II, effective strain results are arranged as XII>YII>CenterII>XIIafter deformation at
the first working channel, then subsequently changed its’ order such as YII>XII>CenterII>XIIafter deformation
at the second working channel. These local instabilities of effective strain could be found as a similar manner with those of high press speed of 20 mm/s. (Figs. 5(b) and (d)). With
0 20 40 60 80 100 120
0.0 0.5 1.0 1.5 2.0 0.0 0.5 1.0 1.5 2.0
0 1 2 3 4 5 6
(b) υ
Press = 20 mm/s Center Divided Points
1 4 2 5 3 6
(c) υ
Press = 1 mm/s
Eff
ective Strain
Time, t /s
Cut-Area Points Region I Region II
Center Center
X X
Y Y
-X -X
(a) υ
Press = 1 mm/s
Eff
ective Strain
Center Divided Points 1 4 2 5 3 6
(d) υ
Press = 20 mm/s
Time, t /s
Cut-Area Points Region I Region II
Center Center
X X
Y Y
-X -X
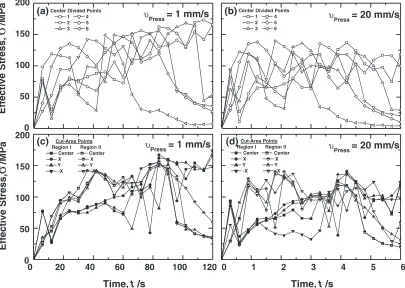
[image:4.595.92.505.462.759.2]above results, we can conclude that there is local instability of effective strain on the local position at slip plane, and highest strain is loaded on the area close to working direction (direction of working channel). However, the above com-ments are limited to the ECAE process of low passing numbers (in this simulation, first and second pass in route B). The chronological center-divided effective stress results indicate the fact that central points of rod had undertaken two peaks of stress at slip plane (points 2–6 in Figs.6(a) and (b)). Each effective stress peak has taken when the each point was passing the slip plane as an order from front area. It is notable that first peak is lower than second peak in low ram speed (Figs. 6(a) and (c)), on the other hand, opposite trend has been detected (higher stress peak at first working channel) in high ram speed (Figs.6(b) and (d)). Above result means good consistent with theoretical statement, i.e. if heat caused by severe hot working can elevate temperature of the material and there was no sufficient time of heat dissipation out, subsequently, the material would undergo more ductile deformation behavior at elevated temperature. As mentioned in modeling part, temperature was defined by the linear interpolation at each strain, thereafter, stress at each elevated temperature was defined by eq. (1) (see Table2and Fig.2), which implies that solver would take thermal behavior of material at higher temperature to calculate effective stress if the material’s temperature was elevated. Above statement is supported by instant comparison of Figs.6(a) to (b) and Figs.
6(c) to (d). Though higher pressing speed should have caused higher stress on material, general stress levels of effective stress in Figs. 6(b) and (d) are lower or nearly same with those of slow ram speed results (Figs.6(a) and (c)).
Effective stress results of cut-plane points differs to center-divided points results because the former was directed to local deformation and the later was directed to chronological analysis. In Figs.6(c) and (d), all points of each region show same trend that a gradual increase of effective stress and then stiff increase of effective stress at first slip plane (region I), and two peaks at channel of slip plane (region II).
The center-divided effective strain rate behavior shows similar chronological step behaviors for low and high ram speed (Figs.7(a) and (b), respectively). It was also detected two peaks at slip plane in all effective strain rate results. Notable difference in effective strain rate results varied by ram speed is the value of strain rate itself. In low speed (Fig.
7(a), 1 mm/s), effective strain rate at peaks ranges from 0.03– 0.05 s1, while that of high ram speed (Fig.7(b), 20 mm/s) ranges from 0.6–1.0 s1.
In cut-area points analysis, the highest peak of effective strain rate is observed in slip plane for both slow (0:07s1,
Fig. 7(c)) and high ram speed (1:4s1, Fig. 7(d)). It is
apparent that effective strain rate peaks at low speed (Fig.
7(c)), effective strain rates at peaks range from 0.04–0.07 s1,
while those of high ram speed (Fig. 7(d), 20 mm/s) range from 0.5–1.4 s1.
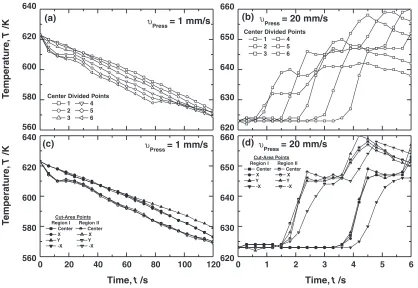
In Fig.8, significant differences between high and low ram press speed for both analyses of center-divided points and cut-plane points were detected. At high ram speed of 20 mm/ s, temperature of material was elevated at slip plane region, which means that severe working transformed to heat (Figs.
8(b) and (d)). On the other hands, at low ram speed of 1 mm/s, temperature of material has decreased linearly with time.
In Fig.8(a), temperature distribution history shows notable
0 20 40 60 80 100 120
0 50 100 150 2000 50 100 150 200
0 1 2 3 4 5 6
(c) υ
Press = 1 mm/s
Eff
ective Stress,
σ
/MP
a
Time, t /s Cut-Area Points
Region I Region II Center Center X X Y Y -X -X
(a) υ
Press = 1 mm/s
Eff
ective Stress,
σ
/MP
a Center Divided Points
1 4 2 5 3 6
(b) υ
Press = 20 mm/s
Center Divided Points 1 4 2 5 3 6
(d) υ
Press = 20 mm/s
Time, t /s Cut-Area Points
Region I Region II Center Center X X Y Y -X -X
[image:5.595.99.504.468.756.2]0.0 0.4 0.8 1.2 1.6 2.0
0.00 0.02 0.04 0.06 0.08 0.10
0 20 40 60 80 100 120
0.00 0.02 0.04 0.06 0.08 0.10
0 1 2 3 4 5 6
0.0 0.4 0.8 1.2 1.6 2.0
(b)
Center Divided Points υ Press = 20 mm/s1 4 2 5 3 6
(a)
υPress = 1 mm/sEff
ective Strain Rate
,
ε
/s
-1
Center Divided Points 1 4 2 5 3 6
(c)
υPress = 1 mm/s
Eff
ective Strain Rate
,
ε
/s
-1
Time, t /s
Cut-Area Points Region I Region II
Center Center X X Y Y -X -X
(d)
υPress = 20 mm/sTime, t /s
Cut-Area Points Region I Region II
Center Center X X Y Y -X -X
Fig. 7 Chronological effective strain rate results of center-divided points at (a) low ram speed and (b) high ram speed, and cut-plane points at (c) low ram speed and (d) high ram speed.
0 20 40 60 80 100 120
560 580 600 620 640
0 1 2 3 4 5 6
620 630 640 650 660 560
580 600 620 640
620 630 640 650 660
(c)
T
e
mperature
,
T
/K
Time, t /s Cut-Area Points
Region I Region II Center Center X X Y Y -X -X
(d)
Time, t /s Cut-Area Points
Region I Region II Center Center X X Y Y -X -X
(a) υ
Press = 1 mm/s
T
e
mperature
,
T
/K
υ Press = 1 mm/s
Center Divided Points 1 4 2 5 3 6
(b) υ
Press = 20 mm/s
υPress = 20 mm/s
Center Divided Points 1 4 2 5 3 6
[image:6.595.100.504.74.352.2] [image:6.595.91.509.433.721.2]drop in temperature for the slow ram speed (1 mm/s) simulation. It could be caused by relatively higher heat dissipation occurred during relatively slow deformation. Initial temperature of die, ram and material were set to 623 K and ambient temperature was set to room temperature (Table 3). By rule, heat dissipation occurred through plastic process with sufficient time, furthermore, caused material to be cooled. Consequently, solver calculated deformation behavior with stress-strain relation of cooled material and resulted in the trends like the former effective stress results (increased stress level for slow ram speed in Figs.6(a) and (c) and opposite trend in Figs.6(b) and (d)). On the other hand, apparent high level of working heat distribution at the points passing the slip plane area is shown in high press speed (Fig.
8(b), 20 mm/s.). This result suggests that there was insuffi-cient time to dissipate heat caused by severe working, therefore FVM solver calculated plastic flow by material at elevated temperature.
For the temperature distribution of cut-plane points, similar trends with center-divided results are revealed (Figs.
8(c) and (d));i.e.linear heat transfer to the surroundings in low ram speed and material heated with severe mechanical working. In Fig.8(d), there also appeared that reversed value of X and Y point from first channel to second channel like that of effective strain behavior (Figs.5(c) and (d)).
4. Conclusions
(1) Simulation of ECAE (route B) was carried out successfully. Local instability during ECAE was de-tected in the chronological analysis of effective strain, which has the processing intervals of 25%. Similar trend were shown in effective strain and effective strain rate behavior for both ram speed of 1 mm/s and 20 mm/s.
(2) Detailed results of localized mechanical and thermal properties in processing time were obtained by the local center-divided and cut-area points analyses in FVM simulation. The mechanical and thermal states during ECAE can be considered and predicted by the chron-ological distributions of the effective strain, effective stress, effective strain rate and temperature.
(3) Local instability of effective strain was detected by the cut-plane points analysis. In the local position at slip plane, higher effective strain was loaded on the area closer to the inner arc of the channel. However, most of deformation occurred at the slip plane agreeing with theoretical aspect.
(4) The effective stress result for slow ram speed was close to that of for high ram speed because relatively low heat dissipation rate for high ram speed elevated the temperature of material.
Acknowledgement
The authors give special acknowledgements to Mr. T. Kinoshita (Branch of Metal Forming Group, Technology Research Institute of Osaka Prefecture) who gave us realistic and useful advises for SUPERFORGE2002 and simulation analysis.
REFERENCES
1) V. M. Segal: Mater. Sci. Eng.A197(1995) 157–164.
2) R. Z. Valiev, A. V. Korznikov and R. R. Mulyukov: Mater. Sci. Eng. A168(1993) 141–148.
3) M. Furukawa, Z. Horita, M. Nemoto and T. G. Langdon:Modeling the mechanical responses of structural materials, ed. E. M. Talleff and R. K. Mahidhara, (The Minerals, Metals & Materials Society, 1997) pp. 165–172.
4) P. B. Berbon, M. Furukawa, Z. Horita, M. Nemoto, N. K. Tsenev, R. Z. Valiev and T. G. Langdon, Modeling the mechanical responses of structural materials, ed. E. M. Talleff and R. K. Mahidhara, (The Minerals, Metals & Materials Society, 1997) pp. 173–180.
5) S. Ferrasse, V. M. Segal, K. E. Hartwig and R. E. Gorforth: Metall. Trans.A28(1997) 1047–1057.
6) Y. Iwahashi, Z. Horita, M. Nemoto and T. G. Langdon:THERMEC97, ed. T. Chandra and T. Sakai, (The Minerals, Metals & Materials Soc., 1997) pp. 1945–1951.
7) Y. Iwahashi, Z. Horita, M. Nemoto and T. G. Langdon: Acta. Mater.45 (1997) 4733–4741.
8) H. G. Salem, R. E. Gorforth and K. T. Hartwig:Superplasticity and superplastic forming 1998, ed. A. K. Ghosh and T. R. Bieler, (The Minerals, Metals & Materials Soc., 1998) pp. 165–178.
9) P. B. Berbon, N. K. Tsenev, R. Z. Valiev, M. Furukawa, Z. Horita, M. Nemoto and T. G. Langdon:Superplasticity and superplastic forming 1998, ed. A. K. Ghosh and T. R. Bieler, (The Minerals, Metals & Materials Soc., 1998) pp. 127–134.
10) T. Mukai, T. G. Nieh, H. Watanabe and K. Higashi: Mater. Sci. Forum 304–306(1999) 109–114.
11) T. Mukai, M. Kawazoe and K. Higashi: Nanostruct. Mater.10(1998) 755–765.
12) T. Mukai, H. Iwasaki and K. Higashi: Mater. Sci. Eng.A247(1998) 270–274.
13) A. Gholinia, P. B. Prangell and M. V. Markushev: Acta. Mater.48 (2000) 1115–1130.
14) Z. Horita, M. Furukawa, M. Nemoto, A. J. Barnes and T. G. Langdon: Acta. Mater.48(2000) 3633–3640.
15) J. K. Kim, H. G. Jeong, S. I. Hong, Y. S. Kim and W. J. Kim: Scr. Mater.45(2001) 901–907.
16) S. Komura, M. Furukawa, Z. Horita, M. Nemoto and T. G. Langdon: Mater. Sci. Eng.A297(2001) 111–118.
17) M. Mabuchi, H. Iwasaki and K. Higashi: Nanostruct. Mater.8(1997) 1105–1111.
18) M. Mabuchi, H. Iwasaki and K. Higashi: Mater. Sci. Forum243–245 (1997) 547–552.
19) M. Mabuchi, K. Ameyama, H. Iwasaki and K. Higashi: Acta. Mater.47 (1999) 2047–2057.
20) A. Yamashita, Z. Horita and T. G. Langdon: Mater. Sci. EngA300 (2001) 142–147.
21) R. Z. Valiev: Mater. Sci. Forum243–245(1997) 207–216.
22) M. Furukawa, Y. Ma, Z. Horita, M. Nemoto, R. Z. Valiev and T. G. Langdon: Mater. Sci. Eng.A241(1998) 122–128.
23) D. P. DeLo and S. L. Semiatin: Metall. Trans.A30(1999) 2473–2481. 24) D. H. Shin, B. C. Kim, Y. S. Kim and K.-T. Park: Acta. Mater.49
(2000) 1285–1292.
25) K.-T. Park, Y. S. Kim, J. G. Lee and D. H. Shin: Mater. Sci. Eng.A48 (2000) 165–172.
26) W. J. Kim, J. K. Kim, W. Y. Choo, S. I. Hong and J. D. Lee: Mater. Lett.51(2001) 177–182.
27) D. P. DeLo and S. L. Semiatin: Metall. Trans.A30(1999) 1391–1402. 28) S. L. Semiatin, D. P. DeLo and E. B. Shell: Acta. Mater.48(2000)
1841–1851.
29) H. S. Kim: Mater. Trans. JIM42(2001) 536–538.
30) N. Chandra and S. C. Rama: J. Eng. for Industry-Trans. ASME114 (1992) 452–458.
31) N. Chandra, S. C. Rama and J. Rama: Mater. Sci. Forum170–172 (1994) 577–582.
32) R. S. Sadeghi and Z. S. Pursell: Mater. Sci. Forum170–172(1994) 571–576.
34) MSC/Superforge User’s Guide version 2002 release guide, (the MacNeal-Schwendler Co., Tokyo, Japan, 2002) pp. 2-29.
35) MSC/Superforge User’s Guide, (the MacNeal-Schwendler Co., Los Angeles, USA, 1998) pp. 1-1–7-98.
36) H. K. Versteeg and W. Malalasekera:An introduction to computational fliud dynamics: The finite control volume method, (Addison Wesley Longman limited, U.K., 1996) pp. 1-272.
37) Y. Iwahashi, J. Wang, Z. Horita, M. Nemoto and T. G. Langdon: Scr. Mater.35(1996) 143–146.
38) N. Ahmad, H. Combeau, J.-L. Desbiolles, T. Jalanti, G. Lesoult, J. Rappaz, M. Rappaz and C. Stomp: Metall. Trans.A29(1998) 617–630.
Appendix: Modeling of finite volume method in ECAE forming
A plastic deformation with large amount of deformation is a highly nonlinear and transient. Unlike the traditional finite element mesh which distorts while attempting to follow the deformation of material, the finite volume mesh solver performs calculation with a fixed frame of reference and the material simply flows through the finite volume mesh35)With this technique, it is available to simulate gross material flow and needs no remeshing techniques, commonly considered as the main bottleneck in 3-D large deformation simulations based on the finite element methods.
A.1 Finite element method and finite volume method. When a finite element solver is used, grid points are defined that are fixed to location on the body being analyzed. Elements of material are created by connecting the grid points together, and the collection of elements produces a mesh. As the body deforms, the grid points move with the material and the elements distort. The finite element solver is, therefore, calculating the motion of elements of constant mass. Because of the severe element distortion, using finite element solver technology in forging simulations will lead to the necessity of remeshing the finite element mesh frequently to follow the gross material deformation. Common problems associated with finite element based remeshing algorithms are degradation of the solution due to severe element distortion and excessive CPU processing times. In the finite volume solver, the grid points are fixed in space and the elements are simply partitions of the space defined by connected grid points. The finite volume mesh is a fixed frame of reference. The material of a workpiece under analysis moves through the finite volume mesh; the mass, momentum, and energy of the material are transported from element to element. The finite volume solver therefore calculates the motion of material through elements of constant volume. In a forging simulation the dies will act as a boundary to the flow of material in the finite volume mesh, while stresses in the material inside the finite volume mesh exert forces on the surface of the dies. Ahmad et al. adapted FVM and FEM to the two-dimensional simulation
solver of macro segregation analysis and benchmarked both results.38) They found differences appeared for FVM and FEM even though the final segregation behaviors were fairly well with the experimental findings.
A.2 Thermal material properties and friction coefficient In this work, we carried out comprehensive range of fully coupled, thermo-mechanical analyses in simulation. Those, which were dealt in simulation, are heating of material due to plastic work, specific heat, heat transfer, and thermal conductivity. Inherently, workpiece is heated during plastic deformation because plastic work will generate heat. How-ever, not more than 10% of this plastic work is stored (principally as dislocation). The rest work transformed and dissipated as heat.35) We assumed and set the fraction of plastic work to be converted to heat as 0.9.
Specific heat can be transformed to heat capacitance when multiplied by the volume and density of material. With this heat capacitance, we can calculate the proportionality constant between heat added or subtracted from the system and the resultant temperature rise or fall of the system:
q¼CT ðA1Þ
Heat transfer is the transport of heat from one to the other. If there is difference in workpiece and die surface, heat flux takes place across boundary layers of workpiece and die materials and it may be related to the difference between the temperature of workpiece and die:
q¼hðTTdieÞ ðA2Þ
Thermal conductivity is another intrinsic property of all materials and provides the proportionality constant between the flow of heat through a solid and the temperature gradient maintained across the solid (Fourier’s law):
q¼ krT ðA3Þ
Friction Models
Friction, which is caused when two surfaces are in contact and forced to move tangentially, has been issued in ECAE process. Actually, friction shear stresses developed at the interface fairly depend on workpiece-die interface condition, metal flow, pressure distribution, and load requirements. It is too difficult to consider above all for simulating deformation process. We designed friction factor simply by adapting plastic shear friction alternatively. If the friction shear stress exceeds a constant fractionmof the flow stress in shear, the workpiece starts to slip:
Friction Stress¼myield ðA4Þ