
The Effect of 800 MeV Proton Irradiation on the Mechanical Properties of Tungsten
5
0
0
Full text
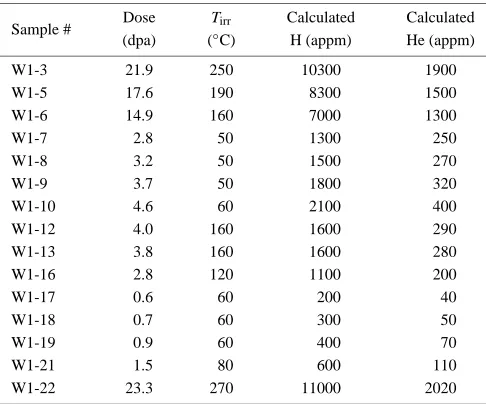
(2) 634. S. A. Maloy et al. Table 1 Irradiation conditions for tungsten specimens.. Sample #. Dose (dpa). Tirr (◦ C). Calculated H (appm). Calculated He (appm). W1-3 W1-5 W1-6 W1-7 W1-8 W1-9 W1-10 W1-12 W1-13 W1-16 W1-17 W1-18 W1-19 W1-21 W1-22. 21.9 17.6 14.9 2.8 3.2 3.7 4.6 4.0 3.8 2.8 0.6 0.7 0.9 1.5 23.3. 250 190 160 50 50 50 60 160 160 120 60 60 60 80 270. 10300 8300 7000 1300 1500 1800 2100 1600 1600 1100 200 300 400 600 11000. 1900 1500 1300 250 270 320 400 290 280 200 40 50 70 110 2020. (two sigma = 3.2 cm). Each tungsten rod was 10 cm long allowing the accumulation of a range of doses on each rod from the center of the rod to the ends. The fluence determination (see results in Table 1) for the irradiated samples was performed through analysis of an activation foil package that was irradiated in the center of each clad rod. The activation foil packages were Transmission Electron Microscopy-sized disks punched from >99.98% pure thin sheet material of Al, Fe, Co, Ni, Cu, and Nb. After irradiation, the stacks were withdrawn and counted by gamma spectroscopy to quantify the isotopes produced. This provided several reactions with various cross sections and thresholds, which were used to estimate the proton and neutron group fluxes. The production rates of the isotopes were calculated by taking into account the proton beam history and the measured activity. Proton and neutron flux estimates were calculated using the MCNPX code.20) The input fluxes were then adjusted to match the measured isotope production rates using the STAYSL2 code.21) The revised fluxes for protons and neutrons were then folded with He, H and dpa cross-sections for the materials of interest. This firmly established the exposure parameters at the activation foil locations. The error associated with the fluxes and damage levels was estimated to be around 25%. Irradiation temperatures of the clad tungsten rods were determined as a function of position along the rods using LAHET Code System22) calculated local power densities as input. The 2.6 mm diameter rods were located in an insert with only one other materials insert in the beam ahead of it. So this peak power density was 2250 W/cm3 . The 3.2 mm diameter rods were located in an insert behind several other inserts. So this peak power density was only 1020 W/cm3 . Thus, the larger, 3.2 mm diameter rods were irradiated at lower temperatures despite their larger diameters. For both inserts, there was more than a factor of 10 difference in power density between the tungsten at the beam centerline and at the ends of the rods. Cooling water temperatures were calculated locally from measured values of the initial water temperature. The cooling water temperature (To ) at the inlet of the bundle. was 27.6◦ C for the 2.6 mm diameter rods and 34.8◦ C for the 3.2 mm diameter rods. Tungsten irradiation temperatures, Tirr , (see Table 1) were calculated at each location along the rod as follows. First the heat transfer coefficient was calculated for the water flowing in the spaces between the 19 rods in the tube. The temperature drop from the clad surface to the cooling water (∆Tfilm ) was calculated by dividing the heat flux from the cladding by the heat transfer coefficient. The temperature difference across the clad thickness (∆Tclad ) was determined by calculating the contributions from the heat flux into the cladding from the tungsten and the power density in the cladding itself. The temperature difference across the helium gap (∆Tgap ) was calculated assuming heat transfer by conduction from the tungsten rod through the helium gas gap. The temperature rise from the tungsten rod surface to the rod centerline (∆Trod ) was calculated using the tungsten power density assuming radial heat conduction through the rod. The peak tungsten temperature (Tirr ) at each location along the rod was then calculated as: Tirr = To + ∆Tfilm + ∆Tclad + ∆Tgap + ∆Trod . Compression specimens were prepared from one irradiated 2.6 mm diameter rod and one irradiated 3.2 mm diameter rod by slicing the rod with a slow speed diamond saw into ∼ 3 mm long segments after it was removed from the clad capsule. The faces were then ground parallel using 600 grit SiC paper. The exact diameter and length of each specimen was measured before testing. Prior to compression testing, vacuum grease was applied to the ends of each specimen. Specimens were tested in compression at an initial strain rate of 10−3 s−1 using an Instron 5567 mechanical testing machine in a hot cell. Load/displacement data were converted to true stress/strain data using the initial measured specimen dimensions. The compliances from the test system were mathematically removed from each curve. Some specimens were mounted in epoxy and polished to finish with 1 micron diamond paste. Then, diamond pyramid hardness tests were performed using a Leitz Metallograph with a 400 g load. 4. Test Results The true stress/strain curves for the specimens irradiated at high doses (4–23 dpa) and low doses (0–4 dpa) are shown in Fig. 1 and Fig. 2, respectively. Each test was stopped after accumulating ∼ 20% plastic strain. Stress/strain curves for specimens irradiated at up to 4 dpa exhibited a larger yield drop compared to those irradiated at 4–23 dpa. A slightly higher yield stress was measured for the 0 dpa, 2.6 mm diameter specimen compared to that for the 0 dpa, 3.2 mm diameter specimen. The two highest dose tests shown in Fig. 1 exhibited a decrease in load from splintering of the specimen during testing. All tests exhibited an increase in yield stress with dose. Photographs were taken of the sides of the specimens after testing. Cracking typical of that observed on almost all irradiated specimens is shown in Fig. 3(b) compared to a nonirradiated specimen in Fig. 3(a) after compression testing to ∼ 20% strain. All irradiated specimens exhibited longitudinal cracking after testing except for one specimen (W1-7). This.
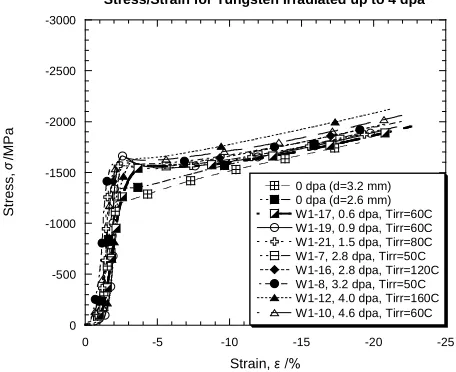
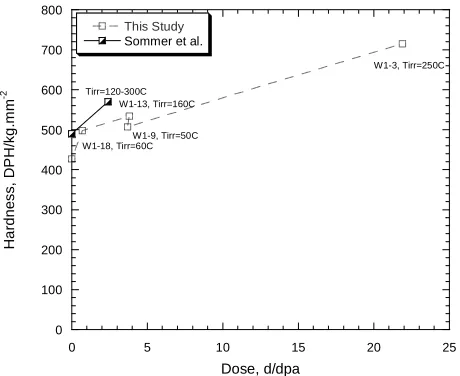
(3) The Effect of 800 MeV Proton Irradiation on the Mechanical Properties of Tungsten Stress/Strain Curves for Tungsten Irradiated to 4-23 dpa -3000. Stress, /MPa. -2500. -2000. -1500. 0 dpa (d=3.2 mm) 0 dpa (d=2.6 mm) W1-12, 4.0 dpa, Tirr=160C W1-10, 4.6 dpa, Tirr=60C W1-6, 14.9 dpa, Tirr=160C W1-5, 17.6 dpa, Tirr=190C W1-22, 23.3 dpa, Tirr=270C. -1000. -500. 0 0. -5. -10. -15. -20. -25. Strain,. Fig. 1 Graph showing stress/strain curves for tungsten tested in compression after irradiation in a proton beam to between 4 and 23 dpa at 60–270◦ C. Stress/Strain for Tungsten Irradiated up to 4 dpa -3000. Stress, /MPa. -2500. -2000. -1500 0 dpa (d=3.2 mm) 0 dpa (d=2.6 mm) W1-17, 0.6 dpa, Tirr=60C W1-19, 0.9 dpa, Tirr=60C W1-21, 1.5 dpa, Tirr=80C W1-7, 2.8 dpa, Tirr=50C W1-16, 2.8 dpa, Tirr=120C W1-8, 3.2 dpa, Tirr=50C W1-12, 4.0 dpa, Tirr=160C W1-10, 4.6 dpa, Tirr=60C. -1000. -500. 0 0. -5. -10. -15. -20. -25. Strain,. Fig. 2 Graph showing stress/strain curves for tungsten tested in compression after irradiation in a proton beam to a maximum dose of 4.6 dpa at 50–160◦ C.. was the lowest dose 2.6 mm diameter specimen (2.8 dpa) and it is possible that microcracking occurred that was not visible with the low magnification (16X) optical microscope used for analysis. The averages of five measured hardness values are plotted vs. dose in Fig. 4 (error in measurements is less than 2%). The hardness increased quickly up to 0.8 dpa but this rate decreased thereafter out to 4 dpa for the same irradiation temperature. The hardness continued to increase with increasing dose out to 23 dpa. 5. Discussion Compression testing has been performed on annealed polycrystalline tungsten by Chen and Gray23) at strain rates of 10−3 s−1 to 5000 s−1 . Our stress/strain curves on unirradiated tungsten compare well with their results for testing at a strain rate of 10−3 s−1 . Both show a yield stress between 1200 and 1400 MPa and a work hardening rate between 1500. 635. and 1800 MPa. Although both the 2.6 and 3.2 mm diameter rods were made by the same process at Plansee Corporation, their mechanical properties were slightly different because they came from two different heats of material. This can be seen in the 0 dpa stress/strain curves in Figs. 1 and 2. The yield stress for the 2.6 mm diameter rod is ∼ 100 MPa higher than that measured for the 3.2 mm diameter rod. This difference is quite small and is mainly caused by the presence of a yield drop in the 2.6 mm diameter rod. The work hardening rate after yielding is identical in both control materials. The effect of increasing dose on the mechanical property results can be separated into two different regimes. For irradiation to low doses up to 4 dpa, the yield stress after irradiation is similar, ∼ 1600 MPa. On the other hand, the yield drop after initial yield decreases with increasing dose to the point where a very small yield drop is observed after irradiation to 4 dpa. The yield drop occurs in unirradiated BCC (body-centered cubic) materials when dislocations break free from a “solute” atmosphere formed around the dislocation core. Then, the unpinned dislocations can multiply rapidly by a multiple cross-slip mechanism24) which results in a yield drop in the stress/strain curve. A similar mechanism may be occurring in irradiated tungsten as dislocations break free from interstitials that are pinning the initial dislocations. For irradiations to doses greater than 4 dpa, a small yield drop is still observed but significant increases in yield stress are observed from 1600 MPa up to 2200 MPa. This effect can be attributed to the increase in the density of vacancies and interstitial clusters caused by irradiation. This variation in yield stress with dose is captured in Fig. 5. Although the irradiation temperature varies between 50 and 270◦ C, this change is quite small with respect to tungsten’s melting temperature, 3387◦ C. Thus, the range in the homologous irradiation temperature is only between 0.095 and 0.160 and this low homologous temperature range is unlikely to be responsible for the change in the mechanical response observed here. These previously described stress/strain results suggest that for doses up to 4 dpa, the yield stress is controlled by the stress for dislocations to break free from pinning sites (∼ 1600 MPa), but as the density of interstitial clusters increases to the point that the stress to move dislocations through a “forest” of interstitial clusters is greater than 1600 MPa, the yield stress becomes controlled by the density of interstitial clusters and increases with dose from 4 to 23 dpa while a lower yield drop is observed. In future work, TEM analyses will be performed to investigate the relation of the irradiated microstructure to the measured mechanical properties. Hardness results obtained in the current study are compared in Fig. 4 to previous results by Sommer et al.17) An increase in hardness was reported after ∼ 2 dpa of exposure. For this material, the unirradiated hardness is 490 kg/mm2 which is higher than the unirradiated hardness for our material of 427 kg/mm2 . Thus, the change in hardness measured by Sommer et al. is 80 kg/mm2 after 2 dpa of exposure while our increase in hardness measured after 4 dpa is 80–106 kg/mm2 which seems to be in good agreement. The cracking observed on the sides of the compression specimens after irradiation are an indication of a decrease in ductility in tension. This decrease is probably due to:.
(4) 636. S. A. Maloy et al.. 3 mm (A). (B). Fig. 3 Optical micrographs of tungsten compression specimens after compression to ∼ 20% strain before irradiation (A) and after irradiation to 23.3 dpa (B). 800. Yield Stress vs. Dose This Study Sommer et al.. 700. 2500. /MPa. 2000. ys. Tirr=120-300C W1-13, Tirr=160C. 500. W1-9, Tirr=50C W1-18, Tirr=60C. Offset Yield Stress,. Hardness, DPH/kg.mm. -2. W1-3, Tirr=250C. 600. 400 300 200. 1500. 1000. 500. 100. T =50-270C irr. T. 0 0. 5. 10. 15. 20. 25. Dose, d/dpa. test. =25C. 0 0. 5. 10. 15. 20. 25. Dose, d/dpa. Fig. 4 Graph plotting the change in hardness with dose for tungsten after irradiation in a proton beam at 50 to 300◦ C.. 1) the higher yield stress and higher work hardening rate, which causes a critical stress for transgranular and intergranular fracture to be reached at a lower strain; and 2) irradiationinduced damage that acts a crack nucleation sites, both within grains (leading to transgranular fracture) and in grain boundaries (leading to intergranular fracture). Such a decrease in ductility has been observed in results from testing fission neutron and proton irradiated materials. Tungsten bend specimens irradiated in a 800 MeV proton beam to 2.4 dpa exhibited zero ductility (fracture in the elastic regime) at 150◦ C.17) In addition, fission neutron irradiated specimens (1 × 10²¹ neutrons/cm2 ) exhibited zero ductility after irradiation and testing at 300◦ C.9) They also exhibited an increase in DBTT by 150◦ C after irradiation at 385◦ C to 9 × 10²¹ neutrons/cm2 7) and an increase in DBTT of 165◦ C after irradiation to 9.5 × 10²⁰ neutrons/cm2 at 250◦ C.25) 6. Conclusions The effect of proton irradiation on the mechanical properties of tungsten has been measured by hardness and compres-. Fig. 5 Graph plotting 0.2% yield stress vs. dose for compression tests on tungsten irradiated up to 23 dpa at 50–270◦ C and a test temperature of 25◦ C.. sion testing after irradiation in a proton beam to a maximum dose of 23 dpa. The results showed the following: (1) The compressive yield stress of tungsten increases by almost a factor of 2 after irradiation to 23 dpa. (2) Specimens irradiated up to 4 dpa exhibited a larger yield drop in their compression stress/strain curves compared to those irradiated at 4 to 23 dpa. (3) Cracking was observed on the sides of compression specimens after testing suggesting a decrease in tensile ductility after irradiation. Acknowledgments This program benefited from a large collaboration involving scientists and engineers from numerous groups at Los Alamos National Laboratory as well as a materials working group consisting of representatives from Pacific Northwest National Laboratory, Oak Ridge National Laboratory, Sandia National Laboratories, Lawrence Livermore National Laboratory, Savannah River Technology Center, and Brookhaven.
(5) The Effect of 800 MeV Proton Irradiation on the Mechanical Properties of Tungsten. National Laboratory. We are indebted to all participants. I would also like to thank Robert Margevicius for helpful review of this paper. REFERENCES 1) M. W. Cappiello and E. Pitcher: Mater. Charact. 43 (1999) 73–82. 2) S. Wender: Preliminary Assessment of Spallation Options for Accelerator-Driven Transmutation, AAA-RPO-TRNS-01-0017, LAUR-01-1634, Los Alamos, NM, (Los Alamos National Laboratory, 2001) p. 20. 3) S. J. Pawel: Preliminary Materials Recommendation for a Solid Target Back-up for the SNS, SNS/TSR-0149, Oak Ridge, TN, Oak Ridge National Laboratory, (1999) p. 35. 4) M. Kawai, K. Kikuchi, H. Kurishita, J. Li and M. Furusaka: J. Nucl. Mater. 296 (2001) 312–320. 5) R. Koo: Trans. Metall. Soc. AIME, 227 (1963) 280–282. 6) M. J. Makin and E. Gillies: J. Inst. Metals 86 (1957) 108–112. 7) J. M. Steichen: J. Nucl. Mater. 60 (1976) 13–19. 8) B. L. Mordike: J. Inst. Metals 88 (1959) 272–275. 9) I. V. Gorynin, V. A. Ignatov, V. V. Rybin, S. A. Fabritsiev, V. A. Kazakov, V. P. Chakin, V. A. Tsykanov, V. R. Barabash and Y. G. Prokofyev: J. Nucl. Mater. 191–194 (1992) 421–425. 10) M. W. Thompson: Philos. Mag. 5(8) (1960) 278–296. 11) G. H. Kinchin and M. W. Thompson: J. Nucl. Energy 60 (1958) 275– 284. 12) Y. W. Kim and J. M. Galligan: Acta Metall. 26 (1978) 379–390. 13) L. K. Keys and J. Moteff: J. Nucl. Mater. 34 (1970) 260–280. 14) Y. Kim and J. Galligan: J. Nucl. Mater. 69–70 (1978) 680–682. 15) M. S. Anand, B. M. Pande and R. P. Agarwala: Indian J. Phys. 53A (1979) 35–40.. 637. 16) J. Cornelis, L. Stals, P. De Meester, J. Roggen and J. Nihoul: J. Nucl. Mater. 69–70 (1978) 704–707. 17) W. F. Sommer: Tungsten Materials Analysis Letter Report, LA-UR-95220, Los Alamos, NM, (Los Alamos National Laboratory, 1995) p. 51. 18) Plansee Corporation, A-6600 Reutte/Tirol, Austria. 19) S. A. Maloy, W. F. Sommer, R. D. Brown, J. E. Roberts, J. Eddleman, E. Zimmermann and G. Willcutt: in Materials for Spallation Neutron Sources, M. S. Wechsler, et al., Editors (The Minerals, Metals & Materials Society, 1998) pp. 131–138. 20) H. G. Hughes, K. J. Adams, M. B. Chadwick, J. C. Comly, H. W. Egdorf, S. C. Frankle, J. S. Hendricks, R. C. Little, R. MacFarlane, R. E. Prael, L. S. Waters, M. C. White, P. G. Young, Jr., F. X. Gallmeier and E. C. Snow: in ANS Proceedings of the 2nd International Topical Meeting on Nuclear Applications of Accelerator Technology, (American Nuclear Society: La Grange Park, IL, 1998) pp. 281–286. 21) M. R. James, S. A. Maloy, W. F. Sommer, P. D. Ferguson, M. M. Fowler, G. E. Mueller and R. K. Corzine: in Reactor Dosimetry: Radiation Metrology and Assessment, J. G. Williams, et al., Editors (ASTM: West Conshohoken, PA, 2001) pp. 167–174. 22) R. E. Prael and H. Lichtenstein: User Guide to LCS: The LAHET Code System, LA-UR 89-3014, Los Alamos, NM, Radiation Transport Group, (Los Alamos National Laboratory, 1989) p. 76. 23) S. R Chen and G. T. Gray: in Tungsten and Refractory Metals-1994, A. Bose and R. J. Dowling, Editors (Metal Powder Industries Federation: Princeton, NJ., 1994) pp. 489–498. 24) R. W. Hertzberg: Deformation and Fracture Mechanics of Engineering Materials, 3rd ed. (New York, NY: John Wiley & Sons, 1989) pp. 122– 125. 25) W. Lohmann: Materials Investigations for the SNQ Target Station-Progress Report 1985, Jul-2061, ISSN-0366-0855, (Kernforschungslange Juelich, 1986) p. 138..
(6)
Figure
Related documents