Densification and Structural Evolution in Spark Plasma Sintering Process
of Mechanically Alloyed Nanocrystalline Fe–23Al–6C Powder
Yuichiro Koizumi
1;*1, Takanori Tanaka
1;*2, Yoritoshi Minamino
1, Nobuhiro Tsuji
1,
Kiyoshi Mizuuchi
2and Yoshihira Ohkanda
21Department of Adaptive Machine Systems, Osaka University, Suita 565-0871, Japan
2Materials Science and Processing Lab., Osaka Municipal Technical Research Institute, Osaka 536-8553, Japan
Nanocrystalline Fe–23 at%Al–6 at%C alloy powder was produced by mechanical alloying of the mixture of iron powder and aluminum powder (Fe–25 at%Al) with methanol, and was consolidated into fully dense compact by spark plasma sintering (SPS) at 1273 K. The compacts have nanocrystalline microstructure composed of mixture of-phase grains and-carbide (Fe3AlC) grains whose average grain size is about
50 nm. Although relatively large grains were also observed in places, their sizes were not over a few micrometers. The mechanisms of the densification and the structural evolution during the SPS process are discussed.
(Received March 17, 2003; Accepted June 23, 2003)
Keywords: nanocrystal, Fe3Al, mechanical alloying, spark plasma sintering, iron, aluminum, carbide
1. Introduction
Fe3Al intermetallic compound has attractive features as
high temperature structural material, such as high strength,
good oxidation resistance1–3) and low-cost. However, their
commercial application has been limited due to their poor toughness at room temperature and limited workability. Grain refinement is one of the most promising methods to improve the room temperature toughness. Recently, excellent mechanical properties of ultra-fine grained or nanocrystalline
metal materials have been reported.4–7)Attempts to improve
the mechanical properties of Fe3Al by the
ultra-grain-refinement have been done as well.8–14) Nanocrystalline
Fe3Al powders have been produced by mechanical alloying
(MA).8–14) Ultra-fine grained bulky Fe3Al was successfully
obtained by consolidating the mechanically alloyed (MAed)
powder by HIP.14) Grain size of the Fe3Al compacts was
smaller than 100 nm. The ultra-fine grained Fe3Al exhibited
excellent strength and ductility. Yield stress about 2 GPa and compressive ductility of over 30% plastic strain were
obtained.14)However, the MA process and the HIP process
are both time-consuming and not so productive. The milling
time for obtaining the nanocrystalline Fe3Al was no less than
10 hours.14) In HIP process, powders must be sealed into
stainless steel capsules before the pressing. Degassing is also required before the sealing process. The encapsulated powder must be hold at high temperature under high pressure for several hours. More speedy processes are desirable.
Spark plasma sintering (SPS) is a newly developed sintering method which can produce relatively large (over
100 mm in diameter)15,16) and near-net-shape compacts of
high relative density much more rapidly than other conven-tional process such as pressure-less sintering, hot press and HIP. SPS has been applied to an increasing number of materials successfully. It is expected that rapid consolidation
of the MAed nanocrystalline Fe3Al powder is also possible
by applying SPS. Further, it has been reported that liquid hydrocarbons or alcohols, which were used as process-control agents (PCA) to inhibit adhesion of powder during MA, enhanced the alloying process, that is, nanocrystalline
Fe3Al was produced in a shorter milling time by the addition
of PCA.8,9) Therefore, the combination of PCA-added MA
proccess and SPS process is hopeful to shorten the processing time.
However, the influence of the PCA on the composition of MAed powder and the resultant microstructure of the compact is still unclear. Furthermore, the mechanisms of densification by SPS is also still under discussion, and therefore, structural evolutions during the SPS process is not
predictable at present. In this study, (Fe3Al)1xCx
nano-crystalline powder was produced by mechanical alloying of the mixture of iron powder and aluminum powder with methanol as PCA. The MAed powder was consolidated by SPS. The microstructures of the compacts were investigated in detail. The influence of PCA, the densification mechanism and the structural evolution in the SPS process are discussed.
2. Experimental Procedure
Elemental iron (10–100 mesh, 99 mass% purity) and aluminum (100 mesh, 99.78 mass% purity) powders were
mixed in an atomic ratio of3 : 1. 20 g of the mixed powder
and 1 ml of methanol were loaded in a stainless steel (SUS304) vessel with 238 g of stainless steel (SUS304) balls with a diameter of 4 mm under an argon atmosphere. The inner diameter of the vessel is 50 mm. MA was carried out with a high-energy planetary ball mill (Kurimoto, BX254E) at a centrifugal force of 120 G for 7.2–518.4 ks.
The MAed powders were consolidated with an SPS apparatus (IZUMI TECHNOLOGY, SPS-1020) under a vacuum of 2 Pa at 1073–1273 K with a sintering pressure of 32 MPa. Cylindrical graphite dies and punches were used. The inner and outer diameters of the die were 30 mm and 70 mm, respectively. 15 g of the powder were charged in the die and heated under the pressure of 32 MPa. This applied
*1Corresponding author, E-mail address: [email protected] *2Graduate Student, Osaka University. Present address: JFE Steel
pressure is limited by the strength of the graphite die and punches. The heating rate was 1.67 K/s (100 K/min) and the holding time was 300 s. The temperature was measured by a thermocouple inserted into a hall (2 mm in diameter and 10 mm in depth) drilled on the outer cylindrical surface of the die.
The microstructures of the powders and the compacts were characterized by optical microscopy, X-ray diffraction method (XRD), scanning electron microscopy (SEM) and transmission electron microscopy (TEM). The volume fractions of voids in the compacts were evaluated from the optical micrographs on cross sections of the compacts using an image analyzing software (NIH image). The variations of relative density during the SPS processes were estimated from the movements of the piston of the SPS apparatus and the final volume fraction of the voids in the compacts after
consolidation.17)The composition analysis was carried out by
means of an electron probe X-ray microanalysis (EPMA) at an acceleration voltage of 15 kV. A cold fin for prohibiting a contamination of specimen’s surface was used in the analysis in order to measure the concentration of carbon accurately. Disks for TEM observation were cut parallel to the pressure axis from the center of the compacts by electro-discharge
machining. They were mechanically ground to 30mmthick.
The final thinning was done with an atom-milling machine.
3. Results
3.1 Mechanical alloying
Figure 1 shows the X-ray diffraction profiles of the powders MAed for various periods. The as-mixed powder
exhibits sharp peaks from pure Al and pure-Fe. After MA
for 7.2 ks, the peaks from Al had almost disappeared and the
peaks from-Fe became broad. After the peaks from the
-Fe became broader at 14.4 ks, they became sharper at further milling times. This suggests that the grain growth has occurred after 14.4 ks. The powder milled for 14.4 ks was chosen for sintering experiments, since it had the smallest
grain size. The grain size estimated by Scherrer’s equation18)
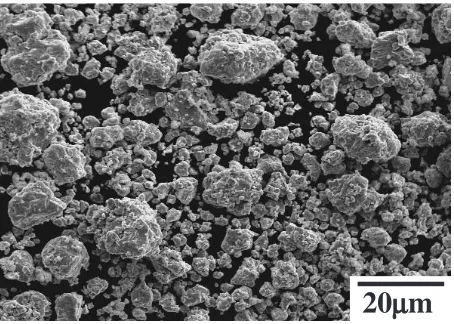
was 5 nm. Figure 2 shows the SEM image of the powder milled for 14.4 ks. The shapes of the powder particles are almost equiaxed. The size of the particles varies from
sub-micron to approximately 20mm. The volume-weighted
average of the size of the powder particle was 6mm.
3.2 Compacts consolidated by SPS
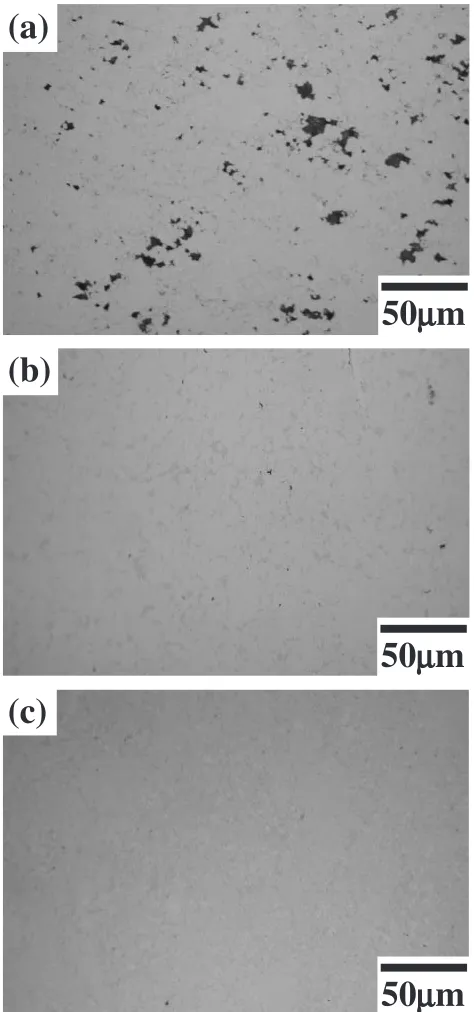
Figures 3(a)–(c) show optical micrographs on cross sections of the compacts spark-plasma-sintered (SPSed) at various temperatures. Voids were observed as black areas or dots. The compact SPSed at 1073 K has a lot of voids (Fig. 3(a)), while those SPSed at 1173 K and 1273 K have almost no void (Figs. 3(b) and (c)).
Figures 4(a)–(c) show the variations of relative densities during the SPS process at various sintering temperatures as a function of sintering time. The variations of the temperature are indicated together by dashed lines. The initial relative densities were about 0.65. The relative densities were almost constant while the temperatures were below about 800 K. They began to increase gradually when the temperature exceeded about 800 K. When the temperature was kept at 1073 K, the rate of the densification suddenly decreased as shown in Fig. 4(a). Although the relative density continued to increase at slower rate, the final relative density was no more than 0.837. On the other hand, when the temperature was raised to 1173 K or 1273 K (Figs. 4(b), (c)), the relative density continued to increase rapidly until they reached the almost full densities of 0.995 and 0.996 at 1173 K and 1273 K respectively.
Figures 5(a), (b) and (c) show the SEM backscattered electron (BSE) images of the compacts consolidated by the SPS at 1073 K, 1173 K and 1273 K, respectively. Three kinds of solid areas exhibiting different brightness were observed in every compact. Although voids also exhibits dark images as well as the area of high concentration of light elements in the BSE images, one can distinguish the voids by comparing the BSE images with the optical micrographs of the same area.
Intensity (arb.
unit)
100° 80°
60° 40°
20°
2
θ
14.4ks
86.4ks
172.8ks α-Fe
Al
7.2ks as-mixed
Fig. 1 X-ray diffraction profiles showing structural evolution during mechanical alloying of the mixture of Fe powder and Al powder (Fe– 25 at%Al) with doped methanol.
20
µ
m
[image:2.595.314.541.72.234.2]Except for voids, the brightest, the darkest and middle gray images were named B-area, D-area and M-area respectively. In the compact SPSed at 1073 K, M-areas, whose sizes
were smaller than 10mm, were observed. Each M-area
probably corresponds to the powder particle since their sizes are comparable to the size of the as-MAed powder particles. Mixtures of the three kinds of small areas were observed between the micron-sized M-areas with significant amount of voids together. In the compact SPSed at 1173 K, the microstructure is similar to that in the compact SPSed at 1073 K except that there is almost no void. In contrast, the quite different microstructure was formed at 1273 K. Small dark dots were observed inside of the M-areas. The B-areas
were much larger.
Table 1 shows the fractions of the three kinds of the solid areas except for the voids. The area fractions in the compacts SPSed at 1073 K and 1173 K were similar to each other. In contrast, the area fractions of the B-area and the D-area in the compact SPSed at 1273 K were considerably different from those of the compacts SPSed at lower temperatures. The area fraction of the B-area was 4–6% larger, and that of the D-area was 5–7% smaller than in the compacts SPSed at lower temperatures.
Table 2 shows the chemical compositions measured by
(c)
(b)
(a)
50
µ
m
50
µ
m
50
µ
m
Fig. 3 Optical micrographs on cross sections of the compacts consolidated by SPS at (a) 1073 K, (b) 1173 K and (c) 1273 K.
Relative Density,
D
1.0
0.9
0.8
0.7
0.6
0.5
0.4
600
400
200
0
1400
1200
1000
800
600
400
(a)
Temperature,
T
/K
Time,
t
/s
800
600
400
200
0
1400
1200
1000
800
600
400
(b)
Relative Density,
D
Temperature,
T
/K
Time,
t
/s
800
600
400
200
0
1400
1200
1000
800
600
400
(c)
Relative Density,
D
Temperature,
T
/K
Time,
t
/s
1.0
0.9
0.8
0.7
0.6
0.5
0.4
1.0
0.9
0.8
0.7
0.6
0.5
0.4
[image:3.595.51.288.71.577.2] [image:3.595.312.542.71.595.2]EPMA at each area in the compact SPSed at 1273 K, which has the maximum relative density. Significant amounts of carbon were included in every area. This carbon is supposed to be from the methanol which might have been decomposed during the MA process. Such carbon from PCA has been
observed in MAed Ti–Al alloy as well.19)Small amount of
chromium and nickel from the stainless steel balls and the vessel used in the MA process were also included in every area. The mean composition of the compact roughly estimated from the volume fraction and the composition of each area (Tables 1 and 2) is Fe–22.6 at%Al–6.0 at%C– 0.3 at%Cr–0.2 at%Ni. If all the carbon included in the methanol was doped into the mechanically alloyed powder, the chemical composition of the loaded powder should be Fe–23.5 at%Al–5.7 at%C (impurities in elemental powders, oxygen and hydrogen in the methanol are neglected). These
measured and prepared compositions are quite similar to each other. This means that almost all carbon in the methanol was alloyed into the powder during the milling process. The
atomic ratio of iron and aluminum (3 : 1) was maintained in
the M-area. The concentrations of aluminum and carbon in the B-area were about 4 at% lower and 1 at% lower than in the M-area, respectively. On the other hand, the concen-trations of aluminum and carbon in the D-area were 4 at% higher and 1 at% higher than in the M-area, respectively. Since the D-areas were so small compared to the electron probe size in the EPMA that the X-rays from the surrounding M-area might be included in the measurement. Therefore, the actual concentrations of aluminum and carbon in the D-area are probably higher than 27 at% and 7 at%, respectively.
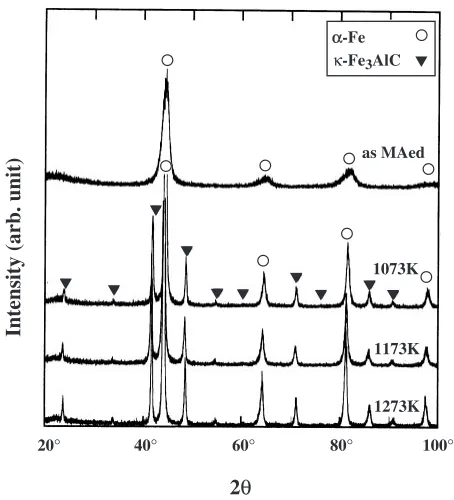
Figure 6 shows the X-ray diffraction profiles of the as-MAed powder and the compacts SPSed at various
temper-atures. While only the peaks from -Fe are seen in the
(b)
(c)
(a)
10
µ
m
10
µ
m
10
µ
m
[image:4.595.55.284.77.543.2]Fig. 5 SEM backscattered electron images of the compacts consolidated by SPS at (a) 1073 K, (b) 1173 K and (c) 1273 K.
Table 1 Fractions (%) of the areas showing different brightness in SEM backscattered electron images of the compacts consolidated by SPS at various temperatures.
Temperature,T/K Area
Bright Middle Dark
1073 11.7 78.3 10.0
1173 10.1 82.0 7.9
[image:4.595.304.550.106.171.2]1273 15.7 81.0 3.3
Table 2 Chemical compositions (at%) of the areas with different bright-ness in the compact consolidated by SPS at 1273 K.
Area Fe Al C Cr Ni
B-area Bal. 19.2 5.1 0.3 0.2 M-area Bal. 23.1 6.1 0.3 0.2
D-area Bal. 27 7 0.3 0.1
20° 40° 60° 80° 100°
2θ
Intensity (arb. unit)
α-Fe κ-Fe3AlC
as MAed
1073K
1173K
1273K
[image:4.595.307.548.217.270.2] [image:4.595.313.540.507.757.2]profiles of the as-MAed powder, the peaks from -Fe3AlC
carbide are seen in addition to the peaks from-Fe in every
profile of the SPSed compacts. This means that-carbide was
formed during the SPS process and that all the compacts
consist of-Fe and -carbide. Therefore, the D-areas in the
SEM images are thought to be-carbide phases. The peaks
from the -Fe are sharper in the profiles of the SPSed
compacts than in the profile of the as-MAed powder. This indicates that grain growth have occurred during the SPS process at every temperature tested. No superlattice reflection
from ordered Fe3Al was observed. This is probably due to the
carbon addition which might inhibit the formation of the ordered structure.
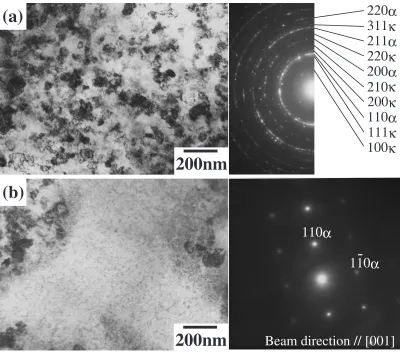
3.3 Microstructure observation by TEM
Figures 7(a) and (b) show the TEM microstructures in the compact SPSed at 1273 K. The compact was mainly composed of the Nano-grains with average grain size of 50 nm as shown in Fig. 7(a). The corresponding selected area diffraction pattern (SADP) taken by the use of an aperture of
0.5mm in diameter is also shown beside the image. The
SADP indicates that-Fe and-carbide (Fe3AlC) with E21
structure coexist in the nano-grained area. This area is thought to correspond to the M-area which had the largest area fraction among the three kinds of areas in the SEM backscattered electron image (Fig. 5(c)). Besides the
nano-grains, relatively coarse grains with grain size above 1mm
were observed as shown in Fig. 7(b). The SADP indicates
that such large grains are also-Fe. Faint and small dots were
seen within such large grains. These dots imply the existence of defects or nano-sized particles. In the case that the reflecting condition was nearly equal to the Bragg’s con-dition, such large grains exhibited mottled contrast indicating the existence of wavy coherency strain fields. An example of such mottled contrast is shown in Fig. 8 with the correspond-ing SADP together. In the SADP, spots of 110 reflection from
-carbide were found at fixed positions in addition to the
diffraction pattern of-Fe. Therefore, the dots in the coarse
-grain are thought to be coherently precipitated-carbide
particles. Since the intensity of the diffraction spots from
-carbide are weaker than in the SADP of the nano-grained
area, it seems that the amount of or-carbide or carbon in this
region is smaller than in the nano-grained area. Accordingly,
the large-grains are thought to correspond to the B-area in
[image:5.595.98.498.406.758.2]the BSE image (Fig. 5(c)).
Figure 9 shows the dark field image of a relatively large
-carbide grain with the corresponding SADP together. The
200 reflection indicated by an arrow was used for the
imaging. Since the200reflection is very close to thef110g
ring, some small-grains are also seen together. The size of
the-carbide grain is over 500 nm. Similar coarse-carbide
grains were observed in places. Such coarse-carbide grains
(a)
(b)
100κ
311κ
220κ
200κ
110α
220α
211α
200α
111κ
110α
110α
-Beam direction // [001]
210κ
200nm
200nm
are considered to correspond to the D-area in the BSE image (Fig. 6(c)).
4. Discussion
4.1 Densification mechanism in the SPS process
Densification mechanisms in SPS processes are under discussion, while the densification mechanisms in HIP process have been investigated in detail. The variation of relative density during HIP process has already been
under-stood quantitatively.20) Arzt et al.20) considered ‘plastic
yielding’, ‘power-law-creep’ and ‘diffusion from the particle contact boundary to the void surface’ as main densification mechanisms in HIP. They derived equations expressing the relative densities obtained by these mechanisms as functions of time, temperature, pressure and some parameters which depend on the material, for example, diffusion coefficients, yield stress and so forth.
Generally speaking, there are two fundamental differences between the densification by SPS and that by HIP. The first is that the spark between powder particles may occur in the SPS, although it has not been confirmed yet directly. However, the effect of the spark on the kinetics of the densification in the SPS process of this study is thought to be very small as explained below. The spark at the gaps between powder particles should occur more frequently in the early stage of the densification than in the later stage since the number of the gaps decreases with increasing relative density. If the spark significantly contribute to the densifi-cation, the relative density would increase rapidly in the early stage of the SPS process. On the contrary, the experimentally measured variation of the relative density was very small in the early stage (Fig. 4). Therefore, it can be said that the contribution of the spark to densification is quite small. The second difference is that the applied pressure is unidirectional in SPS while it is isostatic in HIP process. On the other hand, it has been known that quasi-isostatic pressing can be used as an alternative to HIP. In quasi-isostatic pressing, a compact is embedded in a die filled with a granular powder. It is possible to apply isostatic pressure to the embedded compact by utilizing a granular powder as a pressure-transmitting
medium.21) Since the powder particles produced in the
Beam direction//[110]
-
α
200nm
110
α
001
α
110
κ
2110
κ
1000
double diffraction
(a)
(b)
(c)
Fig. 8 (a) Bright field image of a coarse grain taken with beam direction near [1110] direction of-Fe. (b) Corresponding SADP. (c) Indices of spots surrounded by white lines in (b).
200
κ
κ−
grain
500nm
[image:6.595.117.479.72.364.2] [image:6.595.47.290.416.622.2]present study are granular (Fig. 2), the stress is also isostatic in the inner part of the compact except for near the surface. On the other hand, the stress is not isostatic near the surface of the compact because of the friction between powder particles and the inner surface of the die and the punches. But the friction should be very small in the case of this study, since the die and the punches are made of graphite, which has low friction coefficient, and the applied pressure is relatively small (32 MPa). Therefore, it is likely that the effect of the friction is quite small and the stress is almost isostatic in the most part of the compact in the SPS process with the graphite die and punches as well as in HIP. Accordingly, the densification theory for HIP can be roughly applied to the densification by the SPS process. The variation of the relative density during the SPS process was calculated by utilizing the equations for the densification by HIP as in the following.
Azartet al.20)presented equations expressing the variation
of the relative density by each elemental mechanism as in the followings on the assumption that the stress is isostatic. The
relative density obtained by plastic yielding (yield) is
expressed as follows:
if0:9,
yield¼0þ
1þ ffiffiffiffiffiffiffiffiffiffiffiffiffiffiffiffiffiffiffiffiffiffiffiffiffiffiffiffiffiffiffiffiffiffiffiffiffiffi1þ ð10pÞ=ð3yÞ
p
20 ð1Þ
if >0:9,
yield¼1exp 3p
2y
ð2Þ
whereis the relative density,0the relative density at start
of pressing,ythe yield stress of the powder particle material
andpthe applied pressure.
The densification rate by power-law-creep (_PLC) is
expressed as follows:
if0:9,
_
PLC¼5:3 ð20Þ1=3
x
R""_0 peff
30
n
ð3Þ
if >0:9,
_
PLC¼
3 2""_0
ð1Þ f1 ð1Þ1=ngn
3peff 2n0
n
ð4Þ
wherexis the neck radius,Rthe particle radius, (""_0,0,n) the
power-law creep parameters andpeffthe effective pressure.
The densification rates by diffusion (_diffusion) is expressed
as follows:
if0:9,
_
diffusion¼ 122
0R3gðÞ
ðDbþsDvÞ
kT Zpeff
gðÞ ¼ ½ð=0Þ2=31f7:3þ15:5½ð=0Þ2=31=4g
ð5Þ
if >0:9,
_
diffusion¼54
ðDbþrDvÞ
kTR3 hðÞ peff
hðÞ ¼ ½1 ð1Þ2=3=f3ð1Þ2=3 ½1þ ð1Þ2=3lnð1Þ 3g
ð6Þ
whereDb is the grain boundary diffusion coefficient times
the boundary thickness,sthe radius of curvature of neck,Dv
the lattice diffusion coefficient,the atomic volume,kthe
Boltzmann constant, T the temperature, Z the average
number of contact neighbors per particle and r the pore
radius.
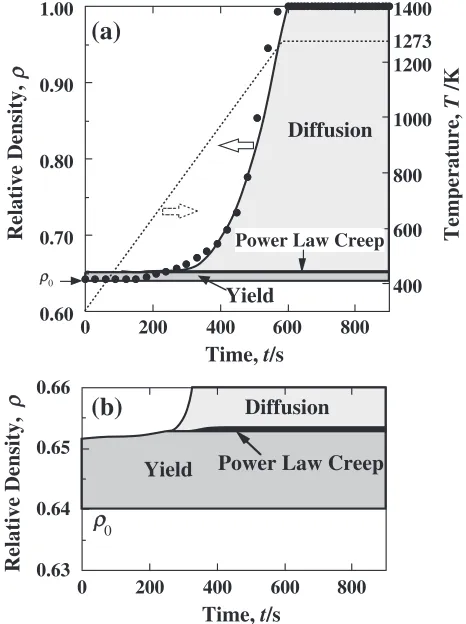
The relative densities were calculated using these eqs. (1)– (6). The details of the parameters used in the calculation are shown in Appendix. Figure 10(a) shows the calculated relative density as a function of time for the applied pressure
(p) of 32 MPa and the sintering temperature (T) of 1273 K
with the experimental data for comparison. The calculated relative density and the experimentally measured relative density are shown by a thick line and solid circles respectively. The calculation is fairly in good agreement with the experimental data except that there is small deviations in the initial stage and just before the full density is obtained at about 600 s. This indicates that the stress condition in the SPS is quite similar to that in HIP, that is, the stress is homogeneous and isostatic. Therefore, the variation of the relative density in the SPS process can be understood by the same densification mechanisms as in HIP.
The increment of the relative density is divided into three parts corresponding to the three elemental densification mechanisms; the diffusion mechanism, the power-law-creep mechanism and the plastic yield mechanism, as shown in Figs. 10(a) and (b). In the initial stage (from 0 s to about
200 s), the calculated increases only by the plastic yield.
0.63 0.64 0.65 0.66
0 200 400 600 800
Relative Density,
ρρ
Time,
t
/s
Yield
Power Law Creep
Diffusion
(b)
ρρ
0 0.60 0.70 0.80 0.90 1.00 400 600 800 1000 1200 14000 200 400 600 800
Relative Density,
ρρ
Tem
p
erature
,
T
/K
Time,
t
/s
Yield
Diffusion
1273ρρ0
(a)
[image:7.595.311.544.434.746.2]Power Law Creep
The experimentalwas a little smaller than the calculated. This is probably attributed to the difference between the yield stress of the powder particles produced by MA in this study and that used in the calculation, which is the yield stress of
cast alloy.22)The MAed powder has nanocrystalline
micro-structure, while the cast Fe–Al–C alloy has a coarse-grained microstructure. The nanocrsytalline powder is considered to be much harder than the coarse-grained ingots.
In the middle stage (from about 200 to about 600 s), the
calculated rapidly increases mainly by the diffusion
mechanism. The power-law-creep also partly contributes to
the densification in this stage, although the increment ofby
the power-law-creep is small (about 0.001). The quite small contribution of the plastic yield and the power-law-creep is in contrast with the general case of HIP process where plastic yield and power-law-creep significantly contribute to the
densification of metal powders.20)This is probably due to the
small applied pressure of 32 MPa, which is limited by the strength of the graphite die and punches used in the SPS apparatus. The relative density reaches almost 1 around 600 s, and therefore, there is no change in the relative density in the subsequent holding time, that is, in the final stage (after about 600 s). The small deviation between the calculation and the experimental data at the end of the middle stage may be inaccuracy of the parameters used and/or the structural evolution at high temperature as noted in the next section.
4.2 Formation mechanism of coarse-grains
The coarse-grains are considered to correspond to the
B-area in the SEM image (Fig. 5). The B-B-areas are distributed around the M-areas whose size is comparable to that of the as-MAed powder particles. Therefore, it is likely that the coarse grains were formed near the surface of the powder
particles. The formation of the coarse-grain near the surface
of the powder particles can be explained as below. The localized heating can occur during SPS process since the Joule heat is concentrated at narrow necks and contacts between powder particles. The temperature at such parts should be higher than the temperature measured at the die. According to a Fe–Al–C ternary equilibrium phase
dia-gram,23)the composition of the MAed powder is in theþ
dual phase region at the sintering temperature of 1273 K.
However, the -phase can be formed at parts where the
localized heating occur since the-phase is stable in a wider
range of composition at higher temperature. Then, the
amount of the -carbide precipitates dispersion decreases
since a large amount of carbon can dissolve into -phase
from the carbides. Therefore, the inhibition of the grain
growth by carbides becomes weak in the-phase so that the
-grains can grow rapidly. The coarsened -grains are
considered to transform into the coarse -grain during
cooling by massive transformation. The massive
transforma-tion from -phase to -phase has been seen in the Fe–Al
binary alloys.24)In the case of the massive transformation,
one-grain transforms into one or small number of-grains
since the=interface move very quickly. In contrast, in the
case of the diffusional transformation, one-grain would be
divided into a certain number of small -grains forming a
cluster. In practice, the coarse -grains were observed
separately not in cluster. Furthermore, in the case of the
massive transformation, the -carbides would precipitate
within the -grain after the transformation since carbon
should be excessively solved in the -grains just after the
massive transformation. This coincides with the fact that the
nano-sized -carbides have precipitated in the coarse
-grains. Thus, the formation of the coarse -grains can be
attributed to the inhomogeneity of heating, the formation of
the -grain and the to massive transformation. The
localized heating and the formation of the coarse grains may be responsible for the fact that the experimentally measured relative density was slightly higher than the calculated one just before the temperature had reached 1273 K in the SPS process (Fig. 10(a)).
5. Conclusions
In the present study, nanocrystalline Fe–23 at%Al–6 at%C powder was produced by mechanical alloying of elemental powderes of iron and aluminum with methanol. The nano-crystalline powder could be consolidated into fully dense compacts with nanocrystalline microstructure in a very short time of 600 s by means of the SPS process at 1273 K. The average grain size of the nanocrystalline microstructure was 50 nm. Although relatively large grains were partly formed,
their grain sizes (1mm) were much smaller than those
formed by conventional thermo-mechanical treatment. Therefore, it is still expected that the compacts exhibit superior mechanical properties. Furthermore, the calculation results of the variation in the relative density during the SPS process indicated that the densification proceeds mostly due to the diffusion. This implies that much faster densification at lower temperature would be possible by increasing the applied stress to the level where the plastic yield and the power-law-creep can contribute to the densification. It would realize more homogeneouly nanocrystallined microstructure.
Acknowledgements
This work was supported by ‘‘Priority Assistance of the Formation of Worldwide Renowned Centers of Research - The 21st Century COE Program (Project: Center of Excellence for Advanced Structural and Functional Materials Design)’’ from the Ministry of Education, Sports, Culture, Science and Technology of Japan.
REFERENCES
1) C. G. McKamey, J. H. De Van, P. F. Tortorelli and V. K. Sikka: J. Mater. Res.6(1991) 1779–1805.
2) K. Giza, H. Bala, J. J. Wyslocki and S. Szymura: Intermetallics 6
(1998) 357–362.
3) C. T. Liu, E. H. Lee and C. G. McKamey: Scr. Metall.23(1989) 875– 880.
4) S. X. McFadden, R. S. Mishra, R. Z. Valiev, A. P. Zhilyaev and A. K. Mukherjee: Nature398(1999) 684–686.
5) F. A. Mohamed and Y. Li: Mater. Sci. Eng.A298(2001) 1–15. 6) S. Takeuchi: Scr. Mater.44(2001) 1483–1487.
7) H. Hidaka, T. Tsuchiyama and S. Takaki: Scr. Mater.44(2001) 1503– 1506.
11) E. Bonetti, G. Scipione, G. Valdre, S. Enzo, R. Frattini and P. P. Macri: J. Mater. Sci.30(1995) 2220–2226.
12) L. He and E. Ma: Mater. Sci. Eng.A204(1995) 240–245. 13) L. He and E. Ma: J. Mater. Res.11(1996) 72–80.
14) S. M. Zhu and K. Iwasaki: Mater. Trans., JIM40(1999) 1461–1466. 15) M. Tokita: J. Soc. Powder Tech. Japan 30 (1993) 790–804.
(in Japanese)
16) O. Yanagisawa, T. Hatayama and K. Matsugi: Materia Japan33(1994) 1489–1496. (in Japanese)
17) K. Mizuuchi, M. Fukusumi, M. Sugioka, M. Tanaka, M. Itami and Y. Okanda: Kagaku-to-Kogyo74(2000) 100–105. (in Japanese) 18) B. D. Cullity: Elements of X-ray Diffraction, (Adddison-Welsley
Publishing Company, Inc., Reading, 1978).
19) K. Ameyama, O. Okada, K. Hirai and N. Nakabo: Mater. Trans., JIM
36(1995) 269–275.
20) E. Arzt, M. F. Ashby and K. E. Easterling: Metall. Trans. A14A(1983) 211–221.
21) E. A. Olevsly, E. R. Strutt and M. A. Meyers: J. Mater. Proces. Tech.
121(2002) 157–166.
22) R. G. Baligidat, A. Radhakrishna, A. Datta and V. V. Rama Rao: Mater. Sci. Eng.A313(2001) 117–122.
23) M. Palm and G. Inden: Intermetallics3(1995) 443–454.
24) J. J. Wits, T. A. Kop, Y. V. Leeuwen, J. Seitsma and S. V. D. Zwang: Mater. Sci. Eng. AA283(2000) 234–241.
25) D. V. Kolluru and R. G. Baligidad: Mater. Sci. Eng.A328(2002) 58– 61.
26) Z. S. Toˆkei, J. Bernardini and D. L. Beke: Acta Mater.47(1999) 1371– 1378.
27) H. Mehrer, M. Eggersmann, A. Gude, M. Salamon and B. Sepiol: Mater. Sci. Eng.A239–240(1997) 889–898.
Appendix
Parameters used in the calculation of the densification rates are shown below.
y (yield stress of particle material):
Yield stresses of Fe–28.5 at%Al–1.1 at%C was used.22)
Yield stresses at temperatures where there is no data were estimated by interpolation.
_
"
"0,0,n(power-law creep parameters):
Parameters evaluated from the creep test data of Fe3Al–
0.5 mass%C were used.25)
Db(grain boundary diffusion coefficient times the boundary
thickness):
Data of grain boundary diffusion of Fe in Fe–25 at%Al
were used.26)
Dv(lattice diffusion coefficient):
Data of self-diffusion of Fe in Fe–26.5 at%Al were used.27)
(atomic volume):1:221019m3
Mean atomic volume of Fe3Al (Fe–25 at%Al) at room
temperature was used.
R(particle radius): 6mm
Average particle size was measured from a SEM image of the mechanically alloyed powders.
Thex, thepeff, thes, theZand ther, which are functions of
the relative density (), were calculated from the parameters
shown above using the equations developed by Arztet al.20)
![Fig. 8(a) Bright field image of a coarse grain taken with beam direction near [110�] direction of �-Fe](https://thumb-us.123doks.com/thumbv2/123dok_us/369002.534355/6.595.47.290.416.622/bright-eld-image-coarse-grain-taken-direction-direction.webp)