JOURNAL OF FOREST SCIENCE, 58, 2012 (5): 225–233
The nun moth Lymantria monacha Linnaeus,
1758 (Lepidoptera: Lymantriidae), is one of the most important pest insects in pine and spruce for-ests in Germany. In the federal state of Branden-burg, 72% of the forest and woodland area is
domi-nated by Scots pine Pinus sylvestris L. Annual risk
assessments of Scots pine stands in Brandenburg and subsequent decisions on the application of insecticides are based on operational surveillance
data on L. monacha. Insecticides should be applied
only in the areas in which complete defoliation and subsequent death of a proportion of the pines are expected.
Lymantria monacha has been monitored in Brandenburg by a stepwise surveillance method for many years. Large-scale, approximate monitoring methods are used initially to identify areas with
high population densities of L.monacha, in order to
focus on the most endangered stands of pine forest. Subsequently, these smaller areas are monitored by more precise methods, which involve a more
de-tailed survey of at-risk stands (Möller et al. 2007).
In the first phase of the monitoring process, L.
mo-nacha males are captured with pheromone-baited traps to identify incipient local outbreaks. The sec-ond phase of monitoring is implemented in the fol-lowing year at those sites where the total number of L. monacha captured per trap per year had reached the threshold of 1,000. During the second phase (census of adult females), adult females are counted that are resting on the lowermost 3-m section of selected pine trunks (i.e. the section that is located closest to the ground). For the whole region, such local censuses of adult females are implemented at slightly different times, and initiated when the first males arrive at the pheromone trap nearest to each locality. Data on adult females are related more strongly to the potential damage caused by sub-sequent larvae in a specific location and thus are more suitable for predicting this damage than the data obtained from the capture of males (Möller et al. 2007).
Operational monitoring of the nun moth Lymantria
monacha L. (Lepidoptera: Lymantriidae) using
pheromone-baited traps – a rationalization proposal
K. Hielscher, A. Engelmann
Forest Development and Monitoring Department, Eberswalde Forestry Competence Center, Eberswalde, Germany
ABSTRACT: The annual risk assessment of Scots pine (Pinus sylvestris L.) stands in the federal state of Brandenburg and subsequent decisions on the application of insecticides are based on operational surveillance data on L. mona-cha. The objective of the study was to rationalize the operational pheromone capture method. Data from operational monitoring with pheromone-baited traps in Brandenburg were analyzed. The records included data from a total of 11,761 traps and covered the development of populations of this insect from normal to outbreak densities and back during the years 2000–2009. Statistical analysis of the data suggested that a capture period of 15 June to 10 August, which is shorter than the period used hitherto, is sufficient to determine whether more precise monitoring by a census of adult females is required at a given site in the following year owing to increasing population densities. If this sug-gested shorter capture period had been implemented in 2000–2009, approximately 33% fewer trap inspections would have been required.
During operational monitoring in Brandenburg, the pheromone-baited traps are suspended in ar-eas of Scots pine, spruce, or mixed pine and spruce forests, as well as in areas of mixed pine or spruce forest that contain up to 30% of deciduous trees. Targeted forest stands are 30–80 years old and the
trap density in these stands is 1 per 10 km2 of the
respective forest. Hitherto, the pheromone traps have been suspended on 15 June each year, and then checked approximately every third day, whereupon
the captured L. monacha are counted and removed
(this is referred to as “trap inspection” in the fol-lowing text). Each trap is recovered during the first trap inspection after 15 August at which the trap is empty. The objective of the study described herein was to rationalize the operational pheromone cap-ture method used in Brandenburg and consequent-ly to reduce working hours and costs.
MATERIAL AND METHODS
Pheromone traps
In the present study, data from the operational
monitoring of L. monacha with pheromone-baited
traps in Brandenburg were analyzed. The records included data on a total of 11,761 traps and
co-vered the development of L. monacha populations
from normal population densities to outbreak
den-sities and back to normal denden-sities in the years 2000–2009 (progradation phase in 2002 and 2003, and culmination of the outbreak in 2004 in most regional locations). The traps were suspended and L. monacha specimens were counted by many for-esters and lumbermen in more than 500 forest dis-tricts over the 10-year period. During this period, two different pheromone lures were used. Until 2004, the traps were baited with disparlure, the
pheromone of Lymantria dispar Linnaeus, 1758,
which attracts both L. dispar and L. monacha
spe-cies. Since 2005, a L. monacha volatile blend that
contained five components, namely, (±)-disparlure, (±)-monachalure, and 2-methyl-Z-7-octadecene (Gries et al. 1996), was used, but at a lower dose than disparlure alone to allow the total
num-bers of captured L. monacha to be compared (D.
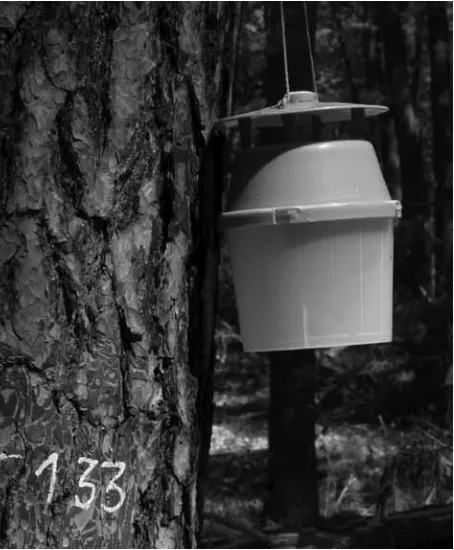
Häussler, personal communication). The traps used were Variotraps (Flügel GmbH), which are a type of nonsaturating funnel trap. They were sus-pended at a height of 1.5–2.0 m a.g.l. (Fig. 1).
Statistical analysis of pheromone trap data
Records from stands other than those of Scots pine, the dominant tree species in Brandenburg, were excluded from the statistical data analysis. The
numbers of L. monacha counted per trap were used
to calculate daily values, maximum daily values, total sums, and accumulated subtotals for statisti-cal analysis. Daily value is defined as the number of L. monacha captured at one trap inspection divid-ed by the number of capture days since the previ-ous trap inspection. The inspection interval is the number of days between one count of the number of L. monacha captured in a trap and the subsequent count. Maximum daily value refers to the highest daily value per trap per year. Total sum is defined as
the sum of all the L. monacha captured in a single
trap in one year. Accumulated subtotals are defined
as the total number of L. monacha captured from
the start of the capture period to 20 June, to 30 June, and so on.
[image:2.595.64.291.464.739.2]had been violated, dependent and independent vari-ables were transformed by the fourth root.
RESULTS
Pheromone traps
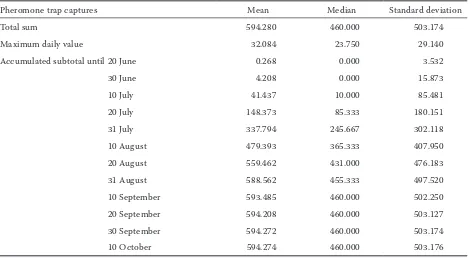
Descriptive statistics of the dataset are given in Table 1. Fig. 2 shows the dynamics of capture of nun moths per day during the flight period from 2000 to 2009. For 90% of the traps, the flight period started
between 20 June and 16 July and finished between 17 August and 17 September. The mean date for the beginning of the flight period was 4 July, whereas the mean date for its end was 1 September. The latest capture date over the 10 years studied was 5 Octo-ber. With respect to the maximum daily values, 90% were reached between 9 July and 15 August. The flight period lasted between 40 and 78 days in 90% of the traps and had the mean duration of 60 days.
[image:3.595.64.534.73.331.2]The mean maximum daily value for the capture of L. monacha was 32 specimens. In 95% of the traps, the maximum daily value was not higher than
Table 1. Descriptive statistics of the dataset (n = 11,761)
Pheromone trap captures Mean Median Standard deviation
Total sum 594.280 460.000 503.174
Maximum daily value 32.084 23.750 29.140
Accumulated subtotal until 20 June 0.268 0.000 3.532
30 June 4.208 0.000 15.873
10 July 41.437 10.000 85.481
20 July 148.373 85.333 180.151
31 July 337.794 245.667 302.118
10 August 479.393 365.333 407.950
20 August 559.462 431.000 476.183
31 August 588.562 455.333 497.520
10 September 593.485 460.000 502.250
20 September 594.208 460.000 503.127
30 September 594.272 460.000 503.174
10 October 594.274 460.000 503.176
2000 2001 2002 2003 2004 2005 2006 2007 2008 2009 50 45 40 35 30 25 20 15 10 5 0 30 Ma y 4 J un. 9 J un. 14 J un. 19 J un. 24 J un. 29 J un. 4 J ul. 9 J ul. 14 J ul. 19 J ul. 24 Jul. 29 J ul. 3 Au g. 8 A ug . 13 A ug . 18 A ug . 23 A ug . 28 A ug . 2 S ep t. 7 S ept . 12 S ept . 17 S ept . 22 S ept . 27 S ept . 2 O ct . M
ean of c
[image:3.595.61.532.537.760.2]apt ur ed n un mot hs p er d ay Date
85 specimens, and the highest maximum daily val-ue reached was 360 specimens. Owing to the fact that the number of males that were found when a trap was checked was divided by the number of days since the trap was checked for the last time, the cal-culated daily numbers should be slightly lower than the actual numbers. The mean number of captures per trap over the entire flight period (total sum) was 594 males. The threshold value of 1,000 males was reached in 15% of the traps. In 5% of the traps, 1,547 or more males were captured. The maximum total sum was 5,064 males.
Pheromone trap inspection intervals
In operational monitoring, it is preferable that the
number of L. monacha captured per trap
inspec-tion does not exceed 100 specimens (D. Häussler, K. Möller, personal communication). It is difficult to count more than 100 specimens from one trap in the field. As a consequence, the inspection intervals should be short to reduce the likelihood of catch-ing more than 100 moths per trap inspection. The tested inspection intervals had to be easy to apply in operational monitoring and also had to take into account weekends. As a consequence, intervals of 3 days, as used hitherto, and of 7 and 14 days, were tested. With an interval of 3 days, not more than 33.3 specimens should be captured per day (7 days:
14.3 specimens, 14 days: 7.1 specimens) to ensure that the favoured levels are not exceeded.
Percen-tiles of the number of L. monacha captured per trap
per day were calculated to determine how often the threshold value of 100 specimens would be exceed-ed upon the application of the different intervals.
In Fig. 3, the highest numbers of L. monacha
cap-tured per trap and per day for a defined percentage
of records with the lowest numbers of L. monacha
captured are presented. Fig. 3 shows, for instance,
that the daily threshold of 33.3 L. monacha would
be exceeded in 5% of the records (while 95% of the records would have fewer than 33.3) during the time period from 9 July to 14 August.
As a supplement to Fig. 3, Table 2 lists the time periods during which the daily captures exceeded the thresholds in more than 5% of the records. On the basis of these data, appropriate inspection
[image:4.595.73.528.68.327.2]in-95% of the records 90% of the records 75% of the records 50% of the records
Fig. 3. Histogram of the maximum number of L. monacha captured per trap and per day in a defined percentage of records (n = 700,130)
Table 2. Time periods in which daily thresholds were exceeded
Trap inspection interval
Daily threshold to avoid the capture
of more than 100 specimens
per trap
Time period during which the
threshold was exceeded in more than
5% of the records 14 days 7.1 12 June–30 August
7 days 14.3 1 July–23 August
[image:4.595.306.532.645.756.2]tervals were determined for different time periods from June to August that should ensure that the threshold of 100 specimens is not exceeded in more than 5% of the trap inspections (Table 3).
Pheromone trap capture period
Table 4 lists Spearman’s rank correlation
coeffi-cients between the total sum of captured L.
mona-cha and the maximum daily value, as well as the
ac-cumulated subtotals. Strong significant correlations
were found between the total sum of captured
L. mo-nacha and the maximum daily value (r = 0.932) and between the total sum and the accumulated subtotal
up to 31 July (r = 0.901) and beyond.
The scatterplots in Fig. 4 illustrate the strong corre-lations described above. The higher scores that were obtained using disparlure are due to its use during the progradation phase and the culmination of the
outbreak, during which high densities of L. monacha
occurred. The L. monacha volatile blend was applied
during the retrogradation phase and latency, when
low densities were present. The scatterplots illustrate an increase in the correlation between the total sum and accumulated subtotal as the accumulation time increased. The scatterplots of the total sum and accu-mulated subtotal up to 20 August or beyond display a nearly straight line. The correlation between the ac-cumulated subtotal up to 10 August and the total sum
(r = 0.975) was stronger than that between the
maxi-mum daily value and the total sum.
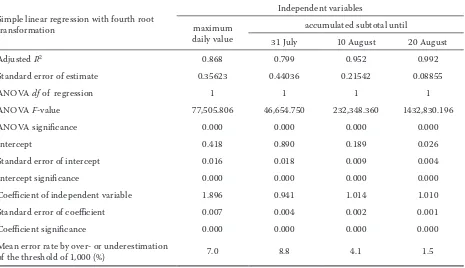
To rationalize the operational monitoring, correla-tion coefficients that were higher than 0.9, but lower than 1, were analyzed further. The objectives of the simple linear regression analysis were to describe the relationships between the total sum and differ-ent accumulated subtotals, as well as to predict the total sum. The untransformed variables did not meet the assumptions of normality and homoscedasticity for regression analysis. The assumptions were met best by the fourth root transformation. In spite of this transformation, the assumption of normality of the variate was still clearly violated. Linear regres-sion analysis has been described as less sensitive to departures from a normal distribution when sam-ple sizes are sufficiently large (Lumley et al. 2002). Table 5 shows some of the results of the regression analysis. All coefficients listed in Table 5 and the re-gression models are statistically significant.
To validate the regression model, the data were divided at random into two parts. For each part, the regression equation was calculated and then ap-plied to the other section of the data to predict the total sum values. The last row of Table 5 presents the error rates of these predicted values with
re-Table 3. Recommended trap inspection intervals
Time period inspection intervalRecommended
15–30 June 7 days
1 July–23 August 3 days
9 July–14 August 3 days might be too long
[image:5.595.63.291.73.169.2]24–30 August 7 days
Table 4. Spearman’s rank correlation coefficients for the total sum of captured L. monacha (n = 11,761)
Correlation of total sum with Correlation coefficient Two-sided significance
Maximum daily value 0.932 0.000
Accumulated subtotal until 10 June 0.004 0.643
20 June 0.002 0.806
30 June 0.164 0.000
10 July 0.322 0.000
20 July 0.687 0.000
31 July 0.901 0.000
10 August 0.975 0.000
20 August 0.995 0.000
31 August 1.000 0.000
10 September 1.000 0.000
20 September 1.000 0.000
30 September 1.000 0.000
[image:5.595.66.531.521.758.2]Pheromone Pheromone nun moth pheromone
disparlure nun moth pheromonedisparlure
5,000 4,500 4,000 3,500 3,000 2,500 2,000 1,500 1,000 500 0
5,000 4,500 4,000 3,500 3,000 2,500 2,000 1,500 1,000 500 0
Tot
al sum
0 500 1,000 1,500 2,000 2,500 0 50 100 150 200 250 300 350
Maximum daily value Accumulated subtotal until 30 July
(A) (B)
Pheromone Pheromone
nun moth pheromone
disparlure nun moth pheromonedisparlure
5,000
4,500 4,000
3,500 3,000 2,500
2,000 1,500
1,000 500
0
5,000
4,500 4,000
3,500 3,000
2,500 2,000
1,500 1,000
500 0
Tot
al sum
0 1,000 2,000 3,000 4,000 0 1,000 2,000 3,000 4,000 5,000
Accumulated subtotal until 10 August Accumulated subtotal until 20 August (D)
[image:6.595.61.532.56.539.2](C)
Fig. 4. Scatterplots for the total sum and maximum daily value as well as the accumulated subtotals for different time segments, C with transformed back regression function from data transformed by the fourth root (A–D: n = 11,761)
spect to over- or underestimation of the threshold
value of 1,000 captured L. monacha, which is used
as an indicator of an incipient outbreak. An error rate of 5% seems to be acceptable. Consequently, the capture period from 15 June to 10 August with an error rate of 4.1% was determined to be sufficient
to monitor L. monacha using pheromone traps in
Brandenburg (Fig. 4C). Over the last 10 years, the mean date on which trapping ceased was 1 Septem-ber. A new threshold value of 825 specimens for the proposed shortened capture period was calculated using the regression equation (Table 5) and the for-mer threshold value of 1,000 specimens.
DISCUSSION
The utilization of operational surveillance data on L. monacha in the present study is associated with many potential sources of error and with high risks of error, as compared with highly standard-ized investigations that use data from specially designed experiments. The pheromone traps were
suspended and the L. monacha specimens were
sus-pend the pheromone traps and how to count the specimens, which enabled the monitoring to be standardized as much as possible. The huge
num-ber of records and traps (n = 11,761) could not have
been achieved in the context of a completely stan-dardized experiment; hence, the expected high er-ror rates were accepted.
With respect to the difficulties that are associated
with counting larger numbers of L. monacha per
trap inspection, an alternative approach could be to weigh the specimens instead of counting them. The disadvantages of weighing the specimens are:
– the variability in the adult weight of L. monacha,
which depends on the environmental conditions during development, such as the availability of food resources for caterpillars and the climatic conditions,
– the presence of by catch, which would have to be
segregated from L. monacha,
– the effect of the accumulation of water in the trap on the weight.
As a consequence, we prefer to count the speci-mens (K. Möller, personal communication).
The timing of the flight period of L. monacha
de-pends on several factors, and varies by up to three weeks among different locations in the same year and by a longer period among different years in Ba-varia (Feicht 1997). Before the flight period, the temperature during the development of immature
stages has an impact on the subsequent flight pe-riod (Skuhravy 1987). The date of emergence of adults is determined mainly by the temperature sum (in degree days) that has been reached. In ad-dition to such exogenous factors, endogenous fac-tors, such as the phase of the outbreak and physi-ological constitution or provenance of the insects, influence the timing of the flight period (Skatul-la, Feicht 1995). The most important parameter that determines flight activity is the temperature during the evening and at night. In spruce stands in Southern Bohemia, the maximum rate of capture was registered at an evening temperature of 15– 22°C (Skuhravy, Zumr 1981; Skuhravy 1987). Below 10°C, flight activity ceased in both Bohemia and Bavaria (Skuhravy, Zumr 1981; Skuhravy 1987; Feicht 1997).
Hochmut and Skuhravy (1977) proposed a capture period from mid-July to the end of
Au-gust for the surveillance of L. monacha in former
[image:7.595.67.532.101.369.2]Czechoslovakia, in which forests and woodland are dominated by spruce and fir at higher altitudes. In their opinion, this proposed capture period was sufficient to realize 90% of the potential captures. The results of our study, which were derived from different locations in Brandenburg and were ob-tained over 10 years with different climatic condi-tions, suggested that a capture period from 15 June to 10 August is appropriate. Capture should start
Table 5. Results of linear regression analyses with the total sum of captured L. monacha as dependent variable, maxi-mum daily value or accumulated subtotals as independent variable and fourth root transformation of the dependent and independent variables (n = 11,761)
Simple linear regression with fourth root transformation
Independent variables
maximum daily value
accumulated subtotal until
31 July 10 August 20 August
Adjusted R2 0.868 0.799 0.952 0.992
Standard error of estimate 0.35623 0.44036 0.21542 0.08855
ANOVA df of regression 1 1 1 1
ANOVA F-value 77,505.806 46,654.750 232,348.360 1432,830.196
ANOVA significance 0.000 0.000 0.000 0.000
Intercept 0.418 0.890 0.189 0.026
Standard error of intercept 0.016 0.018 0.009 0.004
Intercept significance 0.000 0.000 0.000 0.000
Coefficient of independent variable 1.896 0.941 1.014 1.010
Standard error of coefficient 0.007 0.004 0.002 0.001
Coefficient significance 0.000 0.000 0.000 0.000
Mean error rate by over- or underestimation
on 15 June, as practised to date, because of the variation of the eclosion date by approximately one month, the fact that the temperature increases more rapidly within pine stands than within spruce stands, and the expected continuation of climate change.
Skatulla (1989) implemented a surveillance method that is based on temperature-dependent maximum values for the number of nun moths captured in Bavaria. Lohmann (2005) detected a correlation between maximum values and total sums with respect to selected data for pheromone traps in Brandenburg. As a consequence, she rec-ommended a capture period that lasts from the start of the flight period to the second consecutive
trap inspection in which the number of L. monacha
captured does not increase. Lohmann (2005) pro-posed that the date of the start of the flight period and the maximum value should be used for risk as-sessment of pine stands. Majunke et al. (2009) an-alyzed selected data for pheromone traps from pine and spruce stands in the south of the federal state of Brandenburg and in the free state of Saxony, which lies to its south. They found that 83.9% of the maximum values were reached between 15 July and 15 August. They recommended the utiliza-tion of the maximum values to estimate the total sums, a capture period from 15 July to 15 August, and trap inspection intervals of 3–4 days for pine stands in the south of Brandenburg and in Saxony. Our results show that the subtotal up to 10 August has a stronger correlation to the total sum than the maximum daily value. However, the greatest diffi-culties when using the maximum approach are in accurately determining the date of the maximum, which varies over time, and coping with multiple maxima (Fig. 2). As a consequence, a longer capture period is needed to determine the maximum value. If a longer capture period is necessary anyway, an accumulated subtotal can be determined and used to predict the total sum without further effort.
The relationships between trap captures using
pheromones and other methods of L. monacha
surveillance have been studied in Brandenburg and Bavaria. To date, no or only weak correlations have been detected between data obtained from capture with pheromone traps and those from the census of adult females near the traps (Apel et al. 1984; Morewood et al. 2000). Under conditions of a high population density and abundant widespread
natural L. monacha pheromone (Feicht 1997), as
well as additional chemical and acoustic stimuli from females over short distances (D. Häussler, personal communication), the pheromone traps
become less attractive to males. Strong positive correlations have been detected between the num-ber of male moths captured with pheromone traps
using the L. monacha volatile blend and the
num-ber of faecal pellets from larvae that are collected
on a sheet of cloth (1 m2) placed on the forest floor
under a dominant pine or spruce near the traps (Häussler et al. 2000; Morewood et al. 2000).
CONCLUSION AND RECOMMENDATIONS
As a result of the study reported herein,
ratio-nalization of the operational monitoring of L.
mo-nacha using pheromone traps in Brandenburg is recommended. A capture period from 15 June, as practised hitherto, to 10 August seems to be suf-ficient to predict incipient local outbreaks. A new threshold value of 825 specimens for the total sum of nun moths over the proposed capture period was calculated. If the suggested shorter capture period had been implemented in 2000–2009, ap-proximately 33% fewer trap inspections would have been required.
The trap inspection intervals should be changed as follows:
– from 15 to 30 June, the traps should be checked every seventh day,
– from 1 to 8 July, the traps should be checked ev-ery third day,
– from 9 July to 10 August, the traps should con-tinue to be checked every third day, with the following exception: if more than 100 moths are captured in one trap in the interval between two trap inspections, the local executor can decide to check it every other day.
Acknowledgements
References
Apel K.H., Häussler D., Wawrzyniak H. (1984): Rationa-lisierungsmöglichkeiten bei der Überwachung der Nonne (Lymantria monacha L.) durch Pheromonanwendung. Sozialistische Forstwirtschaft, 34: 314–316.
Feicht E. (1997): Zum Anflugverhalten von Kieferneule, Nonne, Schwammspinner und Kleinem Frostspanner an Pheromonfallen unter Berücksichtigung von Witte-rungsbedingungen. [Ph.D. Thesis.] Freising, Universität München: 184.
Gries G., Gries R., Khaskin G., Slessor K.N., Grant G.G., Liska J., Kapitola P. (1996): Specificity of nun and gypsy moth sexual communication through multiple-component pheromone blends. Naturwissenschaften, 83: 382–385. Häussler D., Majunke C., Möller K. (2000): Zur
Über-wachung der Nonne (Lymantria monacha L.) im nord-ostdeutschen Tiefland. Beiträge für Forstwirtschaft und Landschaftsökologie, 34: 35–37.
Hochmut R., Skuhravy V. (1977): The flight period of the nun moth, Lymantria monacha, investigated by pheromone traps. Acta entomologica Bohemoslovaca, 74: 65–68. Lohmann B. (2005): Der Falterflug der Nonne (Lymantria
monacha) in Brandenburg. [Diploma Thesis.] Eberswalde, FH Eberswalde: 59.
Lumley T., Diehr P., Emerson S., Chen L. (2002): The im-portance of the normality assumption in large public health data sets. Annual Review of Public Health, 23: 151–169. Majunke C., Noack U., Otto L.-F. (2009): Zusammenhänge
zwischen den Maximal- und Gesamtfangwerten bei der Falterflugkontrolle der Nonne (Lymantria monacha L.). Archiv für Forstwesen und Landschaftsökologie, 43: 70–79.
Möller K., Apel K.H., Engelmann A., Hielscher K., Walter C. (2007): Zur Überwachung der Waldschutzsi-tuation in den Kiefernwäldern Brandenburgs. In: Kätzel R., Möller K., Löffler S., Engel J., Liero K. (eds): Die Kiefer im nordostdeutschen Tiefland – Ökologie und Bewirtschaftung. Eberswalder Forstliche Schriftenreihe,
32: 288–296.
Morewood P., Gries G., Liska J., Kapitola P., Häussler D., Möller K., Bogenschütz H. (2000): Towards phero-mone-based monitoring of nun moth, Lymantria monacha (L.) (Lep., Lymantriidae) populations. Journal of Applied Entomology, 124: 77–85.
Skatulla U. (1989): Zur Überwachung und Prognose bei der Nonne, Lymantria monacha L. auf Pheromon-Basis. Anzeiger für Schädlingskunde, Pflanzenschutz, Umwelt-schutz, 62: 50–53.
Skatulla U., Feicht E. (1995): Observations of the flight behaviour of Lymantria monacha L. (Lep., Lymantriidae) to pheromone baited traps. Journal of Applied Entomol-ogy, 119: 17–19.
Skuhravy V. (1987): A review of research on the nun moth (Lymantria monacha L.) conducted with pheromone traps in Czechoslovakia, 1973–1984. Anzeiger für Schädlings-kunde, Pflanzenschutz, Umweltschutz, 60: 96–98. Skuhravy V., Zumr V. (1981): Nocturnal and seasonal
flight activity of the nun moth Lymantria monacha L. (Lepidoptera, Lymantriidae) as determined by pheromone and light traps. Zeitschrift für angewandte Entomologie,
92: 315–319.
Received for publication June 11, 2011 Accepted after corrections February 10, 2012
Corresponding author:
Dr. Kati Hielscher, Eberswalde Forestry Competence Center, Forest Development and Monitoring Department, Alfred-Möller-Straße 1, 16225 Eberswalde, Germany