INTRODUCTION
Generally, term productivity means an output per the unit of input. Higher productivity can be reached through the increase of the capital or labour effec-tiveness which is closely related to the technical progress requiring investments also into education and equipment of scientific and research institutions. Thus, technical progress is a result of the capital ac-cumulation. Capital accumulation changes the ratio between production factors. The proportion of capital in relation to work increases and thus the product per worker increases and so labour productivity increases. Gradual increasing of the productivity of labour in all sectors of the national economy of every coun-try is of extraordinary importance because labour productivity and its growth rank among important factors of the growth of wealth of the whole society. Countries with the high productivity of labour show also better competitive capacities in the field of in-ternational trade.
This paper describes and exactly documents the development of labour productivity in GDP (in PPS = Purchasing Power Standard) per one employed person in the EU.
MATERIAL AND METHODS
The data on the productivity of labour are calcu-lated as the GDP level in PPS per person employed (EU15 = 100%). There were evaluated the countries of the EU and for comparison the USA and Japan in the reference period 1994 to 2003. All data were obtained from literature sources of the EUROSTAT for the reference period 1994 to 2003. In the Czech Republic, data on the productivity of labour per an employed working person are available since 2000. In Malta, Poland and Romania, data on the productivity of labour per employed person are available since 1999 and in Slovenia since 1995. The problem of labour productivity is solved in Dornbusch, Fischer
Assessing the development of labour productivity
in the EU countries
Hodnocení vývoje produktivity práce v zemích EU
J. KLÍMA, M. PALÁT (JR.)
Mendel University of Agriculture and Forestry, Brno, Czech Republic
Abstract: The paper is aimed at assessing the development of labour productivity in GDP (in PPS) per an employed person (EU15 = 100%). There were evaluated the countries of the EU and for comparison the USA and Japan in the reference peri-od 1994 to 2003. Methperi-ods of regression and correlation analysis and development trends were used for the mathematical--statistical analysis. A strong increasing development trend is to observe in Ireland. The strongest decrease is in Italy and Germany. The development trend in the Czech Republic is slightly increasing.
Key words: labour productivity
,
analysis of development, European Union, mathematical and statistical methodsAbstrakt: Příspěvek je zaměřen na posouzení vývoje produktivity práce v HDP (v standardu kupní síly) na zaměstnanou osobu (EU15 = 100 %). V referenčním období let 1994 až 2003 byly vyhodnoceny země EU a pro srovnání USA a Japonsko. Pro matematicko-statistickou analýzu byly použity metody regresní a korelační analýzy a vývojové trendy. Rostoucí trend vývoje je nejsilnější v Irsku. Největší pokles můžeme naopak sledovat v Itálii a Německu. Vývojový trend v České republice je mírně rostoucí.
Klíčová slova: produktivita práce, analýza vývoje, Evropská unie, matematické a statistické metody
(1990), Holman (1999), Jílek et al. (2001), Klíma, Palát (2003), Mankiw, (1999), Synek et al. (1996). The math-ematical-statistical processing of the presented data is based on methodical procedures given in papers of Minařík (2000) and Seger et al. (1998).
RESULTS AND DISCUSSION
Development of labour productivity in GDP (in PPS) per employed person in the Eurozone, new member countries, of labour productivity USA and Japan in
20 40 60 80 100 120 140 B el gi um D en m ar k Fi nl an d Fr an ce Ire la nd Ita ly Lu xe m bo ur g G er m an y N et he rla nd s Po rtu ga l A us tri a G re ec e Sp ai n Sw ed en U ni te d K in gd om C ze ch R ep ub lic Es to ni a C yp ru s Li th ua ni a La tv ia H un ga ry M al ta Po la nd Sl ov ak ia Sl ov en ia U SA Ja pa n [%] 40 60 80 100 120
Eurozone new member countries USA Japan
[%
[image:2.595.81.525.174.724.2]]
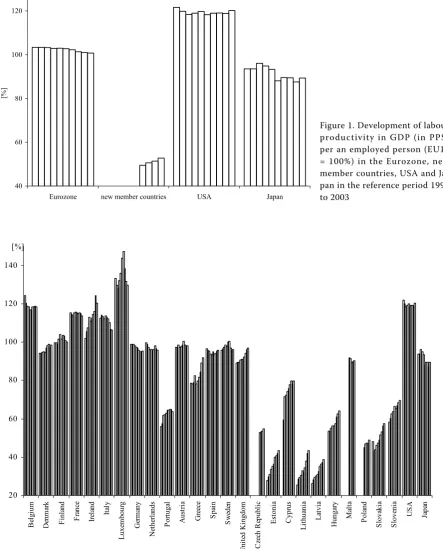
Figure 1. Development of labour productivity in GDP (in PPS) per an employed person (EU15 = 100%) in the Eurozone, new member countries, USA and Ja-pan in the reference period 1994 to 2003
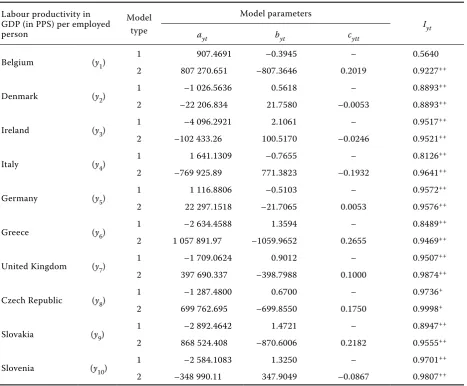
the reference periods 1994 to 2003are given in Figure 1. The development in GDP (in PPS) per employed person in all member countries of the EU is given in Figure 2. The highest labour productivity in GDP (in PPS) per an employed person in comparison with the EU15 is in the USA. Labour productivity in Japan is lower than in Eurozone.
Parameters of models of labour productivity de-velopment trends in GDP (in PPS) per an employed person in the reference periods are given in Table I. An equation for the linear model is yt = ayt+ byt t. An equation for the quadratic model is yt = ayt+ byt t +
cyt t2. Most of correlation indices I
ytare significant on the level of α = 0.01.
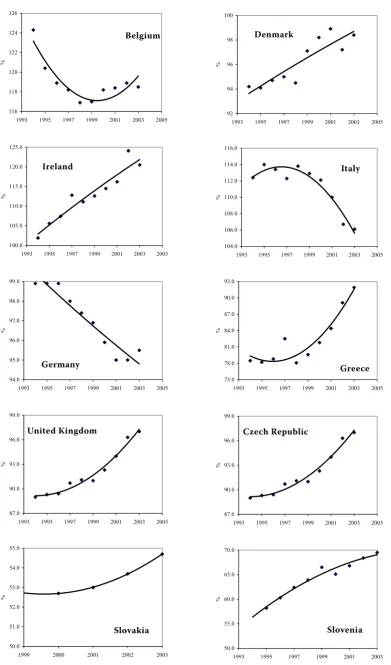
Linear trends of labour productivity in GDP (in PPS) per employed person are slightly decreasing in the Eurozone as a whole. Development trends of the selected countries are described bellow. There is a strong decreasing trend in these selected members of the EU: Belgium, Italy and Germany. Other linear trends are increasing – see negative or positive
regres-sion coefficients byt in Table 1. A strong increasing trend is in Ireland. There is an increasing trend in Greece, Slovenia, United Kingdom, Denmark and Slovakia too. The development trend in the Czech Republic is slightly increasing.
The quadratic models show nonlinear in the ref-erence period. Selected developmental trends in the reference period are given in graphical form in Figures 3. Labour productivity in GDP (in PPS) per employed person in all fifteen states of the EU is in the reference period higher than labour productivity in GDP (in PPS) per an employed person in the new member countries. None of the new member coun-tries have already reached the EU15 level but some of them will soon reach the level of less developed countries of the EU15.
[image:3.595.66.534.379.765.2]Cluster analysis was used for evaluation labour productivity in GDP (in PPS) per employed person in twenty five countries of the EU. In dendrogram from labour productivity in GDP (in PPS) per em-ployed person in twenty five countries of the EU for
Table 1. Models of development trends of labour productivity per an employed person in the selected countries of the EU in the reference period 1994–2003
Labour productivity in GDP (in PPS) per employed person
Model type
Model parameters
Iyt
ayt byt cytt
Belgium (y1) 1 907.4691 –0.3945 – 0.5640
2 807 270.651 –807.3646 0.2019 0.9227++
Denmark (y2) 1 –1 026.5636 0.5618 – 0.8893
++
2 –22 206.834 21.7580 –0.0053 0.8893++
Ireland (y3) 1 –4 096.2921 2.1061 – 0.9517
++
2 –102 433.26 100.5170 –0.0246 0.9521++
Italy (y4) 1 1 641.1309 –0.7655 – 0.8126++
2 –769 925.89 771.3823 –0.1932 0.9641++
Germany (y5) 1 1 116.8806 –0.5103 – 0.9572++
2 22 297.1518 –21.7065 0.0053 0.9576++
Greece (y6) 1 –2 634.4588 1.3594 – 0.8489++
2 1 057 891.97 –1059.9652 0.2655 0.9469++
United Kingdom (y7) 1 –1 709.0624 0.9012 – 0.9507++
2 397 690.337 –398.7988 0.1000 0.9874++
Czech Republic (y8) 1 –1 287.4800 0.6700 – 0.9736+
2 699 762.695 –699.8550 0.1750 0.9998+
Slovakia (y9) 1 –2 892.4642 1.4721 – 0.8947++
2 868 524.408 –870.6006 0.2182 0.9555++
Slovenia (y10) 1 –2 584.1083 1.3250 – 0.9701++
116 118 120 122 124 126
1993 1995 1997 1999 2001 2003 2005
%
100.0 105.0 110.0 115.0 120.0 125.0
1993 1995 1997 1999 2001 2003 2005
%
94.0 95.0 96.0 97.0 98.0 99.0
1993 1995 1997 1999 2001 2003 2005
%
87.0 90.0 93.0 96.0 99.0
1993 1995 1997 1999 2001 2003 2005
%
50.0 51.0 52.0 53.0 54.0 55.0
1999 2000 2001 2002 2003
%
50.0 55.0 60.0 65.0 70.0
1993 1995 1997 1999 2001 2003
%
92 94 96 98 100
1993 1995 1997 1999 2001 2003 2005
%
104.0 106.0 108.0 110.0 112.0 114.0 116.0
1993 1995 1997 1999 2001 2003 2005
%
75.0 78.0 81.0 84.0 87.0 90.0 93.0
1993 1995 1997 1999 2001 2003 2005
%
87.0 90.0 93.0 96.0 99.0
1993 1995 1997 1999 2001 2003 2005
[image:4.595.96.488.62.728.2]%
Figure 3. Development of labour productivity per an employed person in Belgium, Denmark, Ireland, Italy, Germany, Greece, United Kingdom, the Czech Republic, Slovakia and Slovenia in the reference period 1994 to 2003
Greece Germany
Belgium Denmark
Italy Ireland
Slovakia Slovenia
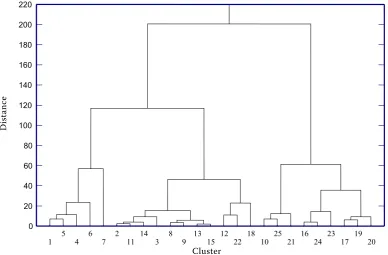
2004–2003 (Figure 4) we can find three main clusters: (1) – Belgium, Ireland, France, Italy, Luxembourg; (2) – Denmark, Austria, Sweden, Finland, Germany, Netherlands, Spain, United Kingdom, Greece, Malta, Cyprus; (3) – Portugal, Slovenia, Hungary, the Czech Republic, Slovakia, Poland, Estonia, Lithuania, Latvia. It is possible to notice that labour productivity in GDP (in PPS) per an employed person in all new member countries of the EU except of Malta and Cyprus is markedly lower then in the countries of the EU15, but it has a stronger increasing trend.
CONCLUSION
The paper is focused on assessing the develop-ment of labour productivity in GDP (in PPS) per an employed person (EU15 = 100%). There were evalu-ated the countries of the EU and for comparison the USA and Japan in the reference period 1994 to 2003. Methods of regression and correlation analy-sis, development trends and cluster analysis were applied for the mathematical-statistical analysis. The highest labour productivity in GDP (in PPS) per an employed person in comparison with the EU15 is in the USA. Labour productivity in Japan
is lower than in the Eurozone. Cluster analysis used for evaluation of the labour productivity in GDP (in PPS) per an employed person in twenty five countries of the EU shows that labour productivity in all new member countries of the EU except of Malta and Cyprus is markedly lower then in the countries of the EU15, but it has a stronger increas-ing trend. None of the new member countries have already reached the EU15 level but some of them will reach the level of the less developed countries of the EU15 in the near future. A strong increas-ing development trend is in Ireland, the strongest decrease is to observe in Italy and Germany. The development trend in the Czech Republic is slightly increasing.
REFERENCES
Dornbusch R, Fischer S. (1990): Macroeconomics. McGraw-Hill Publishing Company, Singapore, 828 p.; ISBN 0-07-100696-6.
Holman R. (1999): Ekonomie. C.H. Beck, Praha, 726 p.; ISBN 80-7179-255-1.
[image:5.595.90.479.77.332.2]Jílek J. a kol. (2001): Nástin sociálněhospodářské sta-tistiky. VŠE Praha, 246 p.; ISBN 80-245-0214-3. Figure 4. Dendrogram of labour productivity per employed person in twenty five countries of the EU for 2000–2003 (1 – Belgium, 2– Denmark, 3 – Finland, 4 – France, 5 – Ireland, 6 – Italy, 7 – Luxemburg, 8 – Germany, 9 – Netherlands, 10 – Portugal, 11 – Austria, 12 – Greece, 13 – Spain, 14 – Sweden, 15 – United Kingdom, 16 – Czech Republic, 17 – Es-tonia, 18 – Cyprus, 19 – Lithuania, 20 – Latvia, 21 – Hungary, 22 – Malta, 23 – Poland, 24 – Slovakia, 25 – Slovenia)
220
0 20 40 60 80 100 120 140 160 180 200
1 5 4 6 7 2 11 14 3 8 9 13 15 12 22 18 10 25 21 16 24 23 17 19 20
Cluster
D
is
ta
nc
Klíma J., Palát M. (2003): Labour productivity as a factor forming the economic efficiency and the competitive ability of the country. Agricultural Economics – Czech, 49 (11): 515–519.
Mankiw N.G.(1999): Zásady ekonomie. Grada Pub-lishing, edice profesional, 763 p.; ISBN 80-7169-891-1.
Minařík B. (2000): Statistika I. MZLU, Brno, 107 p.; ISBN 80-7157-427-9.
Seger J., Hindls R., Hronová S. (1998): Statistika v hospodářství. ECT Publishing, Praha, 636 p.; ISBN 80-86006-56-5.
Synek M. a kol. (1996): Manažerská ekonomika. Grada Publishing, 455 p.; ISBN 80-7169-211-5.
Arrived on 16th September 2005
Contact address:
Doc. Ing. Jan Klíma, CSc., Ing. Milan Palát, Mendelova zemědělská a lesnická univerzita v Brně, Zemědělská 1, 61300 Brno, Česká republika