Fertility related traits as cost reducing factors are of increasing concern to Holstein breeders. Dystocia and stillbirth represent important economic costs either direct (loss of calf, death of dam, veterinary assistance and labour) or long-term (culling rate, milk yield and fertility) ones (Meijering, 1984). In spite of low heritability (Kemp et al., 1988, h2 =
0.06; McGuirk et al., 1999, h2 = 0.05; Junge et al.,
2003, h2 = 0.05 and 0.06, direct and maternal,
re-spectively; Jamrozik et al., 2005, h2 = 0.14; Fuerst
and Fuerst-Waltl, 2006, h2 = 0.02 to 0.09), an effort
to reduce the incidence of difficult calvings and the stillbirth rate in dairy herds is made by a selective use of sires over females at risk (mainly heifers). Several factors have an evident impact on calving performance, e.g. parity or dam age, sex of calf, gestation length, and season of calving being the
most important (Meijering, 1984). Adjustments for such non-genetic factors are made in genetic evalu-ations (Berger, 1994; McGuirk et al., 1999; Fuerst and Egger-Danner, 2003).
The incidence of dystocia and stillbirths tends to be population specific because of genetic factors and a range of non-genetic factors (Berry et al., 2007). The Czech Holstein population is specific in its development (conversion from the original Czech Fleckvieh cattle by upgrading crossing with Black and White and Holstein bulls) and in manage-ment conditions in herds. In the Czech Republic, data on the course of deliveries on farms have been recorded by breeders for more than ten years, but they have not been used for the genetic evaluation of calving traits yet. A model for the estimation of breeding value of calving difficulty in populations Supported by the Ministry of Agriculture of the Czech Republic (Project No. MZe 0002701402)
Analysis of non-genetic factors affecting calving
difficulty in the Czech Holstein population
M. Fiedlerová
1, D. Řehák
1, M. Vacek
1, J. Volek
1, J. Fiedler
1, P. Šimeček
1,
O. Mašata
1, F. Jílek
21Institute of Animal Science, Prague-Uhříněves, Czech Republic
2Department of Veterinary Sciences, Czech University of Life Sciences, Prague-Suchdol, Czech Republic
ABSTRACT: The objective of this study was to analyze the effects of non-genetic factors affecting calving
difficulty in the Holstein population of the Czech Republic for subsequent compilation of the model for genetic evaluation as well as for herd management practice. Calving difficulty recorded in 1997–2006 was assessed in three categories: 1 = normal, 2 = hard pull, 3 = complicated. The original observations were transformed to an underlying normal scale. A data set containing 409 255 records was analysed by a linear model with fixed effects of season, parity of dam, sex of calf and Holstein gene proportion. All these effects were significant, and their appropriate categorization was considered. Analyses of additional factors such as gestation length, age at first calving and preceding calving interval were performed. The results revealed that gestation length was in a non-linear relationship with calving difficulty. A higher risk of difficult calving was associated with short or long gestation and with a prolonged preceding calving interval in multiparous cows. Calving difficulty should be adjusted for these factors. A decreased risk of difficult calving could be achieved by an altering of calving interval and age at first calving as a management tool.
of Czech dairy cattle breeds is being prepared at present. The objective of this paper was to analyze the effects of non-genetic factors affecting calving difficulty in the Holstein population of the Czech Republic. Furthermore, the knowledge of the in-vestigated effects might also be applied in herd management practice.
MATERIAL AND METHODS
Records of calving difficulty in the Holstein breed gathered in Central Bohemia and in the Highland regions in 1997–2006 were used in this study. Calving difficulty was assessed by farmers in three categories: 1 = normal, with the assistance of maxi-mally two persons without complications, 2 = hard pull, with the assistance of three or more persons, with vaginal or neck contusions, 3 = complicated, with serious difficulties and veterinary assistance required. Multiple births were omitted. Together with the calving score, the sex of the calf born was recorded but not in stillbirths. In such a case, sex was designated as class unknown. Records with parity higher than six were omitted for their rapidly decreasing frequency. Cows sharing less than 50% of Holstein genes were excluded. Breed groups were divided according to the Holstein or Red Holstein gene proportion: 1 = 89–100%, 2 = 76–88%, 3 = 50 to 75%. The edited data resulted in 409 255 records.
In the data set considered for the analyses, 94.14% of calvings were recorded as normal, 4.98% as pre-senting difficulties, and 0.84% as seriously com-plicated. Comparing the raw frequencies between regions during the observed period, there were ob-vious differences that could have been caused by slight deviations from the actual scale based on the subjectivity of scoring. Therefore, calving scores were transformed by means of their frequencies into a standardized normal distribution within the year of calving and the region. The frequencies were calculated for each stratum (year × region) and con-verted to class means on an underlying normal scale which enables the combination of different scales used in region and time. The transformed values were used instead of the original observations.
Analyses undertaken to identify non-genetic sources of variation used the GLM procedure of SAS (2003) for the multivariate least-squares method. Factors included in the initial analysis were the month of calving, parity of the dam, sex of the calf born, and the percentage of Holstein
genes. Additional models were compiled for in-vestigating the possible structure of these factors or for adding others (gestation length, age at first calving, preceding calving interval). The following linear models were used:
TCDijklmp = μ + Si + Pj + SCk + BGl + GLm + eijklmp
TCDijklp = μ + Si + Pj + SCk + BGl + a1GLijklp + + a2GLijklp2 + e
ijklp
for gestation length;
TCDiklnp = μ + Si + SCk + BGl + AFCn + eiklnp
TCDiklp = μ + Si + SCk + BGl + b1AFCiklp + b2AFCiklp2 + + e
iklp
for age at first calving;
TCDiklop = μ + Si + SCk + BGl + PCIo + eiklop TCDiklp = μ + Si + SCk + BGl + c1PCIiklp + eiklp
for preceding calving interval
where:
TCD = the transformed value of calving difficulty μ = overall mean
S = season; i= winter, spring, summer, autumn
P = parity; j = 1, 2+
SC = sex of calf; k = male, female, unknown
BG = breed group; l = H89-100, H76-88, H50-75
GL = gestation length; m = 1 to 8, intervals of five days
a1, a2 = regression coefficients
AFC = age at first calving; n = 1 to 6, intervals of four months
b1, b2 = regression coefficients
PCI = preceding calving interval, o = 1 to 6 (330 to 359, 360 to 389, 390 to 449, 450 to 539, 540 to 629, 630 to 750 days)
c1 = regression coefficient
e = residual error
The estimated effects of the investigated factors are shown in Figures 1–7 and are parameterised as Σαi = 0, in general.
RESULTS AND DISCUSSION
Initial analysis of significant factors affecting calving difficulty
explained 0.009, 0.169, 21.67 and 0.007% of the total variability, respectively. Frequencies in classes of calving difficulty by effect levels are presented in Table 1. A summary of the initial analysis of
vari-ance is given in Table 2. It can be assumed that a great amount of variability explained by the sex of calf (21.67%) is evoked by the class of stillbirths with unknown sex.
Month of calving. The spring months were
[image:3.595.66.533.102.542.2]asso-ciated with more difficult calvings, whereas the au-tumn months with slightly easier ones, as shown in Figure 1. There is, however, hardly any possibility of generalizing the differences in calving performance based on the month of calving. Meijering (1984) pointed out the inconsistent results of studies on this effect. McGuirk (1999) reported more difficul-ties in winter months in contrast to summer time. Fuerst and Egger-Danner (2003) suggested slightly easier calvings in late summer and autumn to be a Table 1. Incidence of difficult calvings (%) categorized within effects
Effect Number
of observations
Calving difficulty score
1 2 3
Month of calving
January 39 130 93.74 5.38 0.88
February 33 745 93.70 5.27 1.03
March 34 961 93.81 5.22 0.97
April 32 851 93.90 5.16 0.94
May 33 314 93.98 5.12 0.90
June 33 847 94.27 4.82 0.91
July 36 581 94.29 4.81 0.90
August 34 552 94.37 4.79 0.84
September 29 887 94.34 4.83 0.83
October 31 106 94.72 4.57 0.71
November 33 408 94.48 4.72 0.80
December 35 873 94.14 4.96 0.90
Parity
1 158 192 91.12 7.56 1.32
2 105 266 96.20 3.25 0.55
3 69 712 96.05 3.33 0.62
4 41 931 95.90 3.46 0.64
5 22 798 95.87 3.43 0.70
6 11 356 95.33 3.90 0.77
Sex of calf
Male 192 535 96.81 2.76 0.43
Female 188 582 97.50 2.21 0.29
Unknown 28 138 53.27 38.70 8.03
Breed group
H89-100 246 683 93.34 5.63 1.03
H76-88 89 408 94.94 4.30 0.76
H50-75 73 164 95.82 3.61 0.57
Table 2. Initial analysis of variance
Source of variation df SS
Month of calving 11 8.503
Parity 5 167.515
Sex of calf 2 21 492.74
Breed group 2 6.898
Error 409 234 76 526.758
[image:3.595.67.290.581.684.2]-0,012 -0,01 -0,008 -0,006 -0,004 -0,002 0 0,002 0,004 0,006
0,008 0,0
1 2 3 4 5 6 7 8 9 10 11 12 0.010 0.008 0.006 0.004 0.002 0.000 –0.002 –0.004 –0.006 –0.008 –0.010 –0.012 Eff ec t o n ca lv in g di ffi cu lty -0,02 -0,015 -0,01 -0,005 0 0,005 0,01 0,015 0,02 0,025 0,03 0,035
1 2 3 4 5 6
Parity Eff ec t on ca lvi ng dif fic ult y 0.035 0.003 0.025 0.002 0.015 0.001 0.005 0.000 –0.005 –0.010 –0.015 –0.020 Eff ec t o n ca lv in g di ffi cu lty
Month of calving
-0,315 -0,31 -0,305 -0,3 -0,295 -0,29
male female
Sex of calf
Eff ec t on ca lvi ng dif fic ult y –0.290 –0.295 –0.300 –0.305 –0.310 –0.315 Eff ec t o n ca lv in g di ffi cu lty -0,008 -0,006 -0,004 -0,002 0 0,002 0,004 0,006
H89-100 H76-88
H50-74 Holstein gene Eff ec t on ca lvi ng dif fic ult y
Sex of calf
0.006 0.004 0.002 0.002 0.000 –0.002 –0.004 –0.006 –0.008 0,77 0,78 0,79 0,8 0,81 0,82 0,83 0,84 0,85
260 263266 269272275 278281284 287 290 293296299302
Gestation length (days) Ca lvi ng dif fic ult y tra ns for m ed -0,015 -0,01 -0,005 0 0,005 0,01 0,015 0,02 0,025 Eff ec t on ca lvi ng dif fic ult y Estimated Regress 0,72 0,73 0,74 0,75 0,76 0,77 0,78 0,79 0,8
19 21 23 25 27 29 31 33 35 37 39 41
Age at first calving (mo) Ca lvi ng dif fic ult y tra ns for m ed -0,02 -0,01 0 0,01 0,02 0,03 0,04 0,05 0,06 Eff ec t on ca lvi ng dif fic ult y Estimated Regress
Estimated effects Estimated effects
Regression C al vi ng d iffi cu lty tr an sf or m ed 0.85 0.84 0.83 0.82 0.81 0.80 0.79 0.78 0.77 0.025 0.020 0.015 0.010 0.005 0.000 –0.005 –0.010 –0.015 Eff ec t o n ca lv in g di ffi cu lty
260 263 266 269 272 275 278 281 284 287 290 293 296 299 302
C al vi ng d iffi cu lty tr an sf or m ed 0.80 0.79 0.78 0.77 0.76 0.75 0.74 0.73 0.72 0.06 0.05 0.04 0.03 0.02 0.01 0.00 –0.01 –0.02 Eff ec t o n ca lv in g di ffi cu lty
[image:4.595.120.520.86.257.2]19 21 23 25 27 29 31 33 35 37 39 41
[image:4.595.315.530.91.255.2]Figure 1. Estimated effects of months on calving difficulty Figure 2. Estimated effects of parities on calving difficulty
[image:4.595.65.286.309.473.2]Figure 3. Estimated effects of calf sex (groups of known sex only) on calving difficulty
Figure 4. Estimated effects of breed group on calving dif-ficulty
Figure 5. Relationship between gestation length and calving difficulty
Figure 6. Relationship between age at first calving and cal-ving difficulty
Regression
[image:4.595.324.531.311.475.2] [image:4.595.66.539.537.712.2]result of pasturing activity and better condition of heifers/cows. Nevertheless, calving performance significantly changes during the year, and adjust-ments for this factor are necessary. A few differ-ences between consecutive months were found in this study. Therefore, they were joined together, and seasons of three months were compiled (win-ter = December to February, spring = March to May, summer = June to August, and autumn = September to November).
Parity. Parity was fitted as a six-level factor, ac-cording to the lactation number. Calving difficulty in primiparous cows significantly differed from that in cows in all other parities. The estimated effect of parity 1 was the highest, which means the highest frequency of difficult calvings, whereas the fewest difficulties were in parity 2, and after that calving difficulty rose until parity 6 (significantly different from others, including parity 1). The esti-mated effects of parities are presented in Figure 2. Delivery problems are mainly caused by foeto-pel-vic incompatibility (discrepancy between the size of the calf and the pelvic dimensions of the dam) (Meijering, 1984; Nogalski, 2003). Primiparous cows have not achieved their full development and mature body size yet (Kratochvílová et al., 2002), and the pelvic inlet area might relatively increase till maturity (Meijering, 1984). The size of the calf expressed either by birth weight (Přibyl et al., 2003) or calf size score (McGuirk et al., 1999) is usually included in the genetic evaluation as an additional trait describing calving performance. The size of the calf as a factor affecting calving difficulty has to be evaluated with respect to the parity group, as parity affects birth weight and dystocia inversely – heifers deliver calves with lower birth weights than do older cows (Johanson and Berger, 2003;
Přibyl et al., 2003), but show a higher rate of dys-tocia. Delivery progress in the first parity seems to be controlled by more or slightly different fac-tors than in other parities. With regard to this, the number of lactation groups could be reduced to two (parities 1 and 2+) or calving traits could be distinguished as different for the first and later parities. Both of these approaches are used in cur-rent National Genetic Evaluation Systems (2007, www-interbull.slu.se).
Sex of calf. The Czech recording system does
not require to record the sex of the calf if it is still-born. This is a crucial point for problems with the correct assessment of the calf sex effect. Sex was classified into three categories: male, female and unknown, with frequencies of 0.47, 0.46 and 0.07, respectively. In this case, a balanced sex ratio in the group with unknown sex has to be presumed. The sex of the calf born was the strongest effect in the model. Raw frequencies in Table 1 show a great difference between known and unknown calf sex groups. Figure 3 presents the estimated effects of groups with known sex. Male calves were deliv-ered with more difficult calvings. There is a general agreement that the sex of the calf is a major source of variability (Meijering, 1984; McGuirk et al., 1999; Fuerst and Egger-Danner, 2003).
Breed group. Purebred Holstein cows tended to
have more difficulties with delivery, whereas cows sharing genes of other breeds (mainly dual-purpose Czech Fleckvieh or rarely beef breeds) calved more easily. The estimated effects of breed groups are given in Figure 4. No comparative study of calving difficulty of Holstein and Czech Fleckvieh breeds has been done until now. However, a comparison of different beef breeds by Pilarczyk and Wójcik (2007) revealed thatlarge-sized breeds were also 0,92
0,925 0,93 0,935 0,94 0,945
300 360 420 480 540 600 660 720
Preceding calving interval (days) Cal
vin g diff icul ty tra nsf or me d
-0,008 -0,006 -0,004 -0,002 0 0,002 0,004 0,006 0,008 0,01 0,012
Eff ect on cal vin g diff icul ty Estimated effects
Regression
Estimated effects Regression
C
al
vi
ng
d
iffi
cu
lty
tr
an
sf
or
m
ed
0.945
0.940
0.935
0.930
0.925
0.920
0.012 0.010 0.008 0.006 0.004 0.002 0.000 –0.002 –0.004 –0.006 –0.008
Eff
ec
t o
n
ca
lv
in
g
di
ffi
cu
lty
[image:5.595.66.299.85.247.2]300 360 420 480 540 600 660 720
Figure 7. Relationship between preceding calving inter-val and calving difficulty
large at birth and had a higher risk of difficult calvings. Nogalski (2003) reported correlations between calving difficulty and birth weight (0.27) or measurements of calves (0.24–0.77); the body dimensions seem to be more relevant than the body weight of the calves born. We could presume that the increased share of breeds other than Holstein would be accompanied by more or less difficult calvings, but the breed effect in this study can conceal other factors: e.g. the breed group with 50–75% of Holstein genes has been excluded from the Holstein population in 2002; in previous years fewer difficulties were recorded because of less pre-cise recording; and not last, pure Holstein herds arising in the 1990’s were often kept separately with particular management and extra care. The results correspond to those given by Hradecká (2002) in her previous research of the Czech Holstein popu-lation. She determined an association between dam breed group and herd-year-season effect.
Analysis of other factors affecting calving difficulty
The effect categorization from the initial model was used for the following analyses that introduced gestation length, age at first calving and preceding calving interval as covariates or as fixed categorized effects. Simple statistics in all the factors are given in Table 3.
Gestation length. Gestation length is often
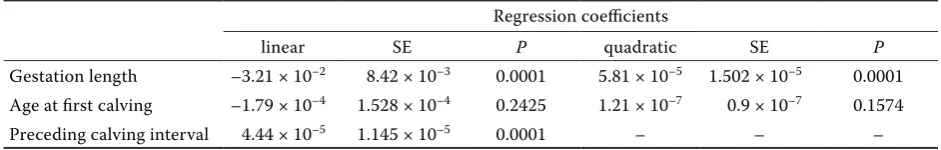
ana-lysed as a calving trait. Hansen et al. (2004) presented a weak genetic correlation between gestation length and calving difficulty, and thus the benefit of using gestation length as a trait correlated with calving characteristics in a genetic evaluation was found to be limited. However, Table 4 presents a pheno-typic significant non-linear relationship between calving difficulty and gestation length. More dif-ficulties are associated with short or long gestation periods, as shown in Figure 5. The figure indicates
that the intermediate value that minimizes the risk of calving difficulty is 275.8 days, which is shorter than the average value of 280 days. In shorter ges-tation, Johanson and Berger (2003) found a higher incidence of perinatal mortality that could cause an earlier onset of parturition and more difficulties during calving. Long gestation represented a higher incidence of difficult calvings that are probably as-sociated with higher birth weight and size of the calf, as Strapák et al. (2000) reported an essential relationship between birth weight and the calving process. If gestation length or birth weight were not evaluated separately, then gestation length seems to be of such importance that it could be included in the model for genetic evaluation.
[image:6.595.62.529.102.185.2]Age at first calving. Prospective causes of higher incidence of dystocia encountered when heifers calve at a relatively young or old age were reviewed by Meijering (1984). They can be attributed to the poor pelvic development, not fully compensated for by a smaller calf, or to a reduction in the elas-ticity of the pelvis and accumulation of fat in the pelvic region, but substantial evidence is missing. The results of this study are not conclusive either. Figure 6 represents a non-linear relationship be-tween calving difficulty and age at first calving but neither of the regression terms (linear or quadratic) was significant (Table 4). This corresponds to the fluctuating mean values of calving difficulty in groups according to age. Moreover, the frequencies in groups of months of age rapidly decreased after 36 months. The first calving at less than 22 months of age indicates a mating age of less than 13 months, which is a matter of error rather than a deliberate service at that age. Similarly, the first calving at more than 36 months of age indicates problems with conception or inadequate herd management. In accordance with the Description of National Genetic Evaluation Systems (2007, available at http://www-interbull.slu.se), records of extreme age at first calving are excluded from the evaluation. For example in NL/BE, records are omitted when Table 3. Simple statistics of gestation length, age at first calving and preceding calving interval
No. of
observations Mean SD categoriesNo. of Frequency
Gestation length 314 627 280.0 5.51 8 0.011, 0.029, 0.142, 0.354, 0.323, 0.113, 0.021, 0.007
the age at first calving is < 640 or > 1 074 days, whereas in DE/AT, data are excluded when the age at first calving is < 20 or > 40 months. Based on this analysis, it is recommended to omit records with age at first calving of < 22 or > 36 months.
Preceding calving interval. This trait is a useful characteristic of cow fertility. It combines at least two important aspects; first, the ability to return to the reproduction cycle, and second, the ability to confront the positive energy balance at the end of lactation and during the dry period and to prepare for parturition. Table 4 gives the results of regres-sion analysis, and Figure 7 represents the linear relationship between the length of the preceding calving interval and difficulties during subsequent parturition, together with the estimated effects of classes according to lengths of calving intervals on calving difficulty. The risk of difficult calving, which increases with prolonged calving interval, can be minimized by mating policy and by avoiding late services, which is a matter of herd manage-ment. Similarly to higher age at first calving, a long calving interval is also accompanied by the accu-mulation of fat and consequently by a higher risk of difficult calving. However, Berry et al. (2007) did not identify any significant relationship between body condition score at calving and dystocia like-ly as a result of very few over-conditioned cows. There are a few studies investigating the effect of pre-calving characteristics (body condition score, drying off, dry period, etc.) on calving traits. The preceding calving interval could be introduced as a covariate into the model for genetic evaluation of calving difficulty in multiparous cows.
CONCLUSIONS
As the course of delivery is a subjectively assessed trait, the crucial point in trying to improve calving performance is precision of data recording and
re-ducing the influence of many non-genetic factors. The analysis of these effects showed significant effects of gestation length and preceding calving interval as well. Therefore, calving difficulty should be adjusted for these factors. An altered calving interval and age at first calving could be used as a management tool for decreasing the risk of dif-ficult calvings, and these should be considered in a mating strategy.
Acknowledgement
The authors greatly thank the Czech-Moravian Breeders’ Association for supplying data, particu-larly Mgr. Václav Čermák for discussion about the data editing, and Mr. Arnold Harbers, NRS, Arnhem, the Netherlands, for valuable help and discussion about the transformation of the ob-served data to an underlying normal scale.
REFERENCES
Berger P.J. (1994): Genetic prediction for calving ease in the United States: data, models, and use by the dairy industry. J. Dairy Sci., 77, 1146–1153.
Berry D.P., Lee J.M., MacDonald K.A., Roche J.R. (2007): Body condition score and body weight effects on dys-tocia and consequent effects on postcalving perform-ance. J. Dairy Sci., 90, 4201–4211.
Fuerst C., Egger-Danner C. (2003): Multivariate genetic evaluation for calving ease and stillbirth in Austria and Germany. Interbull Bull., 31, 47–51.
Fuerst C., Fuerst-Waltl B. (2006): Breeding aspects of the calving process, rate of stillbirths and longevity in dairy cattle. Zuchtungskunde, 78, 365–383.
[image:7.595.62.533.115.190.2]Hansen M., Lund M.S., Pedersen J., Christensen L.G. (2004): Gestation length in Danish Holstein has weak genetic associations with stillbirth, calving difficulty, and calf size. Livest. Prod. Sci., 91, 23–33.
Table 4. Regression coefficients of gestation length, age at first calving and preceding calving interval on calving difficulty
Regression coefficients
linear SE P quadratic SE P
Gestation length –3.21 × 10⁻² 8.42 × 10⁻³ 0.0001 5.81 × 10⁻⁵ 1.502 × 10⁻⁵ 0.0001
Age at first calving –1.79 × 10⁻⁴ 1.528 × 10⁻⁴ 0.2425 1.21 × 10⁻⁷ 0.9 × 10⁻⁷ 0.1574
Hradecká (2002): The estimation of breeding value for calving difficulty [PhD. Thesis]. University of South Bohemia, CR. (in Czech)
Jamrozik J., Fatehi J., Kistemaker G.J., Schaeffer L.R. (2005): Estimates of genetic parameters for Canadian Holstein female reproduction traits. J. Dairy Sci., 88, 2199–2208.
Johanson J.M., Berger P.J. (2003): Birth weight as a pre-dictor of calving ease and perinatal mortality in Hol-stein cattle. J. Dairy Sci., 86, 3745–3755.
Junge W. von, Stamer E., Reinsch N., Kalm E. (2003): Prospects of reducing calf losses by means of breeding. Zuchtungskunde, 75, 479–488.
Kemp R.A., Wilton J.W., Schaeffer L.R. (1988): Pheno-typic and genetic parameter estimates for gestation length, calving ease and birth weight in Simmental cat-tle. Can. J. Anim. Sci., 68, 291–294.
Kratochvílová M., Hyánková L., Knížetová H., Fiedler J., Urban F. (2002): Growth curve analysis in cattle from early maturity and mature body size viewpoints. Czech J. Anim. Sci., 47, 125–132.
McGuirk B.J., Going I., Gilmour A.R. (1999): The genetic evaluation of UK Holstein Friesian sires for calving ease and related traits. Anim. Sci., 68, 413–422.
Meijering A. (1984): Dystocia and stillbirth in cattle – a review of causes, relations and implications. Livest. Prod. Sci., 11, 143–177.
National Genetic Evaluation systems (2007): Available at http://www-interbull.slu.se
Nogalski Z. (2003): Relations between the course of par-turition, body weights and measurements of Holstein-Friesian calves. Czech J. Anim. Sci., 48, 51–59. Pilarczyk R., Wójcik J. (2007): Comparison of calf rearing
results and nursing cow performance in various beef breeds managed under the same condition in north-western Poland. Czech J. Anim. Sci., 52, 325–333. Přibyl J., Misztal I., Přibylová J., Šeba K. (2003):
Multiple-breed, multiple-traits evaluation of beef cattle in the Czech Republic. Czech J. Anim. Sci., 48, 519–532.
SAS (2003): Release 9.1 (TS1M3) of the SAS® System for
Microsoft® Windows®. SAS Inc., Cary, NC, USA
Strapák P., Vavrišínová K., Candrák J., Bulla J. (2000): Calving ease and birth weight of calves of Slovak Sim-mental cows. Czech J. Anim. Sci., 45, 293–299.
Received: 2008–01–31 Accepted after corrections: 2008–04–11
Corresponding Author