Di
ff
erence in the E
ff
ect of Cold Working and Tempering on Microstructure of
Mod.9Cr
1Mo Steel
+1Yoshiki Shioda
1,2, Keiji Kubushiro
1and Yoshinori Murata
3,+21Materials Development, Research Laboratory, IHI Corporation, Yokohama 235-8501, Japan 2Boiler Design Department, Boilers Business Unit, IHI Corporation, Tokyo 135-8710, Japan
3Department of Materials, Physics and Energy Engineering, Graduate School of Engineering, Nagoya University, Nagoya 464-8603, Japan
The difference in the effect of cold working and tempering on the microstructure of Mod.9Cr1Mo steel was investigated by means of X-ray diffraction (XRD), electron channeling contrast image (ECCI) and electron backscatter diffraction (EBSD) technique. For simulating the cold working, interrupted tensile tests were conducted at room temperature to prepare some specimens with 020%strain. Tempering was conducted at 700760°C for 0.256 h in order to make heat-treated specimens with the same hardness level as interrupted tensile specimens. XRD was carried out to evaluate dislocation density. ECCI and EBSD technique were employed to evaluate lath width, inter-particle spacing and high-angle grain boundary spacing such as block and packet boundary, respectively.
In the pre-strained and the tempered materials, lath width, inter-particle spacing and dislocation spacing are different despite almost the same hardness. It was found that the dislocation substructure is completely different in the pre-strained and the tempered materials. [doi:10.2320/matertrans.H-M2019818]
(Received December 5, 2018; Accepted February 27, 2019; Published May 25, 2019)
Keywords: modified 9 chromium1 molybdenum steel, cold working, tempering, X-ray diffraction, electron channeling contrast image, electron backscatter diffraction, dislocation substructure
1. Introduction
Various high Cr ferritic heat resistant steels have been developed to improve the efficiency of thermal power plants.14) Among the high Cr ferritic heat resistant steels, Mod.9Cr1Mo steel has been widely used in main steam pipes and boiler tubes in Japan.4,5) This steel is heat-treated under adjusted conditions of such as the temperature and duration according to the use applications. For instance, thick-walled components such as main steam pipes are tempered at higher temperature for longer duration than those for boiler tubes.
The microstructure of this steel is tempered martensite structure and it has been reported that creep strength of the steel depends on the tempering conditions.68)For instance, it has been reported that the creep strength of the steel tempered at low temperatures is larger than that of the steel tempered at high temperatures due to larger hardness and higher dislocation density.69)On the other hand, when this steel is cold worked, the hardness and dislocation density increase. However, unlike in the steel tempered at low temperatures, in cold-worked steel the creep strength decreases.812)Therefore, when cold working and tempering are applied to the Mod.9Cr1Mo steel, there is commonality that the high dislocation density is retained in the steel and the hardness of the steel is larger, but the effect of tempering and cold working on creep strength is different. One reason for this may be the difference in microstructure. However, there have been no studies focusing on the difference in the effect of cold working and tempering on the microstructure of Mod.9Cr1Mo steel. Therefore, in this study the difference in the effect of cold working and tempering on the microstructure of Mod.9Cr
1Mo steel was investigated. For that purpose, interrupted tensile tests and tempering were conducted under various conditions to prepare pre-strained materials and heat-treated materials that have almost the same hardness.
2. Experimental Procedure
The test material was Mod.9Cr1Mo steel plate with a thickness of 50 mm. Table 1 shows the chemical composi-tion. The test material was normalized at 1050°C©3 h and tempered at 760°C©6 h. The grain size was approximately 20 to 30 µm. The test material was processed into the tensile specimens with a gauge length of 30 mm and a parallel portion of 6 mm. Interrupted tensile tests were conducted on them. The specimens were subjected to pre-strains of 0%, 2.5%, 5%, 7.5%, 10%, 15%, 17.5% and 20%. They are referred to as the pre-strained material. Vickers hardness was measured for the surface of each pre-strained material cut in parallel to the stress axis direction. At that time, the measurements were carried out three times under a load of 9.8 N, and the average value was taken as the hardness.
Next, in order to prepare specimens with almost the same hardness as the pre-strained materials, the specimens were cut out from the test material, normalized at 1050°C©3 h and tempered at 700 or 760°C for the various durations between 0.25 and 6 h. These are referred to as the tempered material. Vickers hardness was measured for the surface of each tempered material cut in parallel to the thickness direction. The measurements were carried out by the same method as pre-strained material. The indentation size was approximately 140190 µm, which was larger than the grain size of the test material.
To evaluate dislocation density of the pre-strained and tempered materials by X-ray diffraction (XRD), the cross-sections of them were mechanically polished with emery papers down to No. 2400, followed by buff polishing with
+1This Paper was Originally Published in Japanese in J. Jpn. Soc. Heat
Treat.57(2017) 343350.
+2Emeritus Professor, Nagoya University, Japan
were used to evaluate dislocation density.1320) Dislocation density was measured three times for each sample and was taken as the average value. Furthermore, electron backscatter diffraction (EBSD) technique was applied to each specimen. The EBSD technique was conducted under an accelerating voltage of 20 kV and a working distance of 15 mm. The measurement pitch is 0.2 µm and the measurement range is 80 µm©40 µm. EBSD technique was employed to measure high-angle grain boundary spacing such as block and packet boundary. The measurements of high-angle grain boundary spacing were conducted by EBSD images. The measure-ments were performed in threefields of view, and the average value measured at 100 points was taken as the high-angle grain boundary spacing.
Microstructural observations were conducted using the SEM-ECCI (SEM-Electron Channeling Contrast Imaging) technique. The ECCI technique was employed to measure lath width, inter-particle spacing and dislocation substructure, respectively. The ECCI is a technique that is used for observing material defects and subgrain boundaries by electron channeling contrast. The ECCI technique was conducted under an accelerating voltage of 25 kV and a working distance of 45 mm.
3. Results and Discussions
[image:2.595.310.533.90.342.2]3.1 Relationship between Vickers hardness and dis-location density
Figure 1 shows the change in Vickers hardness with pre-strain in Mod.9Cr1Mo steel. Vickers hardness increased monotonically with increasing pre-strain and leveled off at 17.5%. While Vickers hardness of non-pre-strained material was about 220 HV, the hardness of 20%pre-strained material was 280 HV, about 1.3 times that of non-pre-strained material.
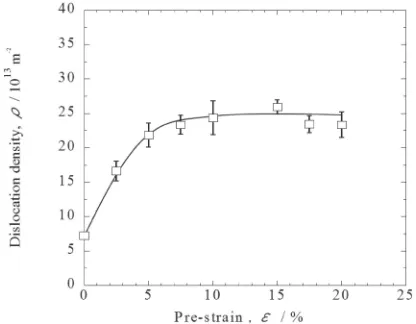
Figure 2 shows the change in dislocation density with pre-strain in Mod.9Cr1Mo steel. Dislocation density increased monotonically with increasing pre-strain and then leveled off to a constant value at 10% strain. In the non-pre-strained material, dislocation density was 7.3©1013m¹2, whereas in the 20% pre-strained material it was 23.3©1013m¹2. That is, dislocation density increased by a magnitude of three. Figure 3 shows the relationship between Vickers hardness and dislocation density, which are summarized from the
Fig. 1 Change in Vickers hardness with pre-strain in Mod.9Cr1Mo steel.
Fig. 2 Change in dislocation density with pre-strain in Mod.9Cr1Mo steel.
[image:2.595.323.531.377.539.2] [image:2.595.317.534.586.760.2]results in Fig. 1 and Fig. 2. Dislocation density reached a roughly constant value of approximately 23.3©1013m¹2at 10%strain or more, whereas Vickers hardness increased from about 240 HV to about 280 HV.
Figure 4 shows the relationship between Vickers hardness and dislocation density in the pre-strained and the tempered materials. Despite almost the same hardness, dislocation density of the materials pre-strained up to 15% was higher than that of the tempered materials. However, in the 17.5 and 20% pre-strained materials, the hardness and the dislocation density were almost the same as those of the tempered materials.
3.2 Comparison of microstructures between the pre-strained and the tempered materials
As described in the previous section, at a strain of up to 15%, the dislocation density of the pre-strained materials was higher than that of the tempered materials despite almost the same hardness.
Sawada et al. conducted nano-indentation tests on Mod.9Cr1Mo steel with various indent sizes, and clarified that the microstructural factors which affect the hardness of such a steel are dislocation density, inter-particle spacing and high-angle grain boundary spacing, and clarified that these microstructural factors additively contribute to hardness.21) Therefore, in order to clarify why dislocation density was different in some cases and same in others between the pre-strained and the tempered materials that have the same hardness, these microstructural factors were compared. The spacing of high-angle grain boundary was determined by EBSD, and lath width and inter-particle spacing were measured using the backscattered electron images (BEI). The pre-strained and the tempered materials used for microstructure comparison are as follows:
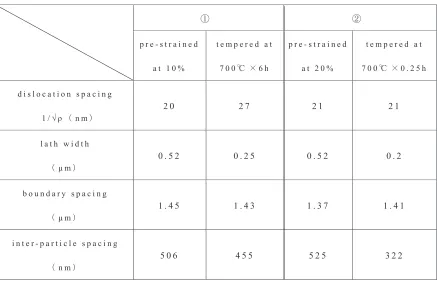
① 10% pre-strained material and 700°C©6 h tempered material in which the difference in dislocation density was the greatest
② 20% pre-strained material and 700°C©0.25 h tempered material that had almost the same dislocation density
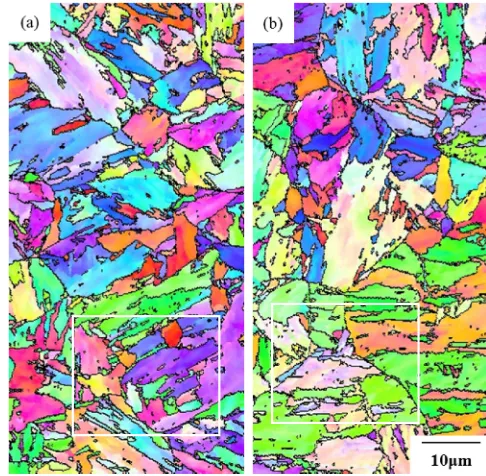
First, the microstructures for the materials in ① were compared. Figure 5(a) and (b) show the EBSD results of the 10% pre-strained material and 700°C©6 h tempered material, respectively. The measurement of high-angle grain boundary spacing was conducted by inverse pole figures (IPFs). The high-angle grain boundary spacing in the pre-strained and tempered materials was 1.45 µm and 1.43 µm, respectively, indicating no significant difference. The area of the white frame shown in Fig. 5 almost corresponds to the area of the backscattered electron images shown in Fig. 6. Figure 6(a), (c) and (b), (d) show BEI of the 10%pre-strained material and 700°C©6 h tempered material, respectively. In the pre-strained material, both the lath width and the inter-particle spacing are larger than in the tempered material. As a result of measuring the lath width of the pre-strained material and the tempered material from the BEI, it was 0.52 µm and 0.25 µm, respectively. The lath width in the tempered material wasfiner in the pre-strained material. On the other hand, as a result of measuring inter-particle spacing of the pre-strained and tempered materials, the inter-particle spacing was 506 nm and 455 nm, respectively. Inter-particle spacing in the tempered material wasfiner in the pre-strained material.
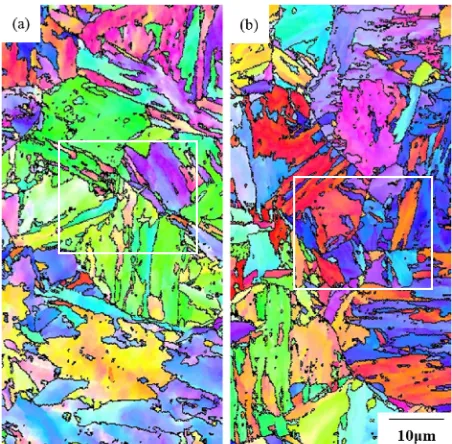
Next, the microstructures for the materials in ② were compared, in the same manner as in①. Figure 7(a) and (b) show the EBSD results of the 20%pre-strained material and 700°C©0.25 h tempered material, respectively. The high-angle grain boundary spacing in the pre-strained and the tempered materials was 1.37 µm and 1.41 µm, respectively, indicating no significant difference. On the other hand, in the pre-strained material, the contrast in the IPF was higher than in the tempered material. It is considered that this is due to the increase of the misorientation of the lath boundary or the formation of subgrains or dislocation cells with increasing pre-strain. Figure 8 shows the backscattered electron images. The area of the white frame shown in Fig. 7 almost Fig. 4 Relationship between dislocation density and Vickers hardness of
pre-strained materials and tempered materials in Mod.9Cr1Mo steel.
[image:3.595.63.277.67.266.2] [image:3.595.303.546.70.308.2]corresponds to the area of the BEIs shown in Fig. 8. Figure 8(a), (c) and (b), (d) show the BEIs of the 20% pre-strained material and the 700°C©0.25 h tempered material, respectively. In the 20% pre-strained material, much of the lath were recovered, and dislocation cells and subgrains were formed. In contrast, in the tempered material, afine lath was maintained and lath width was smaller than that 700°C©6 h tempered material as shown in Fig. 6(b) and (d). As a result of measuring the lath width of the pre-strained material and the 700°C©0.25 h tempered material from the BEIs, it was 0.52 µm and 0.20 µm, respectively. In the estimating lath width for the pre-strained material, the dislocation cells and
subgrains were excluded. As a result of measuring inter-particle spacing of the pre-strained and tempered materials, the inter-particle spacing was 525 nm and 322 nm, respec-tively, and precipitates in the tempered material were finer.
[image:4.595.120.476.69.337.2]3.3 Reason why the pre-strained and the tempered materials have the same hardness
Table 2 shows dislocation density, lath width, inter-particle spacing, and high-angle grain boundary spacing obtained for the materials described in①and②. In this paper, in order to compare microstructural factors with reference to the paper of Sawadaet al., the dislocation density was converted into the dislocation spacing.21)
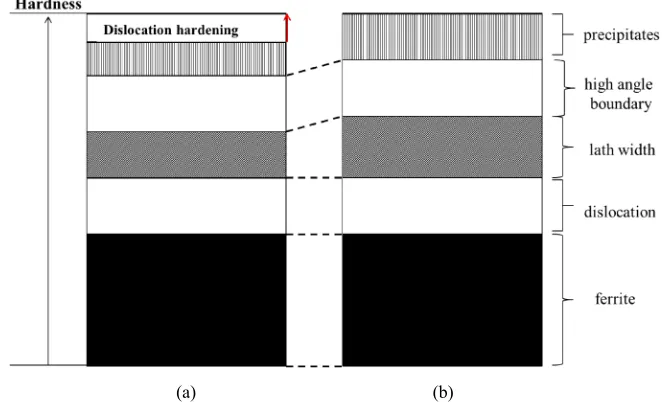
First, we consider the reason why the pre-strained and the tempered materials in ① with the same hardness. Figure 9 shows a schematic illustration for the change in contribution of microstructural factors to hardness. The matrix is ferrite both in the pre-strained and the tempered materials; therefore, the hardness of the matrix is the same in both materials.21) Because the dislocation density in the pre-strained material is higher than in the tempered material, the contribution of dislocation density to the hardness in the pre-strained material is greater than in the tempered material. On the other hand, the lath width and inter-particle spacing in the pre-strained material are greater than in the tempered material; therefore, in the pre-strained material these factors contribute less to the hardness. The high-angle grain boundary spacing is the same for both materials, so its contribution to the hardness is the same. Based on the above, in the pre-strained material, the dislocation density is higher in the pre-strained material than in the tempered material, but the lath width and inter-particle spacing are greater, and as a result, it seems that the hardness was almost the same as that of the tempered material.
Fig. 6 Backscattered electron images of Mod.9Cr1Mo steel. (a), (c) pre-strained at 10%, (b), (d) tempered at 700°C©6 h.
[image:4.595.56.282.375.597.2]Next, we consider the reason why the pre-strained and the tempered materials in②with the same hardness. Figure 10 shows a schematic illustration for the change in contribution of microstructural factors to hardness. The matrix is ferrite both in the pre-strained and the tempered materials; therefore, the hardness of the matrix is the same in both materials. Because the dislocation density is approximately the same
[image:5.595.120.476.69.337.2]between the pre-strained and the tempered materials, the contribution of dislocation density to hardness is the same for both materials. On the other hand, the lath width and inter-particle spacing in the pre-strained material are greater than in the tempered material; therefore, these factors contribute less to the hardness of the pre-strained material. The high-angle grain boundary spacing is the same for both materials, so its Fig. 8 Backscattered electron images of Mod.9Cr1Mo steel. (a), (c) pre-strained 20%, (b), (d) tempered at 700°C©0.25 h.
[image:5.595.81.518.391.672.2]contribution to hardness is the same. However, in this case, the hardness in the tempered material should be larger than in the pre-strained material.
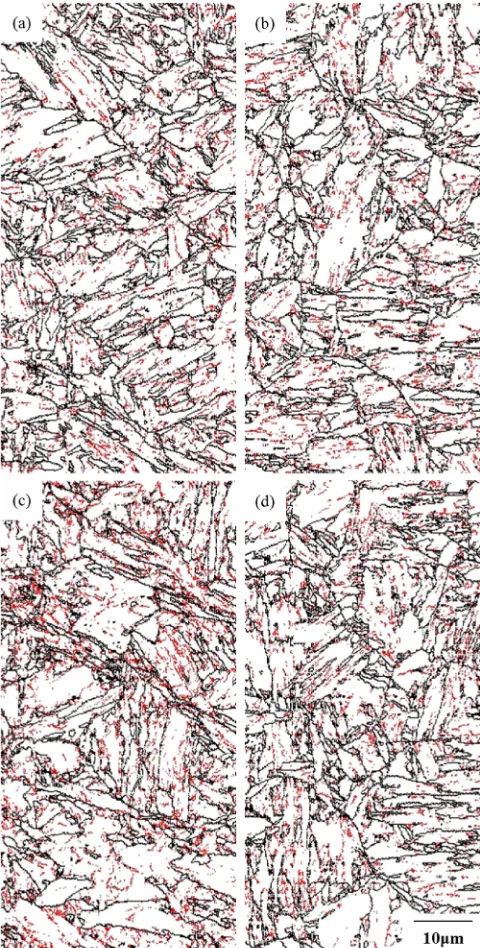
As the reason why the pre-strained material and the tempered material showed the same hardness, the effect of the dislocation substructure could be considered. It has been reported that in low-carbon martensite steels, dislocation introduced by martensitic transformation and dislocation introduced by cold-working have different properties.2225) Also, it is known that dislocation substructure affects strength properties such as tensile strength and hardness.26)Therefore, in order to compare the dislocation substructure of the pre-strained material and the tempered material, grain boundary maps were drawn by EBSD. The results are shown in Fig. 11. Red lines show small-angle grain boundary (dislocation substructure) with 15° misorientation between the measuring points, while black lines represent grain boundary with 15° or more misorientation. Figure 12 shows
the grain boundary length with 15° misorientation. The data of 15° boundary length of 15%pre-strained material is also shown. The 15° boundary length in the 20% pre-strained material was about 1.4 times that of the tempered material and the 10%pre-strained material, and 15° boundaries were arranged so as to form a boundary. In addition, the 15° boundary length monotonically increased as the pre-strain increased from 10% to 20%. As in the SEM observation results of Fig. 10, this means that the dislocation substructure in 20% pre-strained material is developed and finer. It is thought that the reason why the dislocation density did not change when pre-strain was applied more than 10%(Fig. 2) is because the dislocation substructure developed with the balance of the increase in dislocation density due to pre-strain and decrease in dislocation density due to recovery. Based on the SEM observations that indicate the development of dislocation substructure, it is clear that dislocation recovery has occurred. In addition, Nakashimaet al.reported that the
(a) (b)
Fig. 9 A schematic illustration for change of contribution of microstructural factors on hardness. (a) pre-strained at 10%, (b) tempered at 700°C©6 h.
[image:6.595.131.461.74.272.2](a) (b)
[image:6.595.131.462.322.523.2]dislocation density hardly changes when pre-strain is applied to ultra-low carbon steel.23)
Based on the above, it is thought that in the pre-strained material dislocation substructure develops with increasing pre-strain, which causes dislocation strengthening of the material and the hardness to be improved. Therefore, it is thought that the hardness of 20% pre-strained material and 700°C©0.25 h tempered material is about the same.
4. Conclusion
The difference in the effect of cold working and tempering on the microstructure of Mod.9Cr1Mo was investigated. As a result, the following conclusions were obtained.
In the pre-strained and the tempered materials, lath width, inter-particle spacing and dislocation substructure were different despite almost the same hardness. The dislocation substructure especially showed a clear difference. In the pre-strained material, the lath structure was recovered and the dislocation cells and subgrains were formed, whereas in the tempered material the fine lath structure was maintained. Based on the above, when cold working and tempering are applied to the Mod.9Cr1Mo steel, there is commonality that the high dislocation density is retained in steel and hardness of the steel is larger, but it was found that the dislocation substructure is completely different in the pre-strained and the tempered materials.
REFERENCES
1) Y. Sawaragi and A. Iseda: CAMP-ISIJ5(1992) 815.
2) M. Ohgami, H. Mimura, H. Naoi, T. Ikemoto, S. Kinbara and T. Fujita: Shinnittetsu Giho362(1997) 4953.
3) T. Fujita:Tetsu-to-Hagané76(1990) 10531059.
4) H. Monma, J. Ishiguro, T. Suto, T. Miyawaki, R. Iwamoto and T. Nakahara: Mitsubishi Heavy Industries Technical Review41(2004) 264267.
5) A. Fujita, M. Miyabe, Y. Kagiya, Y. Murata and M. Morinaga:J. Soc. Mater. Sci. Jpn.59(2010) 447454.
6) A. Iseda, H. Teranishi and F. Masuyama:Tetsu-to-Hagané76(1990) 10761083.
7) T. Nakazawa, Y. Yamada, T. Takahashi, M. Yamazaki and H. Hongo: J. High Press. Inst. Jpn.40(2002) 340347.
8) F. Masuyama and N. Nishimura: Proc. Experience With Creep-Strength Enhanced Ferritic Steels and New and Emerging Computational Methods, (ASME/JSME 2004 Pressure Vessels and Piping Confer-ence, 2004) PVP2004-2574, pp. 8591.
9) F. Abe:Metall. Metall. Mater. Trans. A34(2003) 913925. 10) H. Tachibana, T. Kanero and K. Hattori: Tetsu-to-Hagané72(1986)
S1355.
11) J. Gabrel and W. Bendick: Proc. CREEP8 Eighth International Conference on Creep and Fatigue at Elevated Temperatures, (ASME 2007 Pressure Vessels and Piping Conference, 2007) CREEP2007-26571, pp. 189195.
12) S. Caminada, G. Cumino, L. Cipolla and A.D. Gianfrancesco:Int. J. Press. Vessels Piping86(2009) 853861.
13) K. Nomura, Y. Shioda, K. Kubushiro, H. Nakagawa and Y. Murata: J. Soc. Mater. Sci. Jpn.66(2017) 5157.
[image:7.595.309.544.69.251.2]14) T. Ungár:Mater. Sci. Eng. A309310(2001) 1422. Fig. 11 15° boundary maps of Mod.9Cr1Mo steel. (a) pre-strained at
10%, (b) tempered at 700°C©6 h, (c) pre-strained at 20%, (d) tempered at 700°C©0.25 h.
[image:7.595.49.289.70.544.2]