Establishment and Optimization of Angle Dispersive Neutron
Diffraction Bulk Texture Measurement Environments
P. G. Xu, K. Akita, H. Suzuki, N. Metoki and A. Moriai
Quantum Beam Science Directorate, Japan Atomic Energy Agency, Tokai, Ibaraki 319-1195, Japan
Different from electron back-scattering diffraction and X-ray diffraction, neutron diffraction enables to directly measure the bulk texture because of the high penetrability and the large spot size of neutron beam and easily investigate the preferred orientation distributions of multiphase materials, coarse-grained materials and low symmetric materials including hexagonal metals, ceramics and rocks. In this paper, the texture measurement technical environments of two angle dispersive neutron diffractometers were established and optimized respectively, and their reliabilities were quantitatively examined through evaluating the bulk textures of a warm-pressed magnesium alloy and a multilayered multiphase steel sheet. It is found that the MUSASI-L neutron diffractometer with a single tube detector through selecting the proper collimation angle may achieve the similar texture evaluation reliability to the RESA-2 neutron diffractometer with one-dimensional position-sensitive detector, so that both of them are available to directly measure the bulk textures of various materials. In addition, the estimation of thermal neutron absorption shows that if a measurement error about 58%is acceptable, a cubic sample or a cylinder samples whose diameters is equal to its height may be employed to directly measure its bulk texture through completely bathing it in the well-collimated uniform neutron beam without doing the correction of neutron absorption anisotropy. [doi:10.2320/matertrans.MA201203]
(Received January 30, 2012; Accepted May 23, 2012; Published July 11, 2012)
Keywords: angle dispersive neutron diffraction, bulk texture measurement, magnesium, multiphase steel
1. Introduction
Because of low penetration depth (25 µm) of electron beams, the electron back-scattering diffraction may be used to obtain the local crystallographic orientation information from well-defined smooth sample surface and the micro-structure mapping simultaneously.1) Though X-ray’s pene-trability is dependent on the wavelength of X-ray target and the linear absorption coefficient of investigated material, its relative higher penetration depth compared to electron beam makes it convenient to measure the large area surface or thin film/sheet textures.13)Recently, the high energy synchrotron X-ray diffraction2)has higher penetrability up to several mm and is suitable to measure the bulk texture of fine-grained materials and also to evaluate the sub-grain orientation distribution of individual coarse grains considering that its beam size is usually about 5100©501000 µm2.
For neutron beam, the 34 orders of magnitude smaller mass absorption coefficient (see Table 1), the higher penetration depth (³40 mm for iron) and the broader beam spot than those of X-rays make it possible to ignore the angle dependent defocusing effect and the absorption effect to a certain extent if the bulk sample is completely bathed in the well-collimated uniform neutron beam.4)Therefore, neutron diffraction may be easily to measure the coarse-grained large samples directly, to get global or bulk average textures with high statistics57)and to evaluate thein situtexture evolutions under various loading/temperature environments.8,9) Re-cently, a neutron diffraction profile covering multiple peaks may be acquired through using a wide angle-span position sensitive detector (PSD) simultaneously, which is helpful to obtain individual diffraction intensities rapidly, especially for the multiphase materials, the big crystal unit cell materials and the low symmetric materials which involve the peak overlapping problem.1,1014) However, there are very few neutron diffraction instruments for texture measurement and sometimes, they are not accessible.2,15)
In our previous paper,7) the possibility of bulk texture measurement with neutron diffraction was attempted at RESA-1 by using the neutron beam (5©5 mm2) bathing in a cubic sample (15©15©15 mm3). However, the single phasefine-grained ferrite steel was thought too simple in the diffraction profile as a reference material to optimize the technical environments for texture measurement. Moreover, the long measurement time for each polefigure due to small beam spot made it inconvenient to measure the multiphase steels and other complicated materials. In this paper, the measurement mode of sample bathing in neutron beam was employed and the bulk texture measurement technical environments based on two angle dispersive neutron diffractometers with and without 1-dimensional PSD were established and optimized respectively, the effect of rotation of cubic sample on the diffraction intensity evaluation during bulk texture measurement was simply estimated, and then their reliabilities were quantitatively examined through measuring the bulk textures of a magnesium alloy and a multilayered multiphase steel.
2. Experimental Procedures
2.1 Establishment of neutron diffraction texture meas-urement environments
RESA-2 is an angle dispersive neutron diffractometer equipped with a 1-dimensional PSD, as shown in Fig. 1(a), mainly for the residual stress measurements and the ex-situ microstructure evaluations of small samples of structural materials. Because it shares the same beam port with another diffractometer MUSASI-L, the incident neutron beam guide pipe is mounted, and only the diffracted neutron beam detector of the diffractometer can slide on a steel dancefloor. A proper beam wavelength among =0.14, 0.15, 0.18, 0.22 nm can be selected through changing the takeoff angle of Si single crystal monochromator in order to obtain the optimized angle resolution for a specific sample. Moreover, Special Issue on Crystallographic Orientation Distribution and Related Properties in Advanced Materials III
its spot size of incident neutron beam can be adjusted among 120 mmW©120 mmH. MUSASI-L is a versatile angle dispersive neutron diffractometer equipped with a pyrolytic graphite (PG) monochromator, as shown in Fig. 1(b), for (i) the extreme condition experiments under high magneticfield and/or at ultra-low temperature and (ii) the evaluation experiments of physical characteristics of new neutron detectors and optical devices.16) The PG (002) or (004) diffraction at a takeoff angle of 42° may be used to obtain a different incident beam (=0.24 nm or 0.12 nm). A3He single-tube detector is utilized together with 40 mmW© 100 mmH incident and diffracted collimators with selective collimation angles (¡3=0.33, 0.67 or 1.36°).
Considering that the general texture sample is about 10©10©10 mm3for rapid sample alignment, the slit sizes for incident beam and diffraction beam of RESA-2 and MUSASI-L are usually set as 20©20 mm2 to ensure the sample bathing in the relative uniform neutron beam at as low as possible background scattering intensity. For coarse-grained materials, up to 20©20©20 mm3samples may be measured with the broadest beam of 40©40 mm2 available at MUSASI-L. During the pole figure measurement, the normal direction (ND) of investigated sample is aligned along the scattering vector of neutron diffraction (»=0°), and the rolling direction (RD) of investigated sample is setup along the vertical direction of neutron diffractometer (º=0°).
As shown in Fig. 1(c), a 6°-span PSD of RESA-2 enables to collect the diffraction profile from 12 reflection peaks of metals simultaneously and the integrated intensities can be extracted through Gaussian fitting of single or overlapping peaks to describe the distribution intensities of complete pole figures. As shown in Fig. 1(d), because of the single tube detector for MUSASI-L, the ª/2ª step scan may be carried out to get the essential diffraction profile for determining the peak center of any (hkl) reflection. However, it takes a long time to acquire the peak profiles at each (», º) angle grid position, so that the peak maximum intensities after the background correction are utilized to describe the distribution intensities of complete pole figures. In order to avoid the effect of peak overlapping on peak intensity, the proper incident and diffracted beam collimators need to be selected because the narrow collimation angle¡3(for example, 0.33° versus 0.67°) will reduce the instrument-dependent peak broadening effect (the full width at half maximum (FWHM) of austenite (311): 0.47° versus 0.63°) but the too-narrow collimation angle will decrease the diffraction intensity (at
10 s per step: 917 counts versus 1227 counts, respectively). Sometimes, the peak separation will not be effective for the overlapping peaks of low symmetry materials and the severely deformed multiphase materials. Consequently, for complex multiphase materials, it might be a good alternative way to measure the complete polefigures of non-overlapping reflections using collimators with larger collimation angle.
Figure 2 gives the dataflow charts of texture measurement and polefigure correction for these two diffractometers. The raw data from RESA-2 and MUSASI-L are of different data types due to different system control platforms. The raw data file collected from RESA-2 at each (»,º) angle grid position includes the neutron collecting time as well as the 2ª-angle value and the corresponding neutron diffraction counts at each PSD channel. Therefore, the measurement time for each polefigure may be different, for example, long time for overlapping peaks and short time for non-overlapping peaks. The polefigure correction software for RESA-2 can do peak fitting smoothly even though there are some over-weak peaks to exist. The well-aligned 1/4 raw pole figures may be compensated to obtain complete pole figures through considering the sample and crystal symmetries andfinally the pole figure input data files may be provided for LaboTex texture software based on the Arbitrarily Defined Cells (ADC) discrete method,17) for MTM-FHM texture soft-ware18) and Standard ODF texture software19)based on the series expansion method of spherical harmonic function. The raw data file collected from MUSASI-L at each » angle includes the measured peak intensities at different ºangles, and the raw data file for the background intensities is measured through » angle step scan. The software may correct the peak intensities and output the complete pole figure input data files directly for further ODF calculation.
2.2 Examination of neutron diffraction texture measure-ment environmeasure-ments
[image:2.595.52.549.82.198.2]Though a roughly spherical sample is ideally used during the reliable evaluation of neutron diffraction texture measure-ment technique in order to avoid the effect of sample absorption anisotropy, a cube or a cylinder whose diameter is equal to its height is much easier to prepare from the wires, sheets or plates of engineering materials along a same sample alignment direction. Therefore, the effect of rotation of a cubic sample on the expected neutron intensity (which was different with the measured diffraction intensity, because the former only involves the absorption effect) was simply estimated.
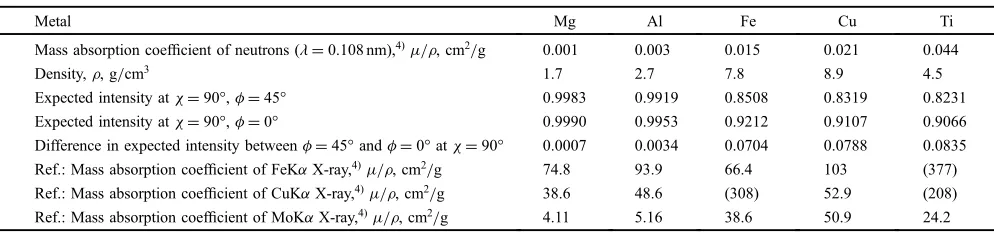
Table 1 Effect of sample rotation on the expected neutron intensity of a cubic sample (2ª=90°).
Metal Mg Al Fe Cu Ti
Mass absorption coefficient of neutrons (=0.108 nm),4)®/μ, cm2/g 0.001 0.003 0.015 0.021 0.044
Density,μ, g/cm3 1.7 2.7 7.8 8.9 4.5
Expected intensity at»=90°,º=45° 0.9983 0.9919 0.8508 0.8319 0.8231 Expected intensity at»=90°,º=0° 0.9990 0.9953 0.9212 0.9107 0.9066 Difference in expected intensity betweenº=45° andº=0° at»=90° 0.0007 0.0034 0.0704 0.0788 0.0835 Ref.: Mass absorption coefficient of FeK¡X-ray,4)®/μ, cm2/g 74.8 93.9 66.4 103 (377)
Ref.: Mass absorption coefficient of CuK¡X-ray,4)®/μ, cm2/g 38.6 48.6 (308) 52.9 (208)
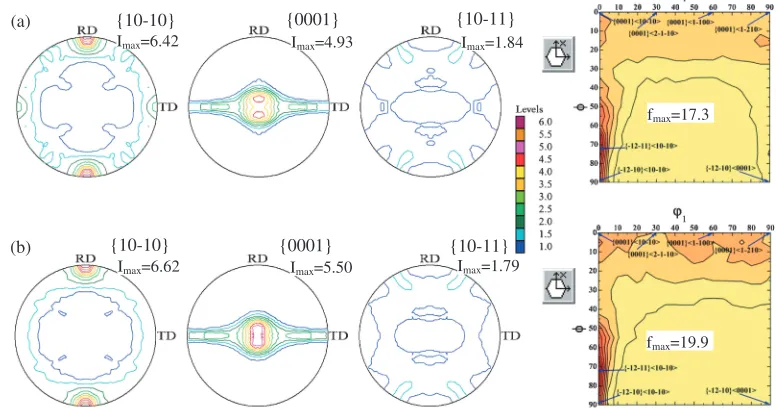
Different single phase and multiphase reference samples were employed here to optimize the technical conditions of texture measurement and examine the reliability. (1) The 2.1 mm-thick hot-rolled samples of magnesium alloy AZ3120) (nominal composition: Mg3 mass%Al1 mass%Zn) before and after 573 K warm press deformation were used here as a low symmetry material for reference. The thickness after press deformation was about 2.0 mm. Five 10©10 mm2 pieces of sheet were stacked along the original hot rolling direction after cutting from the center of magnesium alloy sheet using an automatic cutting machine. The f1010g, {0001} and f1011gcomplete pole figures were measured at MUSASI-L neutron diffractometer and the ADC discrete method17)was used to calculate the ODFs. (2) The austenite martensite multilayered multiphase steel composite21)used as a multiphase reference material was composed of SUS420J2 martensite layers (0.32C0.79Si0.60Mn13.52Cr in mass%) and SUS301 austenite layers (0.10C0.66Si0.97Mn 7.02Ni17.02Cr in mass%). The multilayered material in Austenite/Martensite /A/M/A/M++/A/M/A sandwich type (15 layers in total) obtained after 90% multipass hot rolled to form a strong multiphase-bonding interface was further 50%cold rolled at room temperature, and then rapidly annealed at 1273 K for 120 s. The final thickness was about 1.0 mm (each layer is about 70 µm). A 10©10©10 mm3 specimen was prepared by spark cutting and sheet-stacking along same rolling direction. The MUSASI-L collimator with 0.67° collimation angle may separate the austenite {111} reflection (2ª111: 34.789°; FWHM111: 0.702°) and the martensite {110} reflection (2ª110: 35.593°; FWHM110: 0.766°) because ¦2ª=2ª110¹2ª111=0.804° is larger than (FWHM111+FWHM110)/2=0.734°. The maximum peak intensities of the austenite {111}, {200}, {220} reflections and the martensite {110}, {200}, {211} reflections were measured using MUSASI-L neutron diffractometer (»=0 90° and º=0360° at 5° per step); the {111}/{110} overlapping reflection, the austenite{200},{220}reflections and the martensite {200},{211} reflections were measured using RESA-2 neutron diffractometer (»=090° andº=0 90° at 5° per step; the Gaussian integrated intensities of the unmeasured parts (º=90360°) of pole figures were compensated on the presumption of the sample symmetry). The series expansion method of spherical harmonic function was used to calculate the ODFs.18,19) The RD- and TD-section samples of this multilayered steel composite were polished with alcohol-based colloidal silica suspension, and a Hitachi S-4300SE field-emission scanning electron micro-scope equipped with the electron backscattering diffraction (EBSD) system was employed to determine the grain orientations and the microstructure morphology character-istics of constituent phases.
3. Results and Discussion
3.1 Sample rotation induced neutron absorption aniso-tropy
In order to simplify the estimation, the diffraction angle is presumed here as 2ª=90°, the cubic sample (10 mm© 10 mm©10 mm) is completely bathing in the uniform neutron beam, the divergent effect of neutron beam is
ignored here, and all the incident neutrons are received by the detector except the absorption effect. Moreover, only two specific expected intensities at»=90°,º=45° (Case I) and »=90°,º=0° (Case II) are estimated as shown in Fig. 3. It is well known that the absorption effect after beam pass distance t/cm in the sample may be calculated as the following formula.
I¼I0expð®tÞ ¼i0Aexpð®tÞ ð1Þ
I0is the incident neutron intensity,i0 is the incident neutron beam flux (which is presumed as 1), A is the cross section area of beam, and Iis the expected neutron intensity as the neutron beam passes through the material with a linear absorption coefficient ®. Therefore, the expected neutron intensity can be estimated from the following equation,
I ¼
ZZ
i0expð®ðt1þt2ÞÞdxdy ð2Þ
wheret1is the incident beam pass distance to the point (x,y) in the cubic sample, t2is the diffracted beam (here, i.e., the expected beam) pass distance to the point (x,y) in the cubic sample. For Case I, t1=1¹y and t2=1¹x; For Case II, t1¼ ffiffiffi2
p
þxy and t2¼ ffiffiffi2
p
xy in Region (i), t1¼ ffiffiffi
2
p
þxy and t2=y¹x in Region (ii), t1¼t2¼ ffiffiffi 2
p
xyin Region (iii), andt1¼ ffiffiffi2
p
xyandt2=y¹xin
Region (iv). The expected intensities of general metals after neutron absorption (2ª=90°, »=90°, º=45° or 0°) are summarized in Table 1. It is found that for the light metals such as the magnesium and the aluminum, the difference in expected intensity is less than 0.5%; for the iron, the copper, and the titanium, the difference in expected intensity is about 8%. Though the expected intensities at other orientations are not estimated, the difference in expected intensity for light metallic materials due to the sample absorption is believed to be negligible for a cube or a cylinder whose diameter is equal to its height.
For the iron, the copper, and the titanium, it is valuable to investigate the sample absorption induced measurement error of diffraction intensity. However, considering the neutron beam flux is much lower than the conventional X-ray beam flux, the usual neutron counts n=2001000 for angle dispersive neutron diffraction texture measurement corre-spond a relative counting errorðpffiffiffin=nÞabout 37%, which is comparable to above sample absorption induced measurement error. In other words, if the measurement error about 58%is allowable, it is unnecessary to do the absorption correction related to a cubic sample bathing in uniform neutron beam.
For the specific important materials needing higher texture evaluation preciseness, the spherical samples are recom-mended to prepare in order to reduce the sample absorption induced measurement error and the long time measurement at each Euler angle grid position is recommended to reduce the neutron counting error. If the spherical samples of the investigated material are not available, a powder reference sample with similar chemical composition in same shape will be valuable for the absorption correction.
3.2 Texture evaluation of a single phase material
0 1 1
x y
Incident
Expected
0 1
2
x yIncident
Expected
(a) (b)
(x,y)
(x,y) Scattering
vector
Scattering
vector
RD
RD (i)
(ii) (iii)
(iv)
Fig. 3 Illustration for the two specific orientations of a cubic sample during the simple neutron absorption estimation: (a) Case I,»=90°,º=45°; (b) Case II,»=90°,º=0°.
{10-10}
{10-10}
{0001}
{0001}
{10-11}
{10-11} (a)
(b)
fmax=17.3
fmax=19.9
Imax=1.84
Imax=4.93
Imax=6.42
Imax=6.62 Imax=5.50 Imax=1.79
Fig. 4 f1010g,{0001}andf1011gnormalized polefigures (stereographic projection) and¤2=0° ODF sections of AZ31 magnesium
alloy before (a) and after (b) 573 K warm press deformation by MUSASI-L neutron diffractometer.
(d) (c) (a)
Incident beam
Diffracted beam Sample
PSD Incident beam slit
Collimator
Goniometer
χ
φ
(b)
Incident beam
Diffracted beam slit Diffracted beam Collimator & single -tube detector
Sample
Goniometer
χ
φ
Fig. 1 RESA-2 and MUSASI-L angle dispersive neutron diffractometers: (a), (c) RESA-2 equipped with one-dimensional position-sensitive detector, easy to separate the austenite {111} and martensite {110} overlapping peak (at»=90°,º=0°) through Gaussianfitting; (b), (d) MUSASI-L equipped with single-tube detector and high beam flux, possible to separate the austenite {111} and martensite {110} low-overlapping peak (at »=90°, º=0°) through selecting a proper collimation angle.
(a)
(b)
[image:4.595.49.288.67.272.2] [image:4.595.348.502.76.497.2] [image:4.595.50.289.383.490.2] [image:4.595.102.490.557.762.2]the magnesium alloy AZ31 before and after warm press deformation. These pole figures show strong h0001i== ND basal textures with the dual-peak characteristics, similar to those from X-ray diffraction,22,23) which confirms that the cubic samples of light metals such as Mg and Al can be employed to directly measure the bulk textures and the correction to neutron absorption can be ignored. Moreover, the neutron diffraction results show that the strongest pole figures before and after warm press are both f1010g, not {0001}, and the ODFs exhibit that the preferred orientation with the maximum intensity is f1211gh1010i at (¤1=0°,
º=72.89°, ¤2=0°) which becomes stronger after warm press deformation. It suggests that the ODF calculation based on the multiple pole figure measurement is necessary to quantitatively evaluate the texture evolution of such low symmetry materials and to comprehensively optimize the deformation process.
3.3 Texture evaluation of a multiphase material
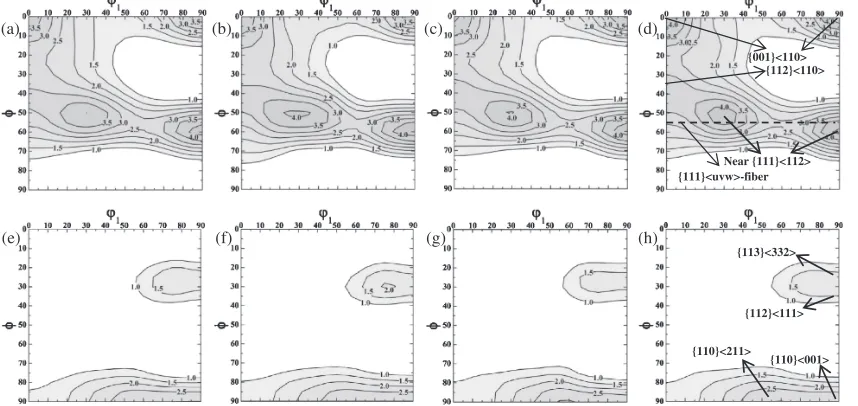
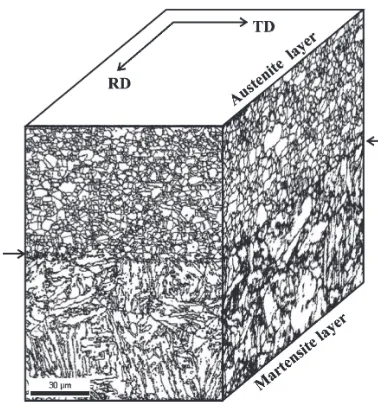
Figure 5 shows the ¤2=45° ODF sections for martensite (ad) and austenite (eh) calculated from the pole figures with (a, c, e, g) and without (b, d, f, h) {111}/{110} overlapping peaks measured at MUSASI-L and RESA-2. The martensite textures similar to each other (Figs. 5(a)5(d)) show a stronger{111}huvwi-fiber (the strongest orientation is located at ¤1=90°, º=60°, ¤2=45°) and a strong rotated cubic component, i.e., {001}h110i. It was reported that the 65% cold rolling of similar multilayered steel composite sheet composed of 13 austenite layers and 12 martensite layers in the sandwich type resulted in the strongest {112}h110i component of martensite texture as well as strong {111}huvwi-fiber and {001}h110i texture components.24) Because most of martensite blocks are not elongated toward the rolling direction anymore as shown in Fig. 6 and the rotated cube{001}h110icomponent still exists
after the rapid annealing at 1273 K for 120 s in the austenite single phase region of SUS420J2, the partial recrystallization is speculated to take place through the formation of {111}h112iat the expense of{112}h110icomponent. These {111}h112i and {001}h110i components are speculated to directly transform into austenite during rapid heating and then to transform backward into martensite during air cooling to room temperature. That is to say, the texture memory effect25)possibly occurred during the rapid annealing.
In Figs. 5(e)5(h), the austenite textures are also similar to each other, revealing the two texture evaluation methods based on RESA-2 and MUSASI-L angle dispersive neutron diffractometers are reliable. The strong {110}h211i com-ponent, the strong {110}h001i component and the relative weak{112}h111i-{113}h332icomponent exhibit the similar annealing characteristics of cold rolled metastable austenite of SUS304 during rapid annealing.26) Because the 50% cold rolling cannot enable the austenite in SUS301 steel layers to completely transform into martensite,24) the fine grained equiaxial austenite as shown in Fig. 6 is thought to partially form through the static recrystallization and partially form through the martensite-to-austenite reverse transformation.
For the structural ceramics, the piezoelectric ceramics, the thermoelectric ceramics, the superconductor, the mineral polycrystalline and other complex multiphase polycrystalline materials, the number of non-overlapping peaks that appeared in the measurable 2ª angle range may be not enough to measure the pole figures for ODF calculation and the overlapping peaks may be difficult to separate by adjusting the collimation angle, then the neutron diffractometer equipped with 1-D PSD is recommended to enable the multiple peak Gaussian convolution10,11) rather than the single-tube neutron diffraction experiments through peak intensity correction with background intensity.
(c)
(b) (d) (a)
(e) (f) (g) (h)
{001}<110> {112}<110>
{111}<uvw>-fiber Near {111}<112>
{112}<111> {113}<332>
{110}<211>
{110}<001>
Fig. 5 ¤2=45° ODF sections of martensite (ad) and austenite (eh) multilayered multiphase steel composite: (a) MUSASI-L, calculated
from{110},{200}and{211}polefigures; (b) MUSASI-L, calculated from{200}and{211}polefigures; (c) RESA-2, calculated from
{110},{200}and{211}polefigures; (d) RESA-2, calculated from{200}and{211}polefigures; (e) MUSASI-L, calculated from
{111},{200}and{220}polefigures; (f ) MUSASI-L, calculated from{200}and{220}polefigures; (g) RESA-2, calculated from
[image:5.595.87.516.73.276.2]4. Conclusions
The technical environments of bulk texture measurement for RESA-2 and MUSASI-L angle dispersive neutron diffractometers were established and optimized, the meas-urement error related to the rotation of a cubic sample was simply estimated, and the experiments on their reliabilities were carried out by using a warm-pressed magnesium alloy and a rapid-annealed multilayered multiphase steel composite. It is found that the MUSASI-L neutron dif-fractometer with a single tube detector through selecting the proper collimation angle and doing the proper background correction of peak maximum intensity may achieve the similar texture evaluation reliability to the RESA-2 neutron diffractometer with one-dimensional position-sensitive de-tector through employing the Gaussian integrated intensity, so that both of them are suitable for the bulk texture evaluations of various materials. Moreover, the estimation of thermal neutron absorption shows that if a 58% measurement error (partially related to the low neutron flux) is allowable, the correction of neutron absorption anisotropy will be negligible and a cubic sample or a cylinder samples whose diameters is equal to its height may be employed to directly measure its bulk texture through completely bathing it in the well-collimated uniform neutron beam.
Acknowledgements
The authors express their thanks to the reviewers for their valuable comments, Prof. J. Inoue at the University of Tokyo and Dr. E. Yukutake at Ibaraki Industrial Technology Center for providing the reference samples. This research was financially supported by the Grant-in-Aid for Young Scientists (No. 21860090) of Japan Society for the Promo-tion of Science (JSPS: KAKENHI).
REFERENCES
1) A. D. Rollett:Texture Measurement and Analysis, ASM Handbook,
22B, Metals Process Simulation, (ASM International, 2010) pp. 9299. 2) H. R. Wenk and P. Van Houtte:Rep. Progress. Phys.67(2004) 1367
1428.
3) H. G. Brokmeier:Physica B: Condensed Matter385386(2006) 623 625.
4) H. R. Wenk:Texture and Anisotropy, ed. by U. F. Kocks, C. N. Tome and H. R. Wenk, (Cambridge University Press, 1998) pp. 126177. 5) H. R. Wenk:J. Appl. Crystal.24(1991) 920927.
6) H. R. Wenk, L. Lutterotti and S. C. Vogel:Nucl. Instr. Methods Phys.
Res. A515(2003) 575588.
7) P. G. Xu, Y. Tomota, H. Suzuki, T. Suzuki, S. Machiya and F. X. Yin:
Mater. Trans.49(2008) 20332039.
8) H. R. Wenk, I. Huensche and L. Kestens:Metall. Mater. Trans. A38
(2007) 261267.
9) P. G. Xu, Y. Tomota, S. C. Vogel, T. Suzuki, M. Yonemura and T. Kamiyama: Rev. Adv. Mater. Sci.33(2012) in press.
10) S. Lazik and C. Esling:Textures Microstruct.22(1993) 115.
11) H. J. Bunge:Textures Microstruct.24(1995) 112.
12) W. Schäfer, P. Merz, E. Jansen and G. Will:Textures Microstruct.14
18(1991) 6571.
13) E. Jansen, W. Schäfer, W. Kockelmann and G. Will: Textures
Microstruct.2627(1996) 1118.
14) J. F. Zhang, E. H. Kisi and O. Kirstein:J. Appl. Cryst.44(2011) 1062 1070.
15) P. G. Xu, H. Suzuki, S. Harjo and T. Suzuki: Proc. 120th Spring Conf., (Japan Inst. Light Metals, 2011) pp. 289290.
16) N. Metoki and K. Kaneko:Hamon16(2006) 120122.
17) K. Pawlik:Phys. Status Solidi B Basic Res.134(1986) 477483.
18) P. Van Houtte: The “MTM-FHM” Software System, Version 2, (Katholieke Universiteit Leuven, Belgium, 2000) pp. 176.
19) H. Inoue and T. Takasugi: Z. Metallkd.92(2001) 8288.
20) P. G. Xu, T. Suzuki, E. Yukutake and S. Morooka: Proc. 120th Spring Conf., (Japan Inst. Light Metals, 2011) pp. 291292.
21) J. Inoue, S. Nambu, Y. Ishimoto and T. Koseki:Scr. Mater.59(2008)
10551058.
22) E. Yukutake, J. Kaneko and M. Sugamata: J. Japan Soc. Technol. Plasticity44(2003) 276280.
23) M. Kohzu, K. Kii, Y. Nagata, H. Nishio, K. Higashi and H. Inoue:
Mater. Trans.51(2010) 749755.
24) L. Li, F. X. Yin, Y. Tanaka, S. Kishimoto and K. Nagai:Mater. Trans.
51(2010) 911917.
25) N. Yoshinaga, H. Inoue, K. Kawasaki, L. Kestens and B. C. De Cooman:Mater. Trans.48(2007) 20362042.
26) H. Sumitomo: Tetsu-to-Hagane77(1991) 558565. Fig. 6 Grain boundary mapping with high angle misorientation (²15°) of
[image:6.595.72.261.67.269.2]