On-the-Fly Kinetic Monte Carlo Simulation of Atomic Diffusion in
L
1
0Structure
K. Sato, S. Takizawa and T. Mohri
Division of Materials Science and Engineering, Graduate School of Engineering, Hokkaido University, Sapporo 060-8628, Japan
The atomic diffusion inL10ordered phase is investigated using on-the-fly kinetic Monte Carlo simulations. We construct a simple model
system ofL10ordered phase. Although a simple model system is employed, the simulation results reveal quite complex aspects of the atomic
diffusion. It is found that the activation energies of both constituent atoms change significantly depending on the composition and that the correlation factor makes the activation energy larger for both atoms. It is also demonstrated that the diffusion anisotropy in theL10phase which
is observed in the experiment is reproduced. We discuss the different diffusion behavior of the constituent atoms, and clarify the mechanism of the diffusion anisotropy inL10phase. [doi:10.2320/matertrans.MBW201015]
(Received October 29, 2010; Accepted December 15, 2010; Published February 2, 2011)
Keywords: atomic diffusion,L10phase, diffusion anisotropy, correlation factor, on-the-fly kinetic Monte Carlo simulation
1. Introduction
Diffusion in ordered alloys is complex because of their structural order which inhibits random walk of a vacancy on a lattice. There have been many theoretical studies on diffusion in ordered alloys.1–6)Most of studies focus on the particular
mechanism such as 6 jump cycle,2)anti-structural bridge,3)
sublattice diffusion4)etc., and the target system is confined to cubicL12andB2ordered phases. However, the mechanisms
listed above do not always operate alone, but some of them can be combined or coexisted to take place diffusion phenomena, therefore a priori knowledge on their relative importance should be needed in order to calculate the precise diffusion coefficient and activation energy. Obtaining such knowledge is quite difficult.
In recent years, an ordered intermetallic compound of
-TiAl has attracted attentions as potential application for high temperature structural materials. This compound has
L10 structure which consists of alternating (002) layers of
Al and Ti atoms. The diffusion properties including the self-diffusion, interdiffusion and grain-boundary diffusion in TiAl have been widely investigated.7–10) Especially, it is
interesting that the diffusion of Ti in TiAl shows anisotro-py,10) where the diffusion coefficient of Ti in the direction perpendicular to the [001] is larger than in the direction parallel to [001]. However such diffusion anisotropy is known only in TiAl and a general argument is not yet established at present.
Kinetic Monte Carlo simulation (kMC)11)plays a key role
in the study of the diffusion in surface,12)disordered13)and
ordered alloys5,6,14) etc. Generally the migration energies
which depend on the local atomic configuration are treated as an input or adjustable parameter in kMC. To prepare the list of migration energies for an input parameter, the energy is usually calculated on the limited number of atomic config-urations. In the studies of diffusion in ordered alloys, the evaluation of the migration energies are made on almost perfect ordered structure, especially when one intends to estimate the diffusion coefficient with a specific mechanism. But by a simple consideration, it is easy to understand that the number of distinct configuration in a binary fcc alloy is very large even when taking into account the first nearest neighbor
atoms of a vacancy (212¼4096without symmetry
consid-eration). In fact, a wider range of the atoms affects the migration energy. In spite of the importance of the migration energies in this approach, evaluating the migration energies on all atomic configurations prior to the kMC simulation is not possible in practice.
Recently, to overcome this limitation, on-the-fly kMC is developed.15–17) In this method the migration energy is calculated at any time during a simulation combined with the sophisticated saddle point energy calculation method such as nudged elastic band18) or dimer method.19)On-the-fly kMC has been applied to a wide area of diffusion problem, and successfully calculated the diffusion coefficient16) and
un-covered the underlying mechanisms20,21) with reasonable
computational times.
The aim of the present study is to investigate the atomic diffusion mechanism of ordered L10 phase with a simple
model system by on-the-fly kMC.
2. Model System
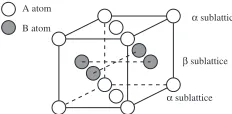
We consider the binary system consisting of A and B atoms. The L10 structure is shown in Fig. 1. L10 structure
consists of alternating (002) layers of A and B atoms, and each layer forms a sublattice denoted here as and
respectively. In the stoichiometric composition at zero temperature, these sublattices are occupied by atoms A and B, respectively. As the temperature increases or the compo-sition deviates from 50%, anti-site atoms are introduced in the crystal. To perform the simulation of diffusion in ordered phases, we must know the equilibrium properties of the system such as Long Range Order parameter (LRO) and anti-site atom concentrations as functions of temperature and alloy composition. So we start from the calculation of equilibrium states of the system by the Monte Carlo simulation based on the Metropolis algorithm.
The fcc supercell is prepared by repeating the cubic fcc unitcell by101010with periodic boundary conditions. We employ the 12–6 Lennard-Jones (LJ) potential given by
ijðrÞ ¼ij
r0ij
r
12
2 r0ij
r
6
" #
; ð1Þ
where ij and r0ij are the depth of energy and the nearest
neighbor distance of i-j pair respectively and shown in Table 1. We set these parameters,ijandr0ij, taking the Ti–
Al system as the target system in mind, because L10 phase
exists in this system. Though LJ potential is not enough sophisticated to accurately reproduce cohesive properties of real systems, these parameters qualitatively reproduce a few aspects of Ti–Al system; Ti-Ti bond is stronger than Al-Al bond since the cohesive energy of Ti is larger than that of Al, and Ti has larger atomic radius than Al, corresponding to
AB> BB> AA, andr0BB>r0AAin our case.
The phase diagram is calculated by equilibrium Monte Carlo simulation with above potential. The obtained order-disorder transition temperature is 850 K at stoichiometry. The kMC simulation is performed on the single phase field in the phase diagram using the same model system.
3. On-the-Fly Kinetic Monte Carlo Simulation
We first describe kMC with residence time algorithm in brief. We only consider the nearest neighbor jump, since it is considered that the nearest neighbor jump is dominant up to higher temperatures in close packed crystals. There are 12 neighbor atoms around the vacant site in fcc crystal. The migration rate is calculated by pi¼expðEmi =kBTÞ where Eimis the migration energy for the atom i which is the local atomic configuration dependent, and kB is the Boltzmann
constant. One of the 12 atoms is selected in proportion to this probability and is moved to the vacant site. The above trial is repeated. In the residence time algorithm the relation between the Monte Carlo steps and the physical time is determined by
t¼ logR
0
¼ logR
PexpðEm
i =kBTÞ
ð2Þ
where0is the sum of the rates of all possible atom jumps,
andRare the attempt frequency and a random number in the range of½0;1Þ, respectively.
In the standard kMC, some migration energies are calculated on the limited number of configurations prior to the simulation. Usually the number of migration energy is order101to102. This list of migration energies is provided as an input parameter. In fact, the migration energy strongly depends on the local atomic configuration and a system
encounters a lot of configurations in a simulation. The migration energies of order101 to 102 can never cover the
configurations appearing in a simulation. Therefore it is not enough to perform a reliable diffusion simulation. Partic-ularly in ordered phases, a local atomic configuration including the anti-site atoms severely affects the activation energy through the correlation factor.6) It is necessary to
calculate the migration energy on each local atomic config-uration.
In the present study, we employ the on-the-fly kMC,15)
where a migration energy is evaluated at every time for all MC trials. To speed up the on-the-fly kMC simulation, when evaluating the migration energy, we cut subsystem consisting of555fcc unitcell, so that the vacancy is a center, from whole simulation cell with periodic boundary condition. The migration energy calculation is done on this subsystem as following procedure. First, the energy of subsystem is minimized with respect to all atom displacements, and the saddle point energy is evaluated by dimer method19)for all
neighboring atom jumps. Once 12 migration energies on a configuration are determined, the set of energy is stored, and if system will meet again the same configuration, then the set of energy will be reused.20,21) To distinguish the
configu-rations each other, we assign the unified number to the configuration according to the following manner: we scan the atomic species around the vacancy up to third nearest neighbor (42 atoms). Replacing atomic species A or B with 0 or 1 and arranging 42 digits of 0 or 1 in a constant manner, we obtain a binary number ranging from 0 to242. In this way, we can encode local atomic configuration and store and recall migration energies for each configuration. In the typical simulations, we calculate the migration energies on the order of103to104configurations to make105Monte Carlo trials.
In this work, we concentrate our attention on the character-istics of the diffusion associated with the atomic configu-rations, migration energy, correlation factor and their interrelations. Instead, some points related to the diffusion are neglected. It is assumed that the vacancy concentration is a constant at all temperatures, meaning that the calculated diffusion coefficient is normalized by actual vacancy con-centration. It is noted that diffusion coefficient is proportional to the vacancy concentration and this assumption would not change the diffusion mechanism if the vacancy concentration is low enough so that the vacancies do not interact with each other. We put the same attempt frequency for both A and B atom, and ignore its local configuration dependence. By these assumptions, the calculated activation energy includes only contribution of migration energy in the present simulations.
4. Results
The self-diffusion coefficient,Dis calculated by Einstein relation,
Di¼ hR2iðtÞi
2dt ; ð3Þ
[image:2.595.109.225.73.130.2]where hR2iðtÞi is the mean square displacement (MSD) of the diffusing atom, i denotes a chemical species, d is the dimension of the space, and t is the time. The MSDs are calculated by on-the-fly kMC at 800 K on the stoichiometric
Table 1 LJ parameters used in this study.
A-A B-B A-B
ij(eV) 0.35 0.45 0.50
r0ij(A˚ ) 2.92 2.97 2.92
A atom
B atom α
sublattice
β sublattice
α sublattice
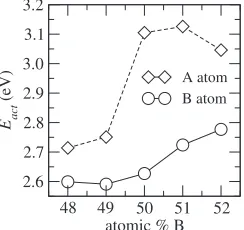
[image:2.595.47.293.185.229.2]composition and shown in Fig. 2(a). Also Fig. 2(b) presents the MSD components of direction perpendicular and parallel to the [001] for B atom. One can confirm from these figures that each MSD linearly increases with time, and we can determine the diffusion coefficients from these slopes. It should be emphasized that the diffusion coefficient of B atom exhibits clear anisotropy, i.e., the diffusion of the direction perpendicular to [001] is faster than that of direction parallel to [001], which is the same behavior as the experimental observation.10)On the other hand for A atom,
such behavior does not appear, that is isotropic (data is not shown). We carry out the simulations at various temperatures and compositions to obtain the activation energies from Arrhenius plot. The obtained activation energies are shown in Fig. 3. It is confirmed from Fig. 3 that A and B have a different composition dependence of the activation energies. The activation energy of A atom varies abruptly across the stoichiometric composition; in B-rich side the activation energy is higher than A-rich side. For B atom, the activation energy increases gradually in B-rich side while in A-rich side that is nearly constant. These results imply that different diffusion mechanisms operate for A and B atoms. Specifi-cally A site atom enhances A atom diffusion, but B anti-site atom makes B atom diffusion slower, and the diffusion anisotropy is only observed in B atom. In the following, we examine this striking difference based on the distribution of migration energy and correlation factor.
5. Discussion
At first we summarize a general background of diffusion in ordered phases to proceed respective discussions.
The diffusion coefficient can be written down as
D¼D0CVexp Em kBT
f ð4Þ
with
D0¼
1 6a
2
ð5Þ
and f is the correlation factor defined as
f ¼hR
2i
Na2; ð6Þ
where Na2 represents total jump distance when atoms experience perfectly random N times jump with a unit jump lengtha,CVis the vacancy concentration andis the attempt
frequency. As stated above, in the present simulation, it is assumed that the vacancy concentration is constant inde-pendent of the temperature, and the attempt frequency is same for both A and B atoms. Moreover we consider only nearest neighbor jump as a diffusion event. Therefore in eq. (4), the temperature dependence of the diffusion coef-ficient is attributed directly toT in the exponential term, the correlation factor and Em by the above assumptions. Note
that we make a distinction between the term activation energyandmigration energyin this paper. The former means the slope of Arrhenius plot, and the latter represents the migration energy for respective jumps, i.e,Em¼EsadEini,
whereEsadandEinirepresent the saddle point and initial state
energy respectively.
The correlation factor plays an important role in the diffusion in ordered phases. An atomic motion by exchanging with a vacancy is extremely restricted, since random jumps of atoms cannot maintain an equilibrium LRO at a temperature. It is expected that the correlation factor becomes high with increasing the temperature because the concentration of the anti-site atoms also will increase, which allows atomic jumps to occur more randomly. This temperature dependency contributes the activation energy.
The possibility of the change in migration energy with temperatures is originated from the transition of diffusion mechanism. Such transition sometimes emerges as a curva-ture of Arrhenius plot. In fact, that behavior is observed experimentally on Ti diffusion in TiAl.7)
In what follows, we discuss in turn the characteristic of B and A atoms diffusion, and finally the diffusion anisotropy in
L10phase.
5.1 B atom diffusion
We produce a distribution of the migration energy by counting the migration energy realized during the simu-lation. Figure 4 shows the distribution of the migration energy of B atom appearing in the simulation at 650 K on the stoichiometric composition. It is seen that there is a single sharp peak in the distribution. The average energy of this distribution is comparable with the activation energy obtained from Arrhenius plot, 2.65 eV. Furthermore by analyzing the simulation results, it is found that this energy is corresponding to the sublattice diffusion of B atoms. This holds for different temperatures and compositions, indicating that the sublattice diffusion is 0.0 0.5 1.0 1.5 2.0 2.5 3.0
t/ν−1 × 1020
0 10 20 30 40
〈
R
2 〉 / m
2 ×
10
-20
A atom B atom
0.0 0.5 1.0 1.5 2.0 2.5 3.0
t/ν−1 × 1020
0 10 20 30 40
〈
R
2 〉 / m
2 ×
10
-20
// [001]
⊥ [001]
(a) (b)
Fig. 2 (a) MSD of A and B atoms at 800 K. (b) MSD components of direction perpendicular to [001] and parallel to [001] for B atom.
48 49 50 51 52
atomic % B 2.6
2.7 2.8 2.9 3.0 3.1 3.2
Eact
(eV)
A atom B atom
[image:3.595.57.282.74.180.2] [image:3.595.109.231.237.352.2]predominant in B atom jumps within the whole range of composition.
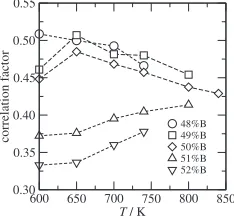
The temperature dependency of the correlation factors calculated from eq. (6) is shown in Fig. 5. The results are different in A- and B-rich side. In the A-rich side, the correlation factors are nearly constant and coincide with the value for random jumps on the 2D square lattice, 0.467, while in B-rich side, the values are slightly lower and increase with the temperature. In the B-rich side, B anti-site atoms inevitably exist on sublattice, and diffuse not only intra-sublattice but also inter-intra-sublattice. The inter-intra-sublattice jump must be asymmetric with initial and final states, i.e, the migration energy with creating an anti-site atom is higher than one with eliminating an anti-site atom in general, which may results in the correlated motion of B atom. As a result, the correlation factors decrease and have some temperature dependency which is ascribed to the increases of activation energies in B-rich side. In spite of these differences between A-rich and B-rich side, the correlation factor of B atoms is relatively high and comparable with the value for 2D square lattice at whole range of compositions in question, and we confirm by inspection of the results that the intra-sublattice jump within thesublattice is predominant for the B atoms. Therefore we can conclude that B atoms diffuse almost randomly withinsublattice, and that the migration energy is less affected by the existence of anti-site atoms but the temperature dependency of the correlation factor induces small increments of the activation energies in B-rich side.
5.2 A atom diffusion
In contrast to the results of B atom, several peaks are generated in the migration energy distribution of A atom shown in Fig. 6. The result is obtained at 650 K and 50%B. The average migration energy of the distribution is lower
than the activation energy, 3.1 eV, which expresses that the low energy peaks do not contribute effectively to net displacement of A atoms, and the high energy peaks dominate the A atom diffusion under this temperature and composition.
By tracing the jumping process during the simulation, each peak is specified to the atomic motions relating to the A anti-site atom as follows,
VþA!VþA ð2:2eVÞ
VþA!V ð2:4eVÞ
V!VþA ð2:8eVÞ:
In these reaction equations,V,VandAdenote a vacancy on sublattice, a vacancy on sublattice, and A anti-site atom onsublatice, respectively. The final equation,V!
VþA, means, for example, a creation of an A anti-site atom onsublattice by a migration of vacancy onto. We also confirm that the peak located around 2.3 eV includes several kinds of atomic motions involved with two or more anti-site atoms. It is important to notice that all reactions involve the A. Combining the above reactions, one can create a sequence of the atomic motions which is equivalent to the so-called anti-structural bridge (ASB) mechanism,1,8)
VþA!V!VþA: ð7Þ
Note that there is another type of ASB,
VþA!VþAþA!VþA: ð8Þ
Hereafter we denote the former and latter as ASB1 and ASB2 respectively. In the ASB1, first the A anti-site atom is eliminated, and next created by the subsequent jump of A atom while it is first created and eliminated in ASB2. Both ASBs provide the displacements of two A atoms, where A anti-site atom plays a role as a ‘bridge’. It is pointed out in the previous studies1,7)that ASB mechanism is important forL1
0
phase in high temperatures or off-stoichiometric composi-tions. Both ASBs consist of the same elemental reactions, i.e., a creation of an anti-site atom and a elimination of an anti-site atom, and their migration energies are almost the same for both ASBs in the present work. Thus we cannot distinguish the two sequences from the distribution. We note, however, that there are differences between two ASB sequences which are the sublattice occupied by the vacancy and the local configuration during the sequence. In ASB2, the vacancy located onsublattice is surrounded by two A anti-site atoms in the intermediate state, while for ASB1 the
2.5 2.6 2.7 2.8
Em(eV) 0
20 40 60 80
frequenc
y
Fig. 4 Distribution of the migration energy for B atom at 650 K and 50%B.
600 650 700 750 800 850
T / K 0.30
0.35 0.40 0.45 0.50 0.55
correlation f
actor
48%B 49%B 50%B 51%B 52%B
Fig. 5 Correlation factor for B atoms.
2.1 2.2 2.3 2.4 2.5 2.6 2.7 Em(eV) 0
10 20 30 40 50
frequenc
y
[image:4.595.372.485.71.188.2] [image:4.595.112.226.71.179.2] [image:4.595.110.227.229.339.2]vacancy locates on thesublattice without A anti-site atom. When a vacancy located onsublattice encounters an A site atom, the vacancy exchanges the position with the A anti-site atom with a high probability. Once this reaction is achieved, the next motion of the vacancy is almost random if anti-site concentrations are not high enough. This is corresponding to ASB1 sequence. In contrast, when a vacancy located onsublattice exchanges the position with regular A atom which creates the A anti-site atom, and the vacancy has two A anti-site atoms after exchange, the vacancy exchanges the position with one of the A anti-site atoms with the high and equal probability. Among two motions, one is the jump back motion of the vacancy and the other is ASB2 sequence. Thus the probability to realize the ASB2 is about one half, and ASB2 becomes more correlated motions. From this reason, it is expected that ASB1 operates more efficiently than ASB2 in the present simulations.
The effectiveness of ASB mechanisms is proportional to the concentration of A anti-site atom. This fact indicates that ASB operates more effectively in A-rich side while it works less in B-rich side. This consequence is in agreement with the results of the activation energy in the previous section.
The obtained correlation factors of A atom are shown in Fig. 7. In the whole composition range, the correlation factors exhibit a pronounced temperature dependency, which leads to the high activation energy. This tendency differs from B atom, and arises from the strong dependence of migration energies on the local configuration. This depend-ence results in the low correlation factor through a lot of back and forth motion of A atoms. In the present case, the lowest migration energy in reaction equations above is the motion of A atom insublattice and, it appears to be symmetric with the initial and final states. Hence the low migration energy is retained for both states, and this A atom moves back and forth in the configuration, leading to the low value of the correlation factor because it does not cause the net displace-ment of A atom. This situation is similar to the impurity diffusion in a dilute solid solution, where the rate of effective displacement of A atom is determined by the dissociative jump of A atom with the vacancy. This effect becomes significant at low temperature and A-rich side.
5.3 Diffusion anisotropy inL10 phase
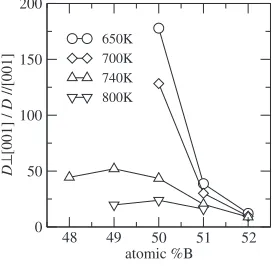
As mentioned in §5.1, B atom diffusion mainly occurs in the sublattice which consequently results in the diffusion anisotropy. We estimate the ratio of the diffusion coefficient perpendicular to [001] to that parallel to [001] at four
temperatures, and the results are shown in Fig. 8. We cannot estimate the ratio due to poor statistics for below 700 K at A-rich side. The ratio decreases with the deviation of the composition toward B-rich side and increasing the temper-ature except for the results of 800 K in which the maximum is located on 50%B.
We consider two factors affecting the anisotropy. One is concentration of B anti-site atom, and another is the LRO of the system. We first discuss the effect of B anti-site atom.
As mentioned in §5.1, in B-rich side, the inter-sublattice diffusion of B atom contributes to the overall diffusion of B atom as well as the intra-sublattice diffusion. It is clear that the probability of the inter-sublattice jumps is proportional to the B anti-site concentration. Hence the anisotropy decreases in B-rich side. Additionally, we found that when B atom jumps fromsublattice tosublattice, the migration energy of return jump of B atom will be about the same with that of intra-sublattice diffusion of B atom. Thus the probability for the diffusion of the vacancy insublattice is as high as that of the jump back motion. In the former case (intra-sublattice migration of the vacancy), the vacancy walks away from the B anti-site atom and migrates tosublattice again. However to preserve the LRO at a temperature, two kinds of jumps, creating B anti-site atom (to), and eliminating B anti-site atom ( to ), must be balanced. Therefore an B anti-site atom is eliminated elsewhere. This makes inter-sublattice diffusion of B atom more random and effective, and thus reduces the anisotropy.
The effect of the LRO on the anisotropy is more simple. It is obvious that the diffusion anisotropy is originated from the anisotropy of the L10 lattice. At high temperatures, the
lattice contains locally disordered region where the isotropic diffusion takes place. In the low temperatures, LRO is high for all composition range. In the present model system, order-disorder transition temperatures are 850 K at 50%B and 835 K at 49 and 51%B, respectively. Thus the anisotropy is governed by the LRO at 800 K. By these two reasons, the maximum anisotropy in 740 K may appear at 49%B.
6. Conclusion
The detailed investigation of the diffusion inL10 ordered
phase is performed by on-the-fly kMC. In the present study, although we employ the quite simple model, the results includes the rich features of atomic diffusion inL10ordered
600 650 700 750 800 850
T / K 0.00
0.01 0.02 0.03 0.04
correlation f
actor
48%B 49%B 50%B 51%B 52%B
Fig. 7 Correlation factor for A atoms. 48 49atomic %B50 51 52
0 50 100 150 200
D
⊥
[001] /
D
//[001]
650K 700K 740K 800K
[image:5.595.109.227.72.185.2] [image:5.595.359.497.75.208.2]phase. It is found that the obtained activation energies strongly depend on the alloy composition, and the different atomistic mechanisms of the diffusion operate for both constituent atoms. The diffusion anisotropy is reproduced and correlated with two factors, i.e, the concentration of B anti-site atom and LRO of the system.
REFERENCES
1) Chr. Herzig, T. Przeorski and Y. Mishin: Intermetallics7(1999) 389. 2) M. Arita, M. Koiwa and S. Ishioka: Acta Metall.37(1989) 1363. 3) I. V. Belova and G. E. Murch: Intermetallics6(1997) 115.
4) H. Numakura, T. Ikeda, M. Koiwa and A. Almazouzi: Phil. Mag. A77 (1998) 887.
5) M. Athe´nes, P. Bellon and G. Martin: Phil. Mag. A76(1997) 565. 6) A. Van der Ven and G. Ceder: Phys. Rev. Lett.94(2005) 045901. 7) Y. Mishin and Chr. Herzig: Acta Mater.48(2000) 589.
8) Chr. Herzig and S. Divinski: Intermetallics12(2004) 993.
9) W. Sprengel, N. Oikawa and H. Nakajima: Intermetallics4(1996) 185. 10) T. Ikeda, H. Kadowaki and H. Nakjima: Acta Mater.49(2001) 3475. 11) A. B. Borts, M. H. Kalos and J. L. Lebowitz: J. Comput. Phys.17
(1975) 10.
12) M. Basham, F. Montalenti and P. A. Mulheran: Phys. Rev. B73(2006) 045422.
13) B. Swoboda, A. Van der Ven and D. Morgan: J. Phase Equilib.31 (2010) 250.
14) M. Leitner, D. Vogtenhuber, W. Pfeiler and W. Pu¨schl: Intermetallics 18(2010) 1091.
15) G. Henkelman and H. Jo´nsson: J. Chem. Phys.115(2001) 9657. 16) C. Harris, R. Tedstrom, M. S. Daw and M. J. Mills: Comp. Mater. Sci.
37(2006) 462.
17) E. A. Bleda, X. Gao and M. S. Daw: Comp. Mater. Sci.43(2008) 608. 18) G. Henkelman and H. Jo´nsson: J. Chem. Phys.113(2000) 9978. 19) G. Henkelman and H. Jo´nsson: J. Chem. Phys.111(1999) 7010. 20) O. Trushin, A. Karim, A. Kara and T. S. Rahman: Phys. Rev. B72
(2005) 115401.