Munich Personal RePEc Archive
A natural language generation approach
to support understanding and
traceability of multi-dimensional
preferential sensitivity analysis in
multi-criteria decision making
Wulf, David and Bertsch, Valentin
Karlsruhe Institute of Technology, Economic and Social Research
Institute, Trinity College Dublin
27 October 2016
A natural language generation approach to support understanding and traceability
of multi-dimensional preferential sensitivity analysis in multi-criteria decision
mak-ing
David Wulf
Chair of Energy Economics, Karlsruhe Institute of Technology (KIT), Hertzstr. 16,
76187 Karlsruhe, Germany
Valentin Bertsch (corresponding author)
Economic and Social Research Institute, Whitaker Square, Sir John Rogerson’s Quay,
Dublin 2
Phone: +353 1 863 2088
Department of Economics, Trinity College Dublin
Key words
2 A natural language generation approach to support understanding and traceability of multi-dimensional preferential sensitivity analysis in multi-criteria decision mak-ing
Abstract
Multi-Criteria Decision Analysis (MCDA) enables decision makers (DM) and decision analysts (DA) to analyse and understand decision situations in a structured and formalised way. With the increas-ing complexity of decision support systems (DSSs), it becomes challengincreas-ing for both expert and novice users to understand and interpret the model results. Natural language generation (NLG) techniques are used in various DSSs to cope with this challenge as they reduce the cognitive effort to achieve understanding of decision situations. However, NLG techniques in MCDA have so far mainly been developed for deterministic decision situations or one-dimensional sensitivity analy-ses. In this paper, a concept for the generation of textual explanations for a multi-dimensional pref-erential sensitivity analysis in MCDA is developed. The key contribution is a NLG approach that provides detailed explanations of the implications of preferential uncertainties in Multi-Attribute Value Theory (MAVT). It generates a report that assesses the influences of simultaneous or sepa-rate variations of inter-criteria and intra-criteria preferential parameters determined within the deci-sion analysis. We explore the added value of the natural language report in an online survey. Our results show that the NLG approach is particularly beneficial for difficult interpretational tasks.
1 Introduction
With the aim of enabling transparent and systematic support in complex decision
situa-tions, Multi-Criteria Decision Analysis (MCDA) represents a formalised framework for the
analysis of different decision alternatives (Stewart, 1992; Geldermann et al., 2009). While
such decision support approaches are aimed at providing guidance to decision makers
(DMs), their increasing mathematical complexity often hinders a straightforward
under-standing and traceability on the part of the DMs. Consequently, a lot of cognitive effort is
required in order to analyse, interpret and derive adequate implications from the obtained
model results which is particularly challenging for novice users (Spiegelhalter and
Knill-Jones, 1984; Henrion and Druzdzel, 1991; Gregor and Benbasat, 1999). DMs consider
such models as a ‘black box’, so they mistrust or even reject them (Brans and Mareschal, 1994; Bell et al., 2003), which leads to a gap between available information on the one
hand and processible information on the other hand.
To compensate for this, further explanations of decision analysis results promote
3 system (Greer et al., 1994; Greef and Neerincx, 1995; Dhaliwal and Benbasat, 1996;
Gregor and Benbasat, 1999; Parikh et al., 2001; Geldermann, 2010). The use of natural
language generation (NLG) techniques to generate such explanations automatically
based on the model results has been proposed, for instance, by Papamichail and French
(2003), Geldermann et al. (2009) or Clark et al. (2010). However, existing DSSs with
ex-planatory functions focus mainly on the communication of their largely deterministic
re-sults. For instance, Papamichail and French (2000, 2003) developed an approach
allow-ing for the generation of two kinds of reports. Their comparative report analyses and
com-pares the performance of two alternatives in relation to each other. Their sensitivity report
assesses the influences of varying the relative importance of a specified criterion on the
alternatives’ overall performance. However, their sensitivity report is limited to generate
explanations for a one-dimensional sensitivity analysis only, i.e. when one weight
parame-ter is varied at a time.
Aimed at analysing the impact of simultaneous variations of multiple preference
parame-ters on the alternatives’ overall performance, many approaches for multi-dimensional
sen-sitivity analysis have been proposed in the MCDA literature (see e.g., French and
Rios-Insua, 1991; Butler et al., 1997; Lahdelma et al., 1998; Bertsch et al., 2007; Scholten et al.
2015; Bertsch and Fichtner, 2016). Many of these, including Bertsch and Fichtner (2016),
are based on Multi-Attribute Value/Utility Theory (MAVT/MAUT, cf. Keeney and Raiffa,
1976). However, albeit their higher complexity in comparison to one-dimensional
sensitiv-ity analyses, these approaches do not include any advanced explanation systems. This
shortcoming leads to an increase of the above mentioned gap between available and
processible information.
Our contribution in this paper is therefore the presentation of a NLG approach providing
explanations for multi-dimensional sensitivity analyses, i.e. explaining the results in the
presence of multiple preferential uncertainties aimed at increasing user understanding in
such decision situations. We developed explanatory text in an iterative process with
ex-perts and implemented the NLG approach in Matlab. We added the resulting explanation
system as an extension module to the existing DSS SIMADA (‘Simulation Based
Multi-Attribute Decision Analysis’, see Bertsch and Fichtner, 2016). In order to validate our
con-cept with novice users we conducted an online survey and can show that the generated
explanations are beneficial, particularly for rather difficult interpretational tasks.
We demonstrate what new results/explanations can be obtained by applying the
devel-oped NLG approach for a case study in the context of the energy sector transformation in
4 investment decisions in the presence of high uncertainties resulting from regulatory,
techno-economic, ecological and social interdependencies as well as the preferential
in-fluences of different interest groups. This is the reason why a wide range of MCDA
meth-ods is used in this area which apply different methodologies in order to model the decision
situation and the involved uncertainties (cf. Browne et al., 2010; Heo et al., 2010; Kaya
and Kahraman, 2011; Streimikiene et al., 2012; Ribeiro et al., 2013; Ren et al., 2013;
Lühn et al., 2014). For literature reviews of the application of MCDA methodologies in
en-ergy decision situations please refer to Greening and Bernow, 2004; Pohekar and
Ramachandran, 2004; Diakoulaki et al., 2005; Zhou et al., 2006; Loken, 2007; Kowalski et
al., 2009; Wang et al., 2009; Abu-Taha, 2011 and Scott et al., 2012.
This paper is structured as follows: In section 2, we review and summarise relevant
litera-ture related to (i) preferential uncertainty modelling in MCDA, (ii) benefits of explanation
systems in general and (iii) existing explanatory features in MCDA tools. In section 3, we
describe the conceptual structure and the main steps of the development process of our
NLG approach before we present its evaluation in section 4. In section 5, we demonstrate
the explanatory power of our NLG approach on the basis of a case study. Section 6
pro-vides a discussion and limitations of the methodology. Section 7 concludes the paper.
2
Related work
In this section, we summarise and present relevant, existing literature related to our own
work. While section 2.1 presents approaches for modelling preferential uncertainties in
MCDA (with a focus on multi-dimensional sensitivity analysis), section 2.2 provides a short
overview of user needs and benefits from explanation systems in DSSs. Section 2.3
pre-sents existing implementations of explanation systems in MCDA tools. The selection of
literature is adjusted to the focus of our paper, i.e. the presentation of a NLG approach
explaining results of multi-dimensional sensitivity analyses. The selection of previous work
can therefore not be comprehensive and will, to some extent, always be subjective.
2.1
Modelling of multiple preferential uncertainties
Uncertainties in decision situations originate from a variety of sources (Zimmermann,
2000), which arise with the application of different MCDA methodologies. This includes for
example the preference elicitation which is influenced by behavioural effects as well as
the limitations of modelling a decision situation in general (French, 1995; Gilovich et al.,
2002; Hämäläinen and Alaja, 2008; Morton and Fasolo, 2009; Scholten et al., 2015).
Nu-merous uncertainty classifications exist in the literature (Morgan et al., 1990; Belton and
vari-5 ety of modelling approaches in MCDA theory to deal with them (cf. Durbach and Stewart,
2012; Broekhuizen et al., 2015).
Especially in group decision-making situations it can be challenging to attain a consensus
regarding the individual preferences. The application of precise preference information in
the DSS might therefore not be feasible motivating the application of parameter ranges for
one or multiple preference parameters (Ríos Insua and French, 1991; Butler et al., 1997;
Matsatsinis and Samaras, 2001; Jiménez et al., 2005; Mustajoki et al., 2005; Mateos et
al., 2006; Mavrotas and Trifillis, 2006; Jessop, 2011; Jessop, 2014; Scholten et al., 2015).
Many of these approaches use Monte Carlo Simulation techniques, where a probability
distribution needs to be defined for each preference parameter. In case there is none or
strongly limited information on the parameter available, uniform distributions are often
applied (see e.g., Bertsch and Fichtner, 2016).
For situations where very little or no preferential information is available or the DMs are
unwilling to provide such information, Lahdelma et al. (1998) introduce Stochastic
Multiob-jective Acceptability Analysis (SMAA). SMAA has been used in many MCDA applications
(Tervonen and Figueira, 2008). The method is designed as an inverse method aimed at
exploring the weights for which an alternative achieves a certain rank, which is expressed
in terms of a ‘rank acceptability index’ for each alternative (Lahdelma and Salminen,
2001). Tervonen (2014) developed an open source software which provides a user
inter-face for the application of different SMAA approaches. While it definitively makes the
analysis of a decision situation more convenient for a DA, the software does not include
NLG techniques for explaining the used terminology or the implications for the decision
situation that can be derived from the model results.
Bertsch et al. (2007) propose a simulation based approach for multi-dimensional
sensitiv-ity analysis in MAVT/MAUT similar to the one proposed by Butler et al. (1997). Both of
these are designed as direct approaches as opposed to the inverse SMAA. The approach
by Bertsch et al. (2007) has been implemented in the DSS SIMADA (Bertsch and
Ficht-ner, 2016). SIMADA is mainly aimed at supporting two groups of users: decision makers
(DM) and decision analysts (DA). Implemented in Matlab, SIMADA features a graphical
user interface that provides various visualisations. These support a thorough analysis of
the obtained model results and their sensitivity towards changes of various (uncertain)
modelling parameters considered in the decision analysis, including inter-criteria
prefer-ence parameters (i.e. weights) and intra-criteria preferprefer-ence parameters (i.e. value function
shapes). For the latter, an exponential form is assumed (Kirkwood, 1997). With different
preferential parameters applied in the Monte Carlo simulation runs, the aggregated model
m-6 ance scores (OPS). In the MAVT module of SIMADA, the OPSs are calculated with an
additive value function (Belton and Stewart, 2002; Basson and Petrie, 2007; French et al.,
2009). SIMADA also calculates the alternatives’ expected overall performance scores
(EOPS), which can be seen as an aggregate performance indicator (Durbach and
Stew-art, 2009). A selection of visualisations provided by SIMADA is presented in section 5.
Since the analysis of the influences of various uncertain preferential parameters on the
model results can become rather complex, the focus of this paper is on the NLG approach
to support the user in understanding the multi-dimensional sensitivities of the decision
situation (further details of its conceptual structure and implementation are provided in
sections 3 and 4).
2.2
User needs and benefits of explanations
To interpret and derive implications from a sensitivity analysis purely based on data and
visualisations remains challenging for DMs and even for DAs (Hodgkin et al., 2005).
Sim-ply providing the obtained model results of a decision situation under uncertainty does
neither promote understanding nor supports judgmental performance of the users in an
effective way (Hammond et al., 1975; Brehmer, 1980; Hoffman et al., 1981). This is due to
the fact that the human brain is limited in processing large amounts of data (Silver, 1991a;
Zimmermann, 2000; Linkov et al., 2004; Kiker et al., 2005) which may lead to systematic
biases in the assessment of a decision situation (Sage, 1981; Hogarth, 1987; Parikh et al.,
2001; Bell et al., 2003). For example, people pay inconsistent attention to the criteria
(Gardiner and Edwards, 1975), neglect alternatives that do not reach a certain threshold
performance (Tversky, 1972) or unintentionally focus on aspects that draw their initial
at-tention (Kahneman and Knetsch, 1992). Furthermore, particularly for novice users, it is
challenging to understand the underlying methodology of a DSS and its reasoning for a
certain result (Spiegelhalter and Knill-Jones, 1984; Henrion and Druzdzel, 1991). This
unfamiliarity leads to mistrust, especially in situations where they experience an
expecta-tion failure or anomaly comparing the output of the system to their own logic or belief (Ye,
1995; Gregor and Benbasat, 1999).
The described interpretational challenges of a DSS’s model results can be partially
re-solved by explanations providing informative guidance with unbiased and relevant
mation (Silver, 1991a; Silver, 1991b). However, with respect to MCDA theory, this
infor-mation should not include a specific suggestion in favour of or against a certain
alterna-tive. The aim is furthermore to describe the model’s reasoning logic (Weiner, 1980;
7 well as to support visual model results with explanations on how to interpret them which
can be complemented by value tables or additional statistical analyses (Silver, 1991a).
Due to the increased transparency of the DSS, users are more likely to accept and trust
its application on decision situations and the obtained results from their simulations
(Swartout and Moore, 1993; Buchanan and Shortliffe, 1984; Greer et al., 1994; Dhaliwal
and Benbasat, 1996; Parikh et al., 2001). Explanations that provide the user with relevant
information and a meaningful interpretation of them reduce the cognitive effort of deriving
these independently what results in higher acceptance and decision efficiency by the user
(Hammond et al., 1975; Brehmer, 1980; Hoffman et al., 1981; Dhaliwal and Benbasat,
1996; Mao and Benbasat, 2000). In this way, the user can efficiently explore a decision
situation and gain a more detailed understanding, which leads to more accurate
judge-ment and increases the effectiveness of decision-making (Hayes and Reddy, 1983;
Gregor and Benbasat, 1999; Parikh et al., 2001; Tintarev and Masthoff, 2007). While
nov-ices use the explanations primarily to understand the obtained results, experts verify the
underlying assumptions and resolve anomalies of the involved stakeholders. Therefore,
explanatory DSSs have proven beneficial for fostering the understanding of both novices
and expert users (Buchanan and Shortliffe, 1984; Greef and Neerincx, 1995; Ye, 1995;
Gregor and Benbasat, 1999; Mao and Benbasat, 2000). However, it shall also be noted
that the understanding of explanations is not unambiguous (Kahneman et al., 1982) and
can also cause behavioural influences on the DMs’ judgement (Silver, 1991a).
2.3
Literature overview on MCDA DSSs with explanatory functions
Explanatory functions were originally developed for expert systems and in the field of
arti-ficial intelligence in order to improve human-computer interaction and communication
(Amgoud and Prade, 2006; Geldermann, 2010; Ouerdane et al., 2010). One possibility to
provide the explanations is by NLG techniques (Holtzman, 1988; Silver, 1991a; Reiter and
Dale, 1997). In the literature, we found three different approaches of how explanations are
generated in MCDA DSSs.
1. The systems of the first category use MAUT in order to tailor their generated
explana-tions to the user (cf. Greer et al., 1994; Walker et al., 2004; Carenini and Moore,
2006).
2. The DSSs introduced in Papamichail and French (2000), Papamichail and French
(2003), Bélanger and Martel (2005), Labreuche et al. (2011), Labreuche et al. (2012),
Greco et al. (2013), Sánchez-Hernández (2013) and Kadziński et al. (2014) provide
independent explanations of the model results. Both dependent and
8 1997). The DSSs either adapt predefined text components to the obtained model
re-sults or choose entirely different templates for different user groups.
3. The concept presented in Bailey et al. (2011) constitutes a third category because it
explains the results for a MCDA DSS by applying fuzzy logic (cf. Zadeh, 1965) to
de-termine the corresponding explanations.
The concept presented in Papamichail and French (2000) and Papamichail and French
(2003) differs from these systems in the output format of the explanations which is either a
comparative or a sensitivity report file generated by a NLG module. The explanations are
represented by five different types of messages which are structured according to the
at-tribute tree of the decision problem. As an example, reasoning explanations provide
ar-guments in favour or against an alternative. The NLG module fills predefined text
tem-plates with linguistic information which can either be quantitative data from the model or
qualitative semantic quantifiers which verbally express the quality of the analysed
parame-ters. The latter are chosen by the NLG module based on statistical calculations.
In addition to the benefits from explanations mentioned above, this report-generating
con-cept also increases the traceability of the decision process which can be followed easily
from the facilitated documentation. It is validated with various users from different
back-grounds (Papamichail and French, 2005) and successfully applied in a group decision
situation in Geldermann et al. (2009). However, the sensitivity analysis in this approach is
limited to the variation of only one weight parameter at a time.
Overall, the above descriptions show that many approaches exist for multi-dimensional
sensitivity analysis (without explanation systems) and for NLG based explanation systems
(limited to one-dimensional sensitivity analyses in MCDA). To our knowledge, however,
NLG approaches for explaining results of multi-dimensional sensitivity analysis have not
yet been proposed in the literature.
3
Explanatory concept for a preferential multi-dimensional
sensitivity analysis
For a formal description of the approach to multi-dimensional sensitivity analysis
imple-mented in SIMADA, please see Bertsch and Fichtner (2016). In order to facilitate the
us-ers’ understanding of the multi-dimensional preferential sensitivity analysis of the model
results, SIMADA is extended by a NLG approach to provide automatic explanations for
these. Based on the well investigated and validated approach by Papamichail and French
9 explanations as a report in HTML format based on predefined text templates. Our main
contribution is the extension of their approach to generate explanations for simultaneous
variations of different weights and value function parameters which allows a more detailed
assessment of the preferential uncertainties involved in the decision situation. Both user
groups (DMs and DAs) of SIMADA are addressees of this concept. While DAs can use it
to validate the model results with their own expectations, DMs benefit from the facilitated
interpretation and enhanced traceability of the decision. This is particularly relevant in the
light of an increasing demand from the media and the public for information and
justifica-tion from authorities on how decisions are taken (Wybo, 2006). However, the explanajustifica-tions
may still require support from an experienced DA due to the complexity of the report.
3.1 General approach to report generation
Similar to the approaches by Papamichail and French (2003) and Geldermann et al.
(2009), the generation of textual explanations of multi-dimensional sensitivity analysis in
our approach involves three stages: (i) content determination, (ii) discourse planning and
(iii) sentence generation. Please note that, given our focus on multi-dimensional sensitivity
analysis, our notion of content determination in this paper is slightly different from that by
Papamichail and French (2003). While Papamichail and French (2003) use this term
basi-cally to describe the choice between generating a comparative report vs. generating a
sensitivity report, we shall use the term for the step in which users determine which part(s)
of the multi-dimensional sensitivity analysis results they wish to generate explanations for.
The three stages are each described in further detail in the subsequent section 3.2.
3.2 Development process of the report structure, text messages and
templates
Klein (1994) and Reiter and Dale (1997) introduce the theoretical approach of developing
a NLG system. Successfully conducted in Papamichail and French (2003), a similar
proc-ess is followed in this paper. As mentioned above, the generation of textual explanations
follows a three-stage procedure. Several experts from the field of decision theory and
MCDA were closely involved on the different stages, i.e. from developing a report
struc-ture to formulating explanatory text templates, in order to critically discuss and reflect
sug-gestions and ensure coherence and understandability of the report as a whole. The
ex-perts originate from Germany, South Africa, Netherlands and Finland; their research fields
vary from operations research and statistics to decision theory with a particular focus on
MCDA. We now describe the three stages of report generation in more detail and how the
experts were involved in each of these. We also provide information on further thoughts,
10
3.2.1 Content determination
In a first step, all visualisations of multi-dimensional sensitivity analysis results provided by
SIMADA were collected. On this basis, we initially identified explanation needs which were
subsequently discussed and refined in four expert interviews. The refinement process also
included suggestions for adding new visualisations and corresponding explanations,
which were not yet provided by SIMADA but the experts perceived as important (e.g.,
in-formation on stochastic dominance of alternatives). As a result of the interviews, the
fol-lowing nine message types emerged, which can be grouped into four broad categories.
A. Overarching overview
1. Introduction and explanation what multi-dimensional sensitivity analysis is
2. Executive summary
B. Sensitivities of overall performance scores
3. Spread of results
4. Cumulative performance
C. Ranking performance
5. Cumulative performance by alternative
6. Detailed ranking performance
7. Stochastic dominance
D. Preference parameter exploration
8. Weight space exploration
9. Value function space exploration
The exact requirements for explanations in a decision situation will be context-specific to a
large extent. In the content determination stage, users are therefore given the opportunity
to choose which type of explanations they wish to generate. However, the overarching
messages of category A will always be provided. The messages in the other three
catego-ries provide information on the spread and distribution of the attained OPSs of the
alterna-tives (category B), their rank performances for all combinations of preference parameters
varied in the multi-dimensional sensitivity analysis (category C) and the preferential
sensi-tivities on the first ranking performance of a considered alternative, i.e. for which
parame-ters or parameter combinations will a certain alternative achieve the highest OPS
(cate-gory D). Additionally, a nomenclature defining the used scientific terminology is
automati-cally added as an appendix.
3.2.2 Discourse planning
Once users have decided in the content determination stage, which explanations they
11 plan) according to which the different text messages will be ordered to achieve a coherent
report. The development process of the discourse planning stage therefore involved an
initial proposal of a text plan for each type of explanation. Again, this proposal was
dis-cussed and refined in interviews with the same four experts as in the content
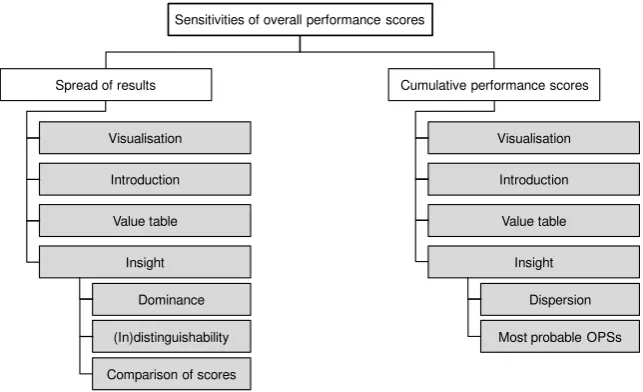
determina-tion stage. The following general structure emerged from the discussions: Each message
type of the multi-dimensional preferential sensitivity report (with few exceptions, see Table
1) will include (i) the visualisation itself, (ii) an explanatory introduction explaining how to
interpret it, (iii) a value table containing the analysed parameter values and (iv) information
providing insight, i.e. a list of implications which can be derived from the respective
analy-sis or visualisation. Figures 1-4 show the corresponding library of text plans for the
[image:12.595.86.409.298.462.2]multi-dimensional sensitivity analysis report.
Figure 1: Text plan for the overarching overview messages
Figure 2: Text plan for the sensitivities of overall performance scores messages
Overarching overview
Introduction Executive summary
Introduction to pref. uncertainties Underlying methodology
Purpose of report
Differentiating criteria Maximax alternative Best expected rank performance
Best rank performance Dominance relationships
Sensitivities of overall performance scores
Spread of results Cumulative performance scores
Visualisation Introduction Value table Insight
Visualisation Introduction Value table Insight Dominance
(In)distinguishability Comparison of scores
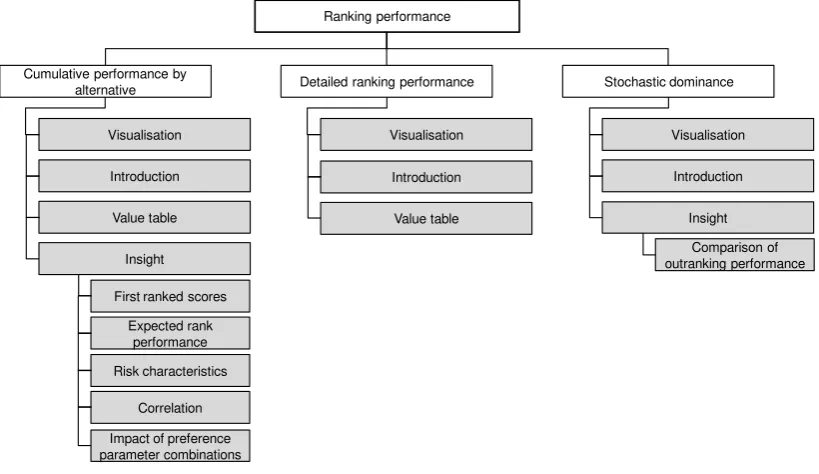
[image:12.595.90.412.521.717.2]12 Figure 3: Text plan for the ranking performance messages
Figure 4: Text plan for the preference parameter exploration messages
Each of the grey boxes in Figures 1-4 represents at least one message to be conveyed to the user. The choice of wording for the explanatory messages and the structure of the descriptions are based on a number of literature sources (cf. Mareschal and Brans 1988; Brans and Mareschal 1994; Hodgkin et al. 2005; Treitz, 2006; Basson and Petrie 2007; Bertsch, 2008; Bertsch and Fichtner 2016) as well as self-developed concepts. Their for-mulation followed various design principles concerning relevance, conciseness and un-derstanding (cf. Kass and Finin, 1988; Swartout and Moore, 1993; Nunes et al., 2012; Corrente et al., 2014). In terms of the input data required to generate each of the mes-sages, they can be categorised into three broad groups (see below). For each group an example of a corresponding template is provided below (in italics in this section).
Ranking performance
Cumulative performance by alternative
Visualisation Introduction Value table Insight
Detailed ranking performance
Introduction Value table Stochastic dominance Visualisation Introduction Insight
First ranked scores Expected rank performance Risk characteristics Comparison of outranking performance Correlation Impact of preference parameter combinations
Visualisation
Preference parameter exploration
Weight space exploration Value function space exploration
Visualisation Introduction Value table Insight Visualisation Introduction Value table Insight Influence weights
Dominance of relative importance
Influence value functions Detailed effects on
[image:13.595.73.393.378.557.2]13
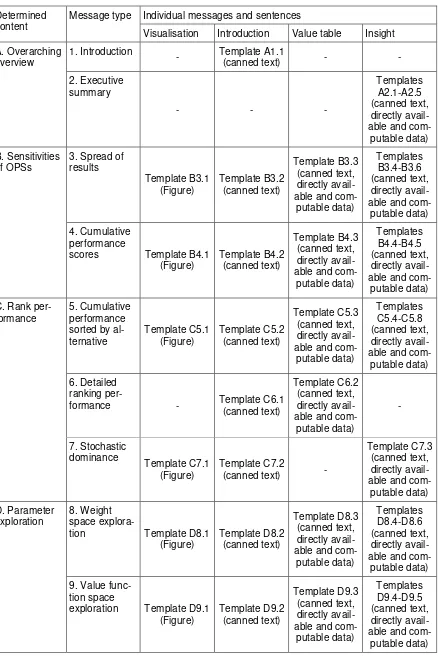
Messages of the first group require no input data. These messages only require un-changed or ‘canned’ text (see Papamichail and French, 2003). For instance, report ti-tles belong to this group, but also the messages related to the first message type in category A of the content determination (see section 3.2.1) are simply canned text messages. The introduction to the ‘spread of results’ visualisation is an example of this group of messages:
o The 'spread of results' graph shows the ranges of the overall performance
scores for all alternatives. The vertical lines with tick marks at their ends repre-sent the minimum and maximum results obtained from the simulation runs. The tick mark in their middle indicates the expected overall performance score (EOPS) for the respective alternative (e.g. the value represents the average overall performance score in case of symmetric distributions).
Please note: This visualisation does not show the distribution of the overall per-formance scores for the alternatives.
Messages of the second group require directly available data. Examples of directly available data include alternatives’ names or OPSs which are simply included in the sentences without any further transformation. An example of this group of messages is (where the words in <> brackets indicate slots in the templates which are to be filled by directly available data):
o The highest overall performance score is attained by <Alternative
a_MaxiMax>. It maximises the upside potential of realizing the highest possible overall performance score.
Messages of the third group require computable data. Messages of this kind are needed for almost all sentences related to the ‘insight’ boxes in Figures 1-4. The com-putable data is either included in the sentences in numerical form or in the form of a semantic quantifier, i.e. a verbal expression that may change depending on a numeri-cal indicator taking different values or value ranges. Computable data in numerinumeri-cal form may either be included in individual sentences or in table form. An example of this group of messages including computed data in the form of a semantic quantifier is given by (where the words in <> brackets indicate slots in the templates which are to be filled by either directly available or computable data):
o The overall performance scores of <alternative a_cons> are <semantic
quanti-fier> dispersed than those of <alternative(s) a_i>.
14 Table 1: Structure of the library of templates
Determined content
Message type Individual messages and sentences
Visualisation Introduction Value table Insight
A. Overarching overview
1. Introduction
- Template A1.1
(canned text) - -
2. Executive summary - - - Templates A2.1-A2.5 (canned text, directly avail-able and
com-putable data) B. Sensitivities
of OPSs
3. Spread of results Template B3.1 (Figure) Template B3.2 (canned text) Template B3.3 (canned text, directly avail-able and
com-putable data)
Templates B3.4-B3.6 (canned text, directly avail-able and
com-putable data) 4. Cumulative
performance
scores Template B4.1
(Figure) Template B4.2 (canned text) Template B4.3 (canned text, directly avail-able and
com-putable data)
Templates B4.4-B4.5 (canned text, directly avail-able and
com-putable data) C. Rank
per-formance
5. Cumulative performance sorted by al-ternative Template C5.1 (Figure) Template C5.2 (canned text) Template C5.3 (canned text, directly avail-able and
com-putable data)
Templates C5.4-C5.8 (canned text, directly avail-able and
com-putable data) 6. Detailed
ranking
per-formance - Template C6.1
(canned text)
Template C6.2 (canned text, directly avail-able and
com-putable data) - 7. Stochastic dominance Template C7.1 (Figure) Template C7.2
(canned text) -
Template C7.3 (canned text, directly avail-able and
com-putable data) D. Parameter
exploration
8. Weight space
explora-tion Template D8.1
(Figure) Template D8.2 (canned text) Template D8.3 (canned text, directly avail-able and
com-putable data)
Templates D8.4-D8.6 (canned text, directly avail-able and
com-putable data) 9. Value
func-tion space
exploration Template D9.1
(Figure) Template D9.2 (canned text) Template D9.3 (canned text, directly avail-able and
com-putable data)
Templates D9.4-D9.5 (canned text, directly avail-able and
15 After refining and formulating all templates on the basis of the discussions in the four
ex-pert interviews, the resulting text templates were sent to four additional exex-perts who
pro-vided written feedback which we incorporated in an additional iteration. Overall, all experts
provided various ideas for reducing the complexity of the explanations (e.g., regarding
sentence length and use of language), increasing user understanding by adding additional
textual and visual information and suggesting new concepts (e.g., stochastic dominance).
3.2.3 Sentence generation
Once the users have chosen for which results they wish to generate explanations in the
content determination stage and the overall structure of the text is determined by the
cor-responding text plan from the library of text plans in the discourse planning stage, the
main task of the sentence generation stage is to fill the placeholder slots of the templates
with numerical values or strings.
In a final stage, all generated messages are assembled in a HTML file. To ensure a
co-herent layout, a Cascading Style Sheet (CSS) produced in the discourse planning stage
defines various style specifications for headlines, tables and paragraphs.
In the following subsections, details of the sentence generation stage are described for a
selection of messages and templates. While the descriptions below generally cover all
three groups of messages mentioned in section 3.2.2, we put special emphasis on
mes-sages requiring computable data. For each described message, we also provide the
cor-responding text template(s) (again in italics).
3.2.3.1 Overarching overview: Introduction
The overarching introduction into the report is mostly based on a ‘canned text’ template,
where only very little adaptations are made. Even though scientific terminology is reduced
to a minimum in the report, model-specific terms like ‘overall performance score’ or ‘sim
u-lation run’ cannot be completely avoided. In terms of layout, these terms are generally underlined in the templates indicating that they are linked to the nomenclature which is
also represented as a predefined template in the NLG module to provide easily
under-standable definitions of such terms to users. They are also represented as tooltips in the
report which appear when the cursor is moved over the respective link in the document.
This analysis examines the robustness of the simulation results of a decision situation with
respect to the influences of preferential uncertainties. The decision situation is modelled
16 include intra-criteria preferential uncertainties (regarding the criteria level ranges of the
alternatives) as well as inter-criteria preferential uncertainties (regarding the relative
im-portance of the criteria). The intra-criteria preferential uncertainties are modelled by the
variation of the value function shapes (curvature variations) while the inter-criteria
prefer-ential uncertainties are represented by weight variations.
The aim of this analysis is to identify the most relevant preferential uncertainties in order
to explore their respective impact on the results and to examine how the alternatives are
distinguishable from each other in the light of these uncertainties. Therefore, this report
presents the results of the analysis of <amount>simulation runs of the decision situa-tion for which <amount> different alternatives are considered. In each of the simulation runs, the uncertain parameter samples are varied randomly with respect to the assigned
interval boundaries.
3.2.3.2 Sensitivities of overall performance scores: Explaining the ‘spread of results’ visualisation
The explanation of the spread of results includes the following information:
Visualisation
Introduction
Value table
Insight: Dominance, (In)distinguishability, Comparison of scores
Examples of the visualisation, introduction and value table are provided in section 5 as
well as the appendix. Here, we focus on the sentence generation for the insight-related
messages.
Dominance
As part of this explanation, strict dominance relationships between two alternatives are
explored and reported. It occurs if all OPSs of an alternative are strictly better than
those of alternative ( ) in every simulation run. Therefore, the system verifies
condition (1) for all alternatives if the alternative strictly dominates another alternative
and fills the template below accordingly (it is not filled if the condition (3.4) is not met for
an alternative):
<Alternative > dominates alternative(s) <Alternative > for all preference parameter
combinations within the considered intervals.
17 (In)distinguishability
On the other hand, if the OPS ranges of the alternatives overlap, they are considered
in-distinguishable with regard to their performances. This is expressed in equation (2)(2).
The overall performance scores of <Alternative > are indistinguishable from the
overall performance scores of alternative(s) <Alternative >.
(2)
Comparison of scores
In decision theory under uncertainty, several concepts have been developed to identify
the preferred alternative(s) in the presence of uncertainty (cf. Neumann, 1928). Making
use of these, the NLG module identifies the MaxiMax, MiniMin and MaxiMin alternatives
amongst all respectively, where is the set of all alternatives, and
is the total number of alternatives of the simulation. This is done by comparing the
alterna-tives’ OPSs obtained in the simulation runs , where is the set of all simulation runs,
and is the total number of simulation runs, to the MaxiMax, MiniMin and MaxiMin OPSs of the simulation as defined in the conditions (3), (4) and (5). This
informa-tion is then used to fill the text templates below.
(3)
(4)
(5)
The highest overall performance score is attained by < >. It
maximises the upside potential of realizing the highest possible overall performance
score.
The lowest overall performance score is attained by < > (<value>).
Alternative <Alternative > attains the highest minimum of all alternatives
(<value>). This alternative maximises the minimal overall performance scores of all
al-ternatives.
3.2.3.3 Sensitivities of overall performance scores: Explaining the ‘cumulative performance’ visualisation
The explanation of the cumulative performance includes the following information:
18
Introduction
Value table
Insight: Dispersion, Most probable OPSs
As in the previous section, we focus on the sentence generation for the insight-related
messages here and refer to the appendix for further information related to the other
mes-sages.
Dispersion
The dispersion message uses semantic quantifiers for the verbal description of certain
observations of the visualisations in the text templates. Motivated by Papamichail and
French (2000), they are based on statistical calculations of certain model parameters. As
an example, the predefined text template describing the dispersion of the OPSs of the
considered alternative in pairwise comparison to the dispersion of the other
alterna-tives’ OPSs is shown below. These explanations complement the cumulative performance
visualisation which shows distributional information for the alternatives’ OPSs. The text
templates are filled with a semantic quantifier to describe the degree of difference in
dis-persion between them. It is determined in the following way, where to calculate a
95 % confidence interval for the considered alternative’s standard deviation :
The overall performance scores of <Alternative > are <semantic quantifier>
dis-persed than those of <Alternative(s) >.
(6)
(7)
(8)
(9)
(10)
Most probable OPSs
This section of the report analyses the inter-quantile range of the 5 % and 95 % quantile
of the considered alternative’s OPSs. The boundaries of the inter-quantile range are stated and compared and compared to the quantiles and/or EOPSs of the other
alterna-tives. This can be seen as a weaker relationship than the strict dominance of alternatives
and accounts for the fact that values outside of this inter-quantile range (5-95%) can
po-tentially represent outliers.
The 90 % most probable overall performance scores of Alternative <Alternative name>
19
<All/The highest 95 %> overall performance scores of Alternative <Alternative name>
dominates <the 95 % highest/all> overall performance scores of Alternative
<Alterna-tive name>.
The expected overall performance score of Alternative <Alternative name> dominates
<the 95 % highest/all> overall performance scores of Alternative <Alternative name>.
3.2.3.4 Ranking performance: Explaining the ‘cumulative performance sorted by
alternative’ visualisation
The explanation of the cumulative performance sorted by alternative includes the following
information:
Visualisation
Introduction
Value table
Insight: First ranked scores, Expected rank performance, Risk characteristics,
Correla-tion, Impact of preference parameter combinations
In contrast to the above sections, we focus on the sentence generation for the value table
and the insight-related messages here and refer to the appendix for further information
related to the other messages.
Value table
This value table provides information on the percentage of simulation runs in which they
achieve a certain rank within a simulation for each alternative. The system calculates a
ranking matrix as shown in equation (11) where an entry is defined by the rank of
al-ternative in the simulation run . Afterwards, the number of equal entries in
every line is divided by the number of simulation runs. This indicates the relative
percent-age of simulation runs that the alternatives achieved the respective rank. These numbers
also represent the entries for the value table of the cumulative performance sorted by
al-ternative visualisation.
.
(11)
(12)
In addition to the table itself, a list of further aspects is provided based on the information
20
The <highest/lowest> percentage of <No. 1/last> ranks is attained by Alternative
<Al-ternative name>.
Alternative <Alternative name> does never <become the preferred alternative/attain
the last rank>.
The overall performance scores that <Alternative > attains in the simulation runs
where it ranks first range from <value> to <value>.
Especially the last aspect provides detailed information on the maximal value that the
considered alternative can attain in simulation runs where it becomes the preferred one.
First ranked scores
This paragraph analyses the results the considered alternative obtains in the simulation
runs where it ranks first. It indicates the range of obtained overall performance scores and
calculates the expected overall performance scores for these. Lastly, the first-ranking
per-formances of the considered alternative are compared to the first-ranking perper-formances of
all alternatives. This lets the DM or DA interpret if the considered alternative attains high
or low performance scores when it becomes the preferred alternative in the simulation.
The overall performance scores that Alternative <Alternative name> attains in the
simulation runs where it ranks first range from <value> to <value>.
The expected overall performance score of the simulation runs where Alternative
<Al-ternative name> becomes the preferred al<Al-ternative accumulates to <value>.
This value is <value> % <higher/lower> compared to the expected overall
perform-ance score of all first ranking overall performperform-ance scores. This means, that in the
simulation runs in which Alternative <Alternative name> ranks best, it also attains
<high/low> overall performance scores.
Expected rank performance
Based on equation (13) the system outputs the best, worst and in case the considered
alternative is not one of these, also the expected rank of this alternative in text form.
(13)
Alternative <Alternative name> does attain the <best/worst> expected rank of
<ex-pected rank> out of <number of alternatives> alternatives.
Alternative <Alternative name> attains an expected rank of <value> out of <number of
alternatives> alternatives.
Risk characteristics
In order to provide insights into the risk of choosing a low performing alternative, the
re-port calculates the regret (i.e. opre-portunity loss) for every alternative by equation (14). This
first-21 ranking alternative of every simulation run (cf. Loomes and Sugden, 1982; Bell, 1982).
The minimal regret value identifies the MiniMax regret alternative. A potential decision for
this alternative minimises the risk of obtaining low performance results.
(14) Alternative <Alternative name> does achieve the highest expected overall
perform-ance score. This alternative minimises the downside risk of obtaining a low overall
per-formance score with regard to the best alternative of every single simulation run. It can
be expected that this alternative does attain an overall performance score that is
<value> <higher/lower> than the best overall performance score of a simulation run.
Correlation
In order to describe the linear correlation between the alternatives, Pearson’s correlation
coefficient is calculated with the alternatives’ OPSs (for a discussion on correlation coeff i-cients cf. Hauke and Kossowski, 2011; Bishara and Hittner, 2012; Pagano, 2013). Since
for a high number of data samples already small effects can cause significant influences
regarding the correlation of two alternatives, the effect of correlation is of particular
inter-est (Ellis, 2013). This degree is expressed in the following text template by the semantic
quantifiers ‘very small’, ‘small’, ‘medium’ and ‘large’ according to the effect size classific
a-tion of correlaa-tion in Cohen (1988) and Ellis (2010). However, only if the correlaa-tion can be
considered significant, the template is generated for the report. This is verified by
calculat-ing the p-value of the correlation with the t-statistic (Gosset, 1908) and a significance level
of .
<Alternative > correlates <positively/negatively> with <Alternative > to a
<se-mantic quantifier> extent. This correlation is significant (p = < >).
, ,
(15)
(16)
(17)
(18)
Impact of preference parameter combinations
In this section of the report, the influence of separate considerations of inter- and
intra-criteria preferential uncertainties is compared. It is done by running the same simulation
though considering different combinations of these uncertainty types. The first-ranking
22 for the considered alternative in the report to determine how sensitive it is with regard to
the different uncertainty type combinations.
The overall performance score of Alternative <Alternative name> is most sensitive to
<un-certainty type>.
With inter- as well as intra-criteria preferential uncertainties taken into account
Alterna-tive <AlternaAlterna-tive name> attains rank 1 in <value> % of the cases.
Considering only inter-criteria preferential uncertainties for this alternative, it ranks first
in <value> % of the simulation runs.
When only the intra-criteria preferential uncertainties are modelled, Alternative
<Alter-native name> achieves the first rank in <value> % of the simulation runs.
3.2.3.5 Ranking performance: Explaining ‘stochastic dominance’ relations
The explanation of stochastic dominance includes the following information:
Visualisation
Introduction
Insight: Comparison of outranking performance
As in most previous sections, we focus on the sentence generation for the insight-related
messages here and refer to the appendix for further information related to the other
mes-sages.
Comparison of outranking performance
In contrast to the strict dominance relationship which considers the OPSs obtained by the
compared alternatives as a whole set, stochastic dominance (see Levy, 1992; Graves and
Ringuest, 2009; Eisenführ et al., 2010; Scholten et al., 2014) is defined in this paper as
the percentage of simulation runs in which one alternative achieves an equal or higher
OPS than a compared alternative (equation (19)). The following text output is generated
for each pairwise comparison of the considered alternative of the report with all of
the other alternatives .
<Considered alternative ID> dominates <alternative ID> in < > % of
the simulation runs.
23
3.2.3.6 Preference parameter exploration: Explaining the weight space
exploration visualisation
The explanation of the weight space exploration includes the following messages:
Visualisation
Introduction
Value table
Insight: Influence weights, Dominance of relative importance, (In)distinguishability of
relative importance
As above, we focus on the sentence generation for the insight-related messages here and
refer to the appendix for further information related to the other messages.
Influence weights
The weight space exploration visualisation compares the total weight space (containing
the weights ) for each individual criterion with the so-called limited weight space.
This subset of the total weight space contains the weights which are applied in the
simulation runs where the respective alternative obtains the first rank. We now compare
the deviation of weight range (i.e. difference between the maximum and minimum
weights) of the total and limited weight space for every criterion individually. If this value
differs by at most 10 % from the maximum (minimum) of the deviations of all criteria range
deviations, the respective criterion has a high (low) influence on the first-ranking
perform-ance of the analysed alternative. In this case, the condition (20a) (or (20b)) is fulfilled.
(20a)
(20b)
The following criterion is most sensitive for the ranking of Alternative <Alternative
name> as preferred alternative: <list of criteria>.
The relative importance of criteria <list of criteria> slightly affect the ranking of
Alterna-tive <AlternaAlterna-tive name> as preferred alternaAlterna-tive.
Dominance of relative importance
Similar to the dominance relationship defined in equation (1) we also analyse potential
dominance relationships between the relative importance of the criteria. However, we use
each criterion’s upper and lower boundaries of the total and limited weight space instead
of the OPSs as input for equation (1). The following text is generated in case the
domi-nance relationship occurs already with the application of the total weight space, i.e. in all
24 case where there occurs a dominance relationship only when the simulation runs in which
the alternative ranks first are considered (i.e. the limited weight space is applied).
Criterion <Criterion name> is more important than criterion <Criterion name> in all
simulation runs.
Only in the simulation runs where Alternative <Alternative name> ranks first, criterion
<Criterion name> is more important than criterion <Criterion name>.
4
Evaluation of the approach
After the implementation of the natural language generator on the basis of the concept presented in section 3, we have evaluated our approach with both expert users and nov-ice users.
4.1
Expert users
Five experts, that were part of the feedback rounds referred to in section 3, were
con-tacted again to provide additional comments on the concept after its implementation. The
aim of this interview loop was twofold. First, we intended to gather assessments by
ex-perts of the added value provided by the implemented approach. Second, we sought
feedback for final adjustments on the content of the explanations, especially focussing on
the more detailed results that were available and explained in the report as a result of the
implemented natural language generator. In relation to the first aim, the overall attitude
expressed by the experts was very positive in general.
4.2
Novice user validation
In order to validate the usefulness of our NLG approach to explain a multi-dimensional
preferential sensitivity analysis to novice users, an online survey was conducted. The
sur-vey was completed by a total of 268 participants. The comparison of the collected
socio-demographic data of our sample with the average values of the German population
par-ticularly shows the following deviations. The share of participants aged between 18 and
30 years and with a high educational background is overrepresented as compared to the
German population (according to the German Federal Statistical Office). Also the share of
male participants (75%) is higher than the average of 49% of the German population.
The survey tested user understanding on the basis of the ‘spread of results’ visualisation
for a hypothetical decision situation in a between subject design. After a brief introduction
to MCDA and preferential uncertainty modelling in SIMADA, the participants had to
25 sample group was provided with the explanations generated by the NLG approach
pre-sented in this paper in addition to the visualisation, the other half had to answer the
ques-tions without these explanaques-tions (i.e. only on the basis of the visualisation). The tasks
dif-fered in difficulty as they required different levels of interpretational capabilities. While
some questions asked the participants to identify the value of an alternative’s OPS (e.g.
‘What is the maximum overall performance score of Alternative 2?’), another type of que s-tion requested them to compare the alternatives (e.g. ‘What is the minimal overall
per-formance score of all alternatives?’). With regard to the taxonomy of educational
objec-tives by Bloom et al. (1984), these two question types verify if the participants understand
the visualisation in terms of what it shows and if they can apply this knowledge when they
are confronted with slightly more difficult comparison tasks. The two sample groups did
not show a significant difference of understanding (proxied by the number of correct and
wrong answers). Both sample groups answered over 80 % of the questions correctly. For
these basic tasks, we can therefore conclude that the understanding of the participants
did not depend on the provision of explanations.
A further question, however, also tested deeper analysis and interpretational capabilities
of the participants. They were asked about distributional information on the alternatives’
OPSs (‘Are high overall performance scores more probable for Alternative 3 than low
overall performance scores?’). In theory, this question was not more difficult to answer than the questions before for the sample group that was provided with explanations. They
were provided with the explanation to answer this question correctly. The other user
group, however, had to use their own interpretational capabilities to answer it. Almost
twice as many participants of the former sample group (30 %) answered this question
correctly as opposed to 17 % of the participants that were not provided with explanations.
Pearson’s Chi-squared test (Pearson, 1900) as well as Fisher’s Exact test (Fisher, 1922) indicate a significant difference between the samples (p=0.03 and p=0.02 respectively).
We thus conclude that the NLG approach is particularly useful for complex interpretational
tasks (for the example of the spread of result visualisation) by reducing the user’s
cogni-tive effort to achieve understanding. However, the result also shows that a considerable
number of participants who were provided with explanations did not read them carefully
enough to retrieve the correct answer.
5
Demonstration of the natural language generation approach for a
case study
We now apply our NLG approach to the MCDA case study presented in Bertsch and
26 decision alternatives in the context of the German energy transition. Each alternative
in-cludes a combination of different feed-in regimes for renewable electricity generation (i.e.
curtailment options) and electricity transmission grid expansion possibilities (i.e. capacity
reinforcement measures of existing lines or construction of new lines). The decision to be
supported is therefore owned by the regulator and policy makers. The five considered
alternatives are:
A1: Economic RES injection management and economic grid expansion
A2: Economic RES injection management and fixed, maximal grid expansion
A3: Fixed, maximal RES injection and fixed, maximal grid expansion
A4: RES injection fixed to 90% of max. and economic grid expansion
A5: RES injection fixed to 90% of max. and fixed, maximal grid expansion
These five alternatives are evaluated with respect to the three traditional dimensions of
energy policy (economic competitiveness, environmental sustainability, security of
sup-ply), which Bertsch and Fichtner (2016) augmented by public acceptance as a fourth key
[image:27.595.73.419.398.564.2]dimension. Figure 5 shows the corresponding attribute tree for their case study.
Figure 5: Attribute tree for the case study (Bertsch and Fichtner, 2016)
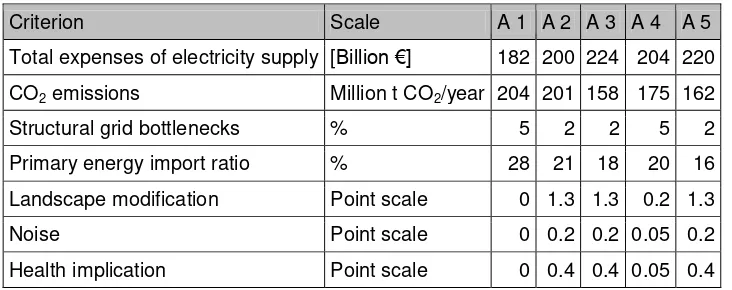
Table 2 shows the performance of the five alternatives with respect to the attributes of the attribute tree. For the top level criteria of the attribute tree, the following weight intervals are assumed for the multi-dimensional sensitivity analysis (Bertsch and Fichtner, 2016): Economic competitiveness (0.10-0.30), Environmental sustainability (0.15-0.55), Security of Supply (0.20-0.60), Public acceptance (0.05-0.25). While our NLG approach does
pro-vide textual explanations for varying the value functions’ shapes, we focus on the text
messages explaining the results of a multi-dimensional weight sensitivity analysis in this paper. The value functions are therefore assumed to be linear in the context of the case study. For all further details related to the case study in general as well as specific model-ling assumptions, please see Bertsch and Fichtner (2016).
Economic competitiveness
Environmental sustainability
Security of supply
Public acceptance
Total expenses of electricity supply
CO2emissions
Structural grid bottlenecks
Primary energy import ratio
Landscape modification
A1
A2
A3 Overall goal
A4
A5
Noise
27 Table 2: Decision table for the case study (Bertsch and Fichtner, 2016)
Criterion Scale A 1 A 2 A 3 A 4 A 5
Total expenses of electricity supply [Billion €] 182 200 224 204 220
CO2 emissions Million t CO2/year 204 201 158 175 162
Structural grid bottlenecks % 5 2 2 5 2
Primary energy import ratio % 28 21 18 20 16
Landscape modification Point scale 0 1.3 1.3 0.2 1.3
Noise Point scale 0 0.2 0.2 0.05 0.2
Health implication Point scale 0 0.4 0.4 0.05 0.4
While the original version of SIMADA used in Bertsch and Fichtner (2016) also supported
multi-dimensional sensitivity analysis, the main difference is the following: The original
version enabled the generation of mainly three visualisations. The version including the
NLG approach presented in this paper enables, in addition to these visualisations, the
automatic generation of a comprehensive natural language report explaining the impact of
simultaneous variations of preference parameters on the MCDA results. As mentioned
above, users have the opportunity to actively choose which type of explanations they wish
to generate. However, the executive summary listing the key findings of the analysis is
always provided in the beginning of each report. Such an executive summary is shown in
the box below for the data and parameters of the case study. A full version, i.e. for users
that chose to generate ‘all’ available explanations for simultaneous weight variations
within the above mentioned intervals, of the multi-dimensional sensitivity report (including
visualisations and textual explanations) is presented in Appendix A.
Executive summary
Overall, the following key aspects are characteristic for this decision situation and the executed simulation runs:
The criterion CO2 Emissions has the highest differentiating influence between all
crite-ria of the decision problem.
On the contrary, criterion Primary energy import ratio has the lowest differentiating influence between all criteria of the decision problem.
The highest expected overall performance score is attained by Alternative 5 (0.316).
Alternative 5 does attain the best expected rank of 1.26 out of the 5 alternatives con-sidered in this decision situation.
Alternative 5 attains most often the first rank in the executed simulation runs. In 76.2 % of the simulation runs it becomes the preferred alternative.
28
6
Discussion and limitations of the natural language generation
approach
In the case study, Alternative 5 can be considered as a recommendable choice since it
achieves the highest EOPS of all alternatives. Additionally, it attains the first or second
rank in 98 % of the simulation runs while it stochastically dominates Alternative 1 in
79.5 % of the simulation runs and all other alternatives in at least 97.3 %. As this
alterna-tive also minimises the downside risk of achieving low OPSs, it is also the preferred
alter-native for a risk-averse DM. If the goal of the DMs is to maximise the upside potential,
Alternative 3 might become more preferable as it achieves the maximum OPS(s) in the
decision situation. However, this represents a rather risky choice because it is
stochasti-cally dominated by Alternative 5 in 97,3 % of the simulation runs.
Overall, we received positive feedback from the interviewed experts that were involved in
the development process of the explanations. They appreciated the usefulness of the
im-plications for a detailed preferential sensitivity analysis. Besides, we could also show its
benefits for novice users for complex interpretational tasks of the spread of results
visuali-sation. Critically reflecting our approach, we still lack more detailed knowledge about the
explanatory preferences of novice users though. This includes on the one hand their
benefits regarding other visualisations of the multi-dimensional sensitivity analysis. On the
other hand, a more general assessment on how novice users perceive and accept the
explanations could further improve this concept in future.
Our survey results show that the explanations for the spread of results visualisation only
reduce the complexity of cognitively demanding interpretational tasks. This needs to be
further verified with a more representative sample of participants, as young people with
high educational backgrounds were overrepresented in our evaluation study. Apart from
this, we consider the spread of results visualisation as the cognitively easiest to
under-stand within the preferential sensitivity report. We assume that due to the higher
complity of the other visualisations, such as the cumulative performance visualisation, we
ex-pect that our explanatory concept would show a considerably higher impact on their
inter-pretation by novice users. We need to furth