(Received August 11, 2010; Accepted October 6, 2010; Published November 25, 2010)
Keywords: mechanical alloying, spark plasma sintering, wear behaviors
1. Introduction
Ductile copper is widely used in industrial products, however, the lower hardness, tensile strength and poor wear resistance limits its applications. Generally, there are two ways to improve the mechanical properties and wear resistance of copper, by an age hardening mechanism or by incorporation of a hard second phase. Many investigations have been carried out to prepared second hard phase reinforced copper matrix composites.1–6) Mechanical
alloy-ing (MA) and spark plasma sinteralloy-ing (SPS) method was reported which can improve the wettability between the immiscible system,7,8) so these methods were employed to
prepare TiC dispersion strengthened copper composites by different milling technological process, and the microstruc-ture evolvement and the wear behavior the composites were discussed in this paper.
2. Experimental
Horizontal planetary ball mill was employed to the mechanical alloying with 10 mm diameter milling balls. The copper, titanium and graphite (purity 99.9%) are selected as starting element powders. The titanium and graphite powders with 4 : 1 weight ratio (atomic ratio of 1 : 1) were milled 10 h with 500 rpm speed and40 : 1ball to weight ratio, and then, copper powders were added to the milled titanium-carbon powders to from copper-titanium-carbon powders with 70 mass% copper by 1 h milling with 100 rpm speed, and the powders were recorded as powders A. The titanium, graphite and copper powders were mixed with weight ratio of 24 : 6 : 70 and milled 100 h with 500 rpm speed and40 : 1ball to weight ratio as powders B. The powders A and B were sintered to prepare titanium carbide reinforcement copper matrix composites by spark plasma sintering (SPS) method. The powders were sintered at 800C, 900C and 1000C for 3 min with 60C/min heating rate and 30 MPa pressure. The dry sliding wear tests were conducted in air at room temperature with a
pin-on-disc wear testing machine (MG2000, China), and GCr15 steel disc with a hardness of about 55 to 58 HRC was employed as counterpart. The applied loads were 20, 60, 100, 140 and 200N, and the sliding speed was 0.63 m/s. The specific wear rates and friction efficient were calculated by the following equation:
Ws¼ m
LFN
103 ð1Þ
WhereWs is the specific wear rate (mm3/Nm),mis the mass loss of test samples during wear test (g),is the density of test materials (g/cm3),Lis total sliding distance (m) and
FNis the normal load on the pin (N).
¼F=P¼M=Pr ð2Þ
Where is friction coefficient, M is measured friction torque (Nm) and r is the radius of the corresponding disk (m).
3. Results and Discussion
3.1 Influence of mechanical alloying process on the phase composition of milled powders and compo-sites
with atomically clean surfaces and with minimized diffusion distance which can reduce the activation energy of diffusion and reaction significantly during the MA process.
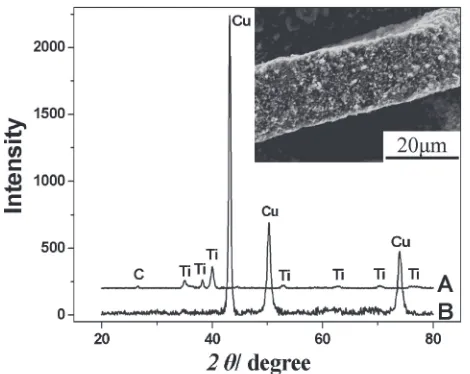
The diffraction peaks in the curve B become boarder and weaker too, moreover, the copper diffraction peaks move to lower angle after 100 h milling which due to the original titanium dissolved into the copper matrix, furthermore, Liu. X. R11) considered that the carbon may solid solution in copper at atomic level during milling. However, it is obvious that most of carbon atoms are located in graphite regions, namely, segregated in the interfaces and dislocations to form sub-solid solution. Furthermore it can be seen from the SEM micrograph of the powders B insert in the Fig. 1 that some of fine powder particles agglomerated, which due to the powders fragmentized and occurred cold welding. Therefore, the stored energy due to the increase of the dislocation and fresh interface ascribed to the fracture of the particles enhance the reactivity of the reactant constituents, and this effect plays an important role in TiþC!TiC synthesis reaction during sintering.
Figure 2 shows the X-ray diffraction pattern of the composites A and B with different sintering temperature. It can be seen copper, titanium carbide and carbon diffraction peaks in the XRD pattern of the composites A. However, it can be seen copper, titanium carbide, carbon and Cu3Ti2 which isn’t observed in the composites A. In addition, the diffraction peak of copper matrix of the composites A and B insert in the Fig. 2(a) and (b) respectively, the copper peak (111) of both the composites A and B shift to lower diffraction angle at lower sintering temperature, and then the peak move to higher angle which approach to diffraction peak of pure copper following rising of sintering temperature. For the composites A, it’s due to titanium atoms dissolved into copper matrix by electric field diffusion effect as a result of DC pulse current, and then the titanium as solid solute in copper matrix formed titanium carbide with residual carbon completely as the rising of sintering temperature, which lead to movement to higher angle of copper matrix peak. However, for the composites B, it’s due to the titanium atoms dissolve into copper matrix in the milling process, and then
the titanium as solid solute in copper matrix precipitated and formed titanium carbide with carbon atoms continuously as rising of sintering temperature. Moreover, the intensity of copper matrix peaks of the composites A decrease constantly during rising of sintering temperature, but the peak become broader. The calculation results of the grain size of the composites A show that copper grain size of the composites A decreases as rising of the sintering temperature, because that copper particulates melted as increasing sintering temperature and mixed with titanium carbide particles, and then molten copper rapidly solidified to from nanocrystaline. Instead, the intensity of the peak of the composites B increases following rising of sintering temperature, which due to the fine copper particles which were formed during milling growth up during sintering process.
3.2 Influence of mechanical alloying technological proc-ess on the microstructure of composites
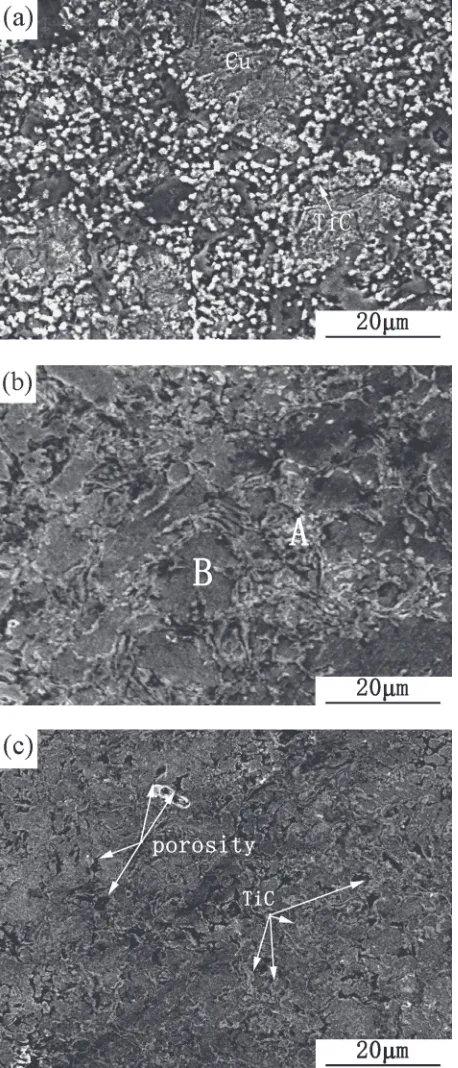
Figure 3 shows SEM images of the composites A sintered with different temperature. It can be seen from Fig. 3(a) that Fig. 1 X-Ray diffraction result of 10 h milled titanium-carbon powders and
100 h milled copper-titanium-carbon powders and its SEM image.
(a)
(b)
[image:2.595.310.542.70.480.2] [image:2.595.52.287.71.258.2]copper are surrounded by fine titanium carbide particles which can be confirmed by X-ray and EDS analysis results when the composites A were sintered with 800C, which generated from milled titanium-carbon powders adsorbed to copper particles in the mixed process, and formed fine titanium carbide at the lower sintering temperature. Figure 3(b) displays the microstructure of the samples sintered at 900C that the microstructure is composed of smooth area (such as point B) and coarse area (such as point A) around the smooth area. It can been observed from EDS analyses results that point A contains copper, titanium and
EDS analysis results show that component of the edge of agglomerated particles profiles is copper, which due to copper melted and permeated into porosity between particles. As rising of sintering temperature to 900C, more and more molten copper caused contour line of agglomerated particles to broaden obviously such as image Fig. 4(b). As the sintering temperature rising, more and more copper melted and formed the homogeneous conformation such as Fig. 4(c) shows.
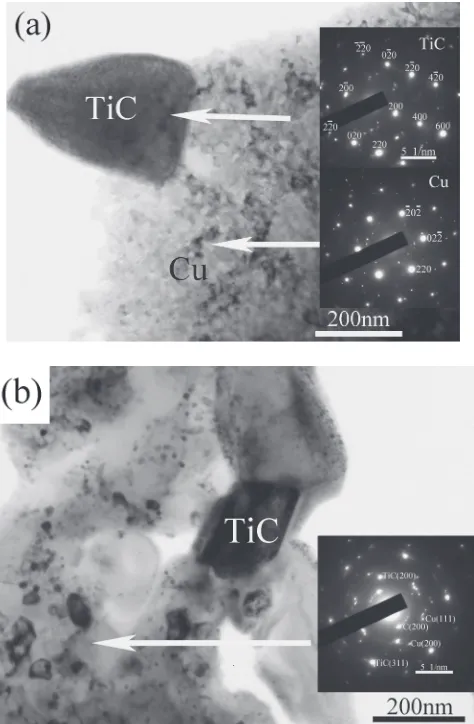
Akhtar F6)and D. Majcherczak12) studied ceramic metal interface of metal matrix composites which is a very important factor influencing the structure and properties of the composite. The TEM micrographs of composites A and B sintered at 900C in Fig. 5 shown the different interface between the copper matrix and TiC in the composites A and B. For the composites A, the diffraction pattern inserted in Fig. 5(a) exhibits that the dark particle as an arrow was titanium carbide with size about 300 nm, moreover, the copper matrix shows a stress concentration region. However, Fig. 5(b) shows two types of titanium carbide microscopic geometry: larger particle which occurs between the copper matrix and ultrafine particles which distributed homogene-ously throughout the copper matrix. The diffraction pattern insert in Fig. 5(b) indicates that the fine titanium carbide particles and copper matrix formed polycrystal. During the milling process, a part of titanium atoms dissolved into copper matrix, and then during sintering process, the titanium atoms joined together with carbon atoms formed the larger titanium carbide particles, others titanium atoms which dissolved into copper matrix formed fine titanium carbide particles in polycrystalline region as mentioned above.
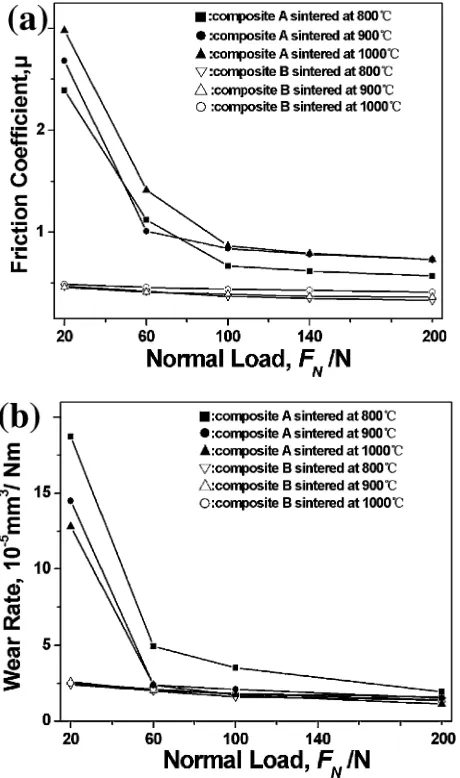
3.3 Influence of mechanical alloying process on the average friction coefficients and specific wear rates Figure 6 shows the variation of specific wear rates and average fraction coefficients with different normal loads of composites A and B that were sintered with different temperatures. The average friction coefficients of the composites A increase gradually with rising of sintering temperature. As mentioned above, the decrease of content of the residual carbon which formed TiC with titanium such as Fig. 1 reduce the self-lubricating effect as rising of sintering temperature, which lead to increase of average friction coefficients. Instead the composites A sintered at 800C Fig. 3 SEM images of the composites A with different sintering
[image:3.595.56.285.73.607.2]exhibit higher specific wear rates than the composites sintered at 900C and 1000C such as Fig. 6(b). However, the sintering temperature has not acted on specific wear rates and average fraction coefficients of the composites B.
Furthermore, it can be known from the Fig. 6 that the average friction coefficients and specific wear rates of the composites A show similar trend that decrease steeply as normal load increase from 20N to 60N (average friction coefficient from maximal 2.98 to 0.97, specific wear rates from maximal 18:75105mm3/Nm to2:27105 mm3/Nm), and then decrease linearly and mildly as rising
of normal load from 60N to 200N. However, the average friction coefficients and specific wear rates of the composites B decrease linearly as rising of the normal load too without inflection point. The friction coefficients of the composites A and B sintered at 900C with wear distance were recorded which show that obvious vibration with maximal instanta-neous friction coefficient 4.36 and minimum approximately to 2 which lead steeply increase of the average friction efficient when normal load was 20N of the composites A. As rising of normal loads, the amplitudes and the averages of the curves decrease with more and more stable wear process. However, the composites B shown a steady-state wear at different normal loads during the test.
3.4 Different wear behavior and wear mechanisms of the composites
Figure 7 shows the worn surface composites A sintered at 900C with different normal load as 20N, 60N, and 200N. Fine mechanical mixed layer as bright spots in the Fig. 5(a) which is projects from worn surface can be observed. The contact between two irregular surfaces induces wear particles corresponding to the granular third body which accumulates against geometric irregularities, and then the third body accumulation induces localized contact area with increasing pressure and temperature.13) Such conditions modify the Fig. 4 SEM images of the composites B with different sintering
temper-ature. (a) 800C. (b) 900C. (c) 1000C.
[image:4.595.55.288.63.610.2] [image:4.595.310.547.73.435.2]density of the third body to form a plate. The local actual load of the samples increase steeply which is the result of rapid decrease of actual contact area which is reduced by accumulation of the mechanical mixed layer. In this study, when normal load was 20N, the formation of fine mechanical mixed layer leaded to rapid increase of local actual load, which leaded to rising of shear stress on the mechanical mixed layer. The higher shear stress induced falling of the mechanical mixed layer and sharp fluctuation in the wear test as mention above. As increase normal load, size of the mechanical mixed layer increase for resisting enhancement of local actual load such as Fig. 7(b) shows, and the friction and wear process became steady. J. H. Ouyang14) reported
that the wear mechanism is not controlled by single mechanical wear in this test, and one of the dominant wear mechanisms in composites, were tribochemical wear as a result of higher loads and relatively higher temperatures. These tribochemical wear, which are stimulated by friction, can result in the formation of a mechanical mixed layer, which can reportedly lower the specific wear loss and gradually reduced friction coefficient as mention above. Farid Akhtar6)indicated that with loading conditions become
higher, there is more and more fragmentation of the plate and hollows or valleys creation. In the test, continuously increase shear stress as increase of normal load to 200N leaded to serious fragmentation of the mechanical mixed layer such as Fig. 7(c).
Figure 8 shows micrographs of the worn surface with of composites B sintered at 900C. Figure 8(a) demonstrates worn surface of the composites B which exhibited deforma-tion layers and tracks along the direcdeforma-tion of sliding. The lower normal load leads to slight localized plastic deforma-Fig. 6 Average fraction coefficients and specific wear rates of the
composites A and B with different temperatures with different normal loads. (a) average fraction coefficients. (b) specific wear rates.
Fig. 7 Micrograph of worn surface of the composites A sintered at 900C
[image:5.595.55.285.72.461.2] [image:5.595.312.542.74.610.2]tion on the worn surface. As rising of normal load to 100N, the consequent increased localized plastic deformation leads to the formation of subsurface cracks resulting in the delamination of surface layer which was shown in the Fig. 8(b). The micrograph in the Fig. 8(c) exhibits some dimples on the worn surface of the tracks caused by the cutting action of the abrasive particles generated from loose debris after wear test under 200N normal load.
Figure 9 shows SEM micrograph of the worn surface of the composites A and B sintered at 900C with 60N normal
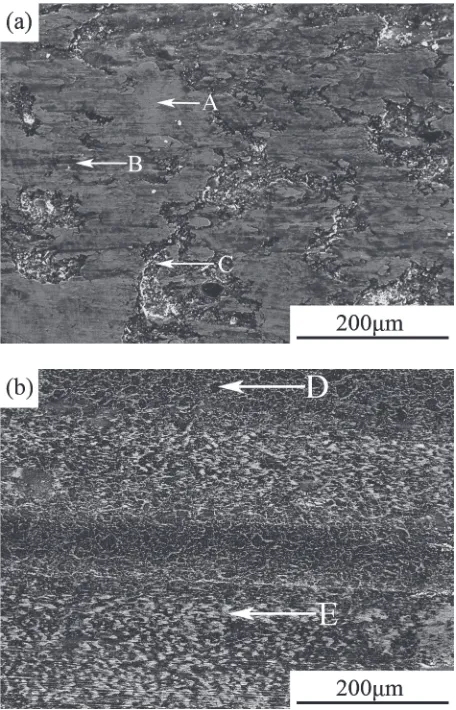
load. Figure 9(a) indicates that the mechanical mixed layer can be observed on the worn surface of the composites A, moreover, it can be seen that mechanical mixed layer composed by light and dark regions. However, Fig. 9(b) represents distinct plastic deformations with shallowest grooves on the worn surface of the composites B with 60N load, and it is remarkable that the contours of conglomeration powder particles which were retained during sintering process are observed in the micrograph.
Table 1 shows the EDS analysis results of five points in the Fig. 9. The results show that the light areas in the mechanical mixed layer such as point A contains more iron and oxygen elements than dark regions such as B in Fig. 9(a), but less of titanium and carbon. The content of copper of the point D and E shows obvious difference that the content of copper of point E (75.46 at%) is much higher than point D Fig. 8 Micrographs of worn surface of the composites B sintered at 900C
with different normal load. (a) 20N. (b) 100N. (c) 200N.
Fig. 9 SEM micrographs of worn surface of the composites A and B sintered at 900C with 60N normal load. (a) the composites A. (b) the
[image:6.595.313.541.72.427.2]composites B.
Table 1 EDS analysis results of five points in the Fig. 9.
Point Cu Ti C O Fe
A 26.03 5.63 5.58 43.64 19.11
B 29.26 10.61 20.81 28.30 11.02
C 32.72 18.27 7.48 18.46 23.07
D 26.05 13.74 9.99 42.55 7.67
[image:6.595.56.286.75.612.2] [image:6.595.305.548.497.574.2]4. Conclusions
(1) Titanium carbide reinforced copper matrix composites were fabricated by powder technology includes mechanical alloying and spark plasma sintering with different techno-logical process. The composites show uniformly distributed titanium carbide, however, the composites with different technological process show different microstructure and phase composition.
(2) The wear resistance of the composites was studied against CG15 steel. The specific wear rates and fraction coefficients of composites A decrease during increase of normal load with obvious point of inflexion on the curves, however, The specific wear rates and fraction coefficients of composites B decreased gradually and linearly during increase of normal load.
2) S. C. Tjong and K. C. Lau: Mater. Lett.43(2000) 274.
3) S. R. Dong, J. P. Tu and X. B. Zhang: Mater. Sci. Eng. A313(2001) 3. 4) R. Murakami and K. Matsui: Wear201(1996) 193.
5) Y. F. Lee, S. L. Lee, C. H. Huang and C. K. Lee: Powder. Metall.44
(2001) 339.
6) F. Akhtar, S. J. Askari and K. A. Shah: Mater. Charact.60(2009) 327. 7) A. Inoue, N. Yano, K. Matsuzaki and T. Masumoto: J. Mater. Sci.22
(1987) 123.
8) T.-Soo Kima, H.-Sung Kimb and J.-Kyu Leea: J. Alloy. Comp.483
(2009) 488.
9) H. P. Klug and L. Alexander: X-Ray Diffraction Procedures for Polycrystalline and Amorphous Materials, 2nd edn., (Wiley, NY, 1974).
10) L. Lu, M. O. Lai and S. Zhang: J. Mater. Process. Technol.67(1997) 100.
11) L. X. Ran, L. Y. Bing, R. Xue and C. Z. Yi: Mater. Charact.58(2007) 504.
12) D. Majcherczak, P. Dufre´noy and Y. Berthier: Wear261(2006) 467. 13) I. Hussainova: Wear255(2003) 121.