Analytical Study of the Growth and Formation Processes
of Faceted 123 Crystals in Superconductive REBCO Oxide
Nobuyuki Mori and Keisaku Ogi
Department of Materials Science and Engineering, Faculty of Engineering, Kyushu University, Fukuoka 812-8581, Japan
Growth process and solidification structures of REBCO (RE¼Y, Ndetc.) fabricated by conventional unidirectional solidification and infiltration-growth method were studied analytically and numerically to clarify growth and structure-formation mechanism of faceted 123 crystals. The change in freezing front temperature of 123 phase during unidirectional solidification and the critical transition conditions of macrostructures from columnar to equiaxed structures were analyzed by using the growth rate (R)-undercooling (T) and the cooling rate (Vc Trelations. The formation process of microstructure of faceted 123 crystal was simulated by two-dimensional numerical method. The results on the formation of solidification structures obtained by the above analysis and simulation showed good agreements with the experimental ones.
(Received November 22, 2004; Accepted January 11, 2005; Published May 15, 2005)
Keywords: superconductor, crystal growth, interface temperature, simulation, YBCO, REBCO, peritectic, facet
1. Introduction
High critical current density (Jc) of high-Tc superconduct-ing oxides such as YBa2Cu3O7x (YBCO, or REBCO, RE¼Y, Ndetc.) is known to be attained by unidirectional solidification, which enables single or columnar crystal structure of 123 phase with finely dispersed normal particles working as flux pinning centers.1–3)Many researchers have studied on the fabrication of superconductors by solidifica-tion process, but, only a few studies have been done on the mechanism of faceted peritectic growth and formation of solidification structures.4–7) Solidification mechanism and structures of REBCO fabricated by conventional unidirec-tional solidification and infiltration-growth method8) are analytically9)and numerically studied in this paper. In case of the infiltration-growth of YBCO, molten Ba-Cu-O with a small amount of Y is infiltrated into pre-sintered porous Y2BaCuO5(Y211), and then it is cooled below the peritectic temperature to grow 123 crystal under a temperature gradient.10)The formation process of macro/micro-structure of YBCO was also studied by numerical simulation of faceted 123 crystal growth.
2. Experimental
The specimen for the infiltration-growth process is composed of two parts: The upper part is Ba-Cu-O (Y:Ba: Cu = 0:3:5,þ0:15{0:6%Y) powder pressed into a plate, and the lower part is a pre-sintered porous perform (30mm
10mm3mm) of Y211 (Y2BaCuO5). Average radius of Y211 powders was 0.8mm. As temperature rises, Ba-Cu-O powder melts and the molten oxide gradually penetrated into pre-sintered porous Y211 (Y2BaCuO5) perform above peritectic temperature (Tp). Then specimen was cooled below the peritectic temperature to grow 123 crystal under a temperature gradient (15–30 K/cm). Some specimens were quenched during the solidification to reveal 123 crystal.
3. Analysis and Simulation of Formation Process of 123 Crystal Structure
3.1 Analysis of formation process and transition con-dition of 123-macrostructures
Formation process and critical transition condition of macrostructure of 123 crystals were analyzed by the follow-ing procedures. The growth rateR(mm/s) of faceted 123-cell was given as a function of undercooling T (K) from the peritectic temperature (Tp) by the following equa-tion:4,5,7,12–16)
R¼AC T2
r
ðTÞ; ðAC¼1:910
5Þ ð1Þ
where,AC: constant,Tr¼T=Tp,T¼TpT,T: inter-face temperature (K),Tp: peritectic temperature of 123 phase, ðTÞ(Pas): viscosity of the liquid:ðTÞ ¼AeexpðEg=TÞ,Ae andEgare constants,Ae¼1:91011,Eg¼26000.
The normal growth rate (u) of a facet interface was obtained from geometric relations of triangular pyramidal or triangular prism-like cell, and given by the following equation:
u¼ApTr2=ðTÞ; ðAp¼1:2105Þ ð2Þ where,Ap: constant.
CCT-curves are necessary to know the undercooling (T) to form a new crystal (nucleation). Figure 1 shows calculated CCT-curves from TTT-curves. CCT-curves are calculated from TTT-curves by using the following modified Johnson-Mehl-Avrami equation,12,13,16)which is modified by consid-ering the faceted growth of 123 crystals and the incubation time (tinc) for nucleation of a crystal.
t¼AðTÞ fs
T6
r Tr
exp B
T2
r Tr3
1=4
þtinc ð3Þ
where,fs: fraction of solid,Tr¼T=Tp,AandBare constants.
A¼412andB¼1:2103were obtained by the fitting of CCT-curve to the experimental data (temperature gradient:
G¼20(K/cm), fraction of solid:fs¼1010, 0.01, and 0.1,
Sv¼0:16(cm2): sectional area of the sample). From
CCT-Special Issue on Solidification Science and Processing for Advanced Materials
curve, whenfs>10100:01, we can get the undercooling (Te) to form a new small crystal in the liquid for a cooling rate (Vc).
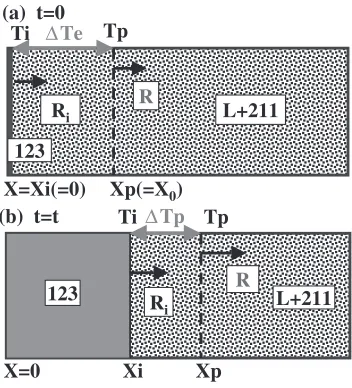
Growth process of faceted 123 crystals is calculated as the change in the interface position (Xi) and interface temper-ature (Ti) with time (t). Since growth rate (Ri) is given by the following differential equation of interface position (Xi) for time (t): Ri¼dXi=dt, and this equation can be solved by Runge-Kutta’s method, we can getXiand temperature (Ti) as a function of time (t). Figures 2(a), (b) shows schematic illustrations of growth model for 123 crystal.
Figure 2(a) shows the initial condition (t¼0s). A new crystal forms at the initial temperature Tið¼TpTÞ, where,Tp: peritectic temperature,T ¼Te: undercooling to form new crystal. Initial position (Xp¼X0) ofTpis given byX0¼Te=G(G: temperaure gradient). Figure 2(b) is at time t¼tðsÞ: the position of peritectic temperature (Xp) is given by: Xp ¼X0þRt, when Rð¼Vc=GÞ is constant. Growth rate (R) was given by the above eq. (1), and the following equation is given to be solved:
Ri¼
dXi
dt ¼ ac ðTiÞ
Tp
Tp
2
ð4Þ
where, Tp is undercooling to grow, and Ti is interface temperature.
Tp¼T ¼TpTi ð5Þ
Ti¼TpGðXpXiÞ ¼TpGðX0þRtXiÞ ð6Þ We can also get the critical transition conditions from columnar to equiaxed crystal structure when the undercool-ing (Tr) for the growth of 123 phase equals to that (Trn) to nucleate new crystals (with a small value of fs¼1010, or 0.01).13)
3.2 Numerical simulation on the formation process of microstructure of faceted 123 crystals
The faceted peritectic growth model for numerical simulation were mentioned in our published papers.12,13)An outline of the simulation model is given as follows.
(1) Elements for FDM analysis and faceted 123 interface growing from liquid+211 phases are selected (element size:
XX (mm2), numbers: nx and ny).
(2) Initial distribution of 211 particles are given by the log-normal distribution:
frðlnðrÞÞ ¼f211f1=ð ffiffiffi 2
p
lnðsgÞÞg
exp½flnðrÞ lnðrmÞg2=f2ðlnðsgÞÞ2g where, f211: fraction of 211 in the liquid, r: radius of 211 particle, lnðrmÞ: arithmetic mean of r, lnðsgÞ: standard deviation ofr.
(3) Time step is given by: t¼ ðx2=DÞ=6, where, D: diffusion coefficient in liquid,x: size of element.
(4) Temperature distribution (TðI;JÞ) is calculated for
t¼tþt.
(5) Nucleated 123-crystals (with different crystal-orienta-tions) are given to the some elements.
(6) Kinetic undercooling Tk of facet interface of growing crystal is given by:
TkðI;JÞ ¼TPTðI;JÞ þ ðCLðI;JÞ CLPÞmLfðÞKv
where, TP: peritectic temperature (K), CLP: liquid concen-tration (mol%) atTp,CLðI;JÞ: liquid concentration (mol%) of element (I;J), mL: liquidus slope (K/mol%) of 123, : Gibbs-Thomson coefficient (mK), fðÞ ¼ fsinþsinð= 2Þg=sinð=2Þ, : angle of facet/interface,17) TðI;JÞ: temperature (K) of element (I;J), and Kv: curvature of interface (m1),x: length of element,f
s: fraction of solid. There is the following relationship between Tk and Ck (¼CLCL123):Tk ¼CkmL.
(7) Interface growth rate VkðI;JÞ is given by a function of Tk and interface angle () with the facet plane: Vk¼
akðTk=TpÞ2, where, ak is a variable: ak¼ak0 ½ðtan= Þ tanhð=tanÞ f1=cosð=4Þ 1g þ1,ak0¼3:410
3 (m/s),¼0:1,: angle between the facet and the interface plane.18)
(8) Increase in fraction of solid (fs) and fraction of solid (fs) in the interface element are given by:fs¼VktL andfs¼fsBþfs.
(9) If interface goes partially to the next element, new
1100 1200 1300
Temperature, T
/K
100 101 102 103 104 105 106 107 108
Time, t / s
TTT
fs=10-10
0.01
0.1 CCT
fs=10-10
0.01 0.1
Tp=1280K
Measured CCT
(fs=0.01 0.1)
(G=5 20K/cm)
Fig. 1 CCT-curves calculated from TTT-curves. CCT-curves were fitted to the experimental data to evaluate the time to grow visible new crystals (fs<0:10:01). (G¼20(K/cm),fs¼1010, 0.01, and 0.1,Sv¼0:16 (cm2)).
(a) t=0 Ti ∆Te Tp
123
Ri R L+211
X=Xi(=0) Xp(=X0) (b) t=t Ti∆Tp Tp
123 R
i
R
L+211
X=0 Xi Xp
[image:2.595.60.280.73.222.2] [image:2.595.81.257.304.498.2]interface element and newfs are defined.
(10) Concentration of liquid for interface element, and concentration of liquid for liquid element are calculated by the following equations.
Concentration of liquid (CLðI;JÞ) for interface element is:
CLðI;JÞ ¼CLBðI;JÞ þ ½fS123ðI;JÞx2fCLBðI;JÞ C123g
þfS211ðI;JÞx2fC211CLBðI;JÞg
þf21123ðI;JÞx2fCLBðI;JÞ C211g þtD½fCLBðI1;JÞ CLBðI;JÞgfLI1
þ fCLBðIþ1;JÞ CLBðI;JÞgfLI2
þ fCLBðI;J1Þ CLBðI;JÞgfLJ1þ fCLBðI;Jþ1Þ
CLBðI;JÞgfLJ2=f1fsðI;JÞgx2
Concentration of liquid (CLðI;JÞ) for liquid element is:
CLðI;JÞ ¼CLBðI;JÞ þ ½tD½fCLBðI1;JÞ
CLBðI;JÞgfLI1þ fCLBðIþ1;JÞ CLBðI;JÞgfLI2
þ fCLBðI;J1Þ CLBðI;JÞgfLJ1þ fCLBðI;Jþ1Þ
CLBðI;JÞgfLJ2=f1fsðI;JÞgx2 where,
fLI1¼
ffiffiffiffiffiffiffiffiffiffiffiffiffiffiffiffiffiffiffiffiffiffiffiffiffiffiffiffiffiffiffiffiffiffiffiffiffiffiffi
fLBðI;JÞfLBðI1;JÞ p
;
fLI2¼
ffiffiffiffiffiffiffiffiffiffiffiffiffiffiffiffiffiffiffiffiffiffiffiffiffiffiffiffiffiffiffiffiffiffiffiffiffiffiffi
fLBðI;JÞfLBðIþ1;JÞ p
;. . .etc.
(11) Further, for the peritectic system, calculate the melting of 211 phase in liquid andCLðI;JÞare calculated using the liquidus.
(12) Calculated results were saved at selected time.
(13) Calculation is repeated after t until the end of calculation.
4. Results and Discussion
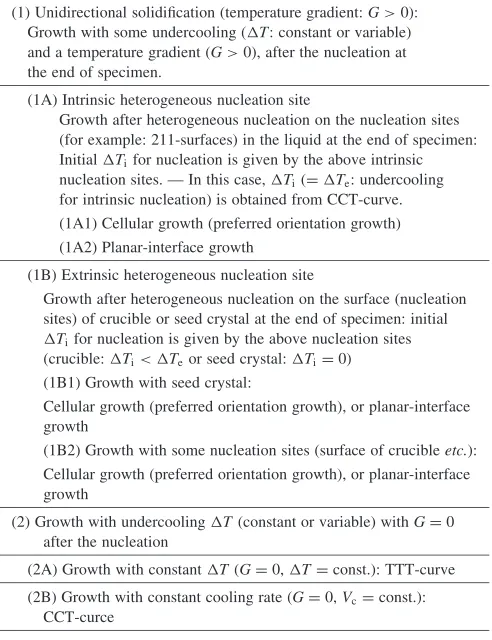
[image:3.595.305.551.86.406.2]4.1 Analytical results of formation process and transi-tion conditransi-tion of 123 macrostructures in YBCO Table 1 shows growth models for the nucleation-growth of faceted 123 crystals. In this paper, (1A) and (1B) cases are studied, and the cases of (2A) and (2B) will be studied in the future.
Figure 3 shows relations between interface temperature (Ti) and distance (Xi) from chill face during cellular growth of 123 crystal. (G¼20K/cm). In case of columnar crystals, growth interface temperature gradually reaches a constant (growth rate: Ri¼R: moving rate of isotherm), and as undercooling for growth becomes small, no nucleation occurs in the liquid. In case of equiaxed crystals, growth temperature gradually drops, and as undercooling for growth becomes large, nucleation should occur in the liquid.
Figure 4 shows relations between interface temperature (Ti) and distance (Xi) from chill face for the planar-interface growth (for G¼20K/cm). We need larger T to get columnar crystals for the same growth rate, sinceu<Rfor the same T. So, the chance to form equiaxed crystals is larger than keeping cell-growth.
Figure 5 shows relations between Ti and Xi for seeded-crystal growth. In this case, the interface temperature can be
set as seeding temperature, and steady state growth is realized from the start under columnar-growth conditions.
Further, the critical transition condition from columnar to equiaxed structure is obtained by equatingTr of eq. (1) to Tr of CCT-curve calculated from TTT-curve (eq. (3)). Figure 6 shows the effects of growth conditions (GandR) on the solidification structure of 123 phase of YBCO. Black marks are faceted columnar crystals, and white marks are Table 1 Growth models for the nucleation-growth of faceted 123 crystals.
(1) Unidirectional solidification (temperature gradient:G>0): Growth with some undercooling (T: constant or variable) and a temperature gradient (G>0), after the nucleation at the end of specimen.
(1A) Intrinsic heterogeneous nucleation site
Growth after heterogeneous nucleation on the nucleation sites (for example: 211-surfaces) in the liquid at the end of specimen: InitialTifor nucleation is given by the above intrinsic nucleation sites. — In this case,Ti(¼Te: undercooling for intrinsic nucleation) is obtained from CCT-curve. (1A1) Cellular growth (preferred orientation growth) (1A2) Planar-interface growth
(1B) Extrinsic heterogeneous nucleation site
Growth after heterogeneous nucleation on the surface (nucleation sites) of crucible or seed crystal at the end of specimen: initial
Tifor nucleation is given by the above nucleation sites (crucible:Ti<Teor seed crystal:Ti¼0) (1B1) Growth with seed crystal:
Cellular growth (preferred orientation growth), or planar-interface growth
(1B2) Growth with some nucleation sites (surface of crucibleetc.): Cellular growth (preferred orientation growth), or planar-interface growth
(2) Growth with undercoolingT(constant or variable) withG¼0
after the nucleation
(2A) Growth with constantT(G¼0,T¼const.): TTT-curve (2B) Growth with constant cooling rate (G¼0,Vc¼const.):
CCT-curce
1220 1230 1240 1250 1260 1270 1280
0 0.5 1 1.5 2 2.5
Distance, Xi/cm
Temperature, Ti/K
R=0.15(µm/s)
R=0.35(µm/s)
R=2.0(µm/s) Columnar
Col.-Equi.-transient
Equiaxed fs=10-10
fs=0.01
fs=10-10
fs=0.01
∆T
(Tp=1280K)
[image:3.595.303.550.257.625.2]equiaxed crystals.4,5,11) Solid lines indicate the calculated transition conditions from columnar to equiaxed crystals for some different section size samples (sectional areas:
Sv¼0:03, 0.16, and 0.38 (cm2), which are equivalent to those of experimental samples). Two solid lines of the same Sv show the results for fs¼0:01, and 1010 respectively. Since crystals in the liquid can be found when they grew to
fs¼0:01or more, the above criteria are used for the critical conditions. The calculated results show good agreement with corresponding experimental data for both cases of the infiltration-growth samples and the conventional unidirec-tional-growth samples. Further, it was clarified that the different size sample shows some differences in the critical condition depending on the section size. When the difference in size is small, larger samples’ criteria can be used to avoid the formation of equiaxed crystals.
4.2 Results of numerical simulation for formation process of faceted 123 crystals
Figures 7(a), (b) show simulated growth process of
two-dimensional numerical simulation for Y123 cells growing from liquid+211 phases of hyper-peritectic YBCO with fine 211 particles fabricated by infiltration-growth method. Very fine 211 particles are dispersed uniformly in 123 phase, which shows in good agreement with the experimental result (Fig. 7(c)). These fine and uniform particles should increase the critical current density (Jc).
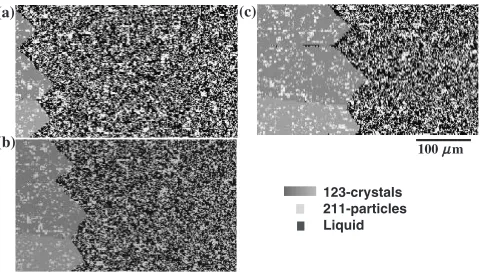
Figure 8 shows simulated growth process of faceted 123-cells from 211+liquid in hyper-peritectic YBCO with fine 211 particles fabricated by the conventional unidirectional solidification. In this case, liquid pools were incorporated into inter-cell region. Also in this figure, it is observed that a crystal with non-preferred orientation gradually became smaller due to overgrowth of preferred-orientation crystal. 1220
1230 1240 1250 1260 1270 1280
0 0.5 1 1.5 2 2.5
Distance, Xi/cm
Temperature, Ti/K
R=0.15( m/s)
R=0.35(µm/s)
R=2.0( m/s) Columnar
Col.-Equi.-transient
Equiaxed
fs=10-10
fs=0.01
fs=10-10
fs=0.01
µ
µ
Fig. 4 Relations between interface temperature (Ti) and distance (Xi) from chill face for planar interface growth. (G¼20K/cm).
1220 1230 1240 1250 1260 1270 1280
0 0.5 1 1.5 2 2.5
Distance, Xi/cm
Temperature, Ti/K
R=0.15(µm/s)
R=0.35( m/s)
R=2.0( m/s) Columnar
Col.-Equi.-transient
Equiaxed
fs=10-10
fs=0.01
fs=10-10
fs=0.01
µ
µ
Fig. 5 Relations between interface temperature (Ti) and distance (Xi) from chill face. (seeded crystal growth,G¼20K/cm).
2.5
Growth rate, R/
ms
-1
Temperature gradient, G/Kcm-1 0
0.5 1 1.5 2
0 20 40 60 80 100
Equi.
Mori et al.(Sv=0.16cm2)
Cima et al.(Sv=0.03cm2)
Shiohara et al. (Sv=0.03cm2)
Infiltration-growth (Sv=0.38cm2)
Col.
(Sv=0.38) fs=0.01
fs=10-10
(Sv=0.16) fs=0.01
fs=10-10
(Sv=0.03) fs=0.01
fs=10-10
Sv: sectional area fs:fraction of 123
Columnar crystals Equiaxed crystals
µ
Fig. 6 Effect of growth rate (R) and temperature gradient (G) on the solidification structure of 123 phase of YBCO. Solid lines indicate the calculated transition conditions from columnar to equiaxed crystals. (Sv¼0:03, 0.16, 0.38 (cm2),fs¼0:01,1010).
(c)
211+liquid
123+211 (a)
(b)
211+liquid
123+211
0 Y/% 22.2 100µm
[image:4.595.54.284.70.248.2] [image:4.595.309.542.73.245.2] [image:4.595.53.285.307.491.2] [image:4.595.308.549.333.494.2]5. Conclusions
Analytical and numerical studies were performed on the formation process of the solidification structures for REBCO oxides fabricated by the infiltration-growth method, and conventional unidirectional-growth method, and the follow-ing results were obtained.
(1) Relations between interface temperature (Ti) and distance (Xi) from chill face during cellular or planar growth of 123 crystals were analyzed. In case of columnar crystal growth, the freezing front temperature gradually reached a constant one and as undercooling for growth became small, no nucleation occurred in the liquid. In case of equiaxed crystals, growth temperature gradually dropped, and as undercooling for growth became large, nucleation occurred in the liquid.
(2) The critical transition condition of macrostructure from columnar to equiaxed 123 crystals in unidirectionally solidified YBCO was analyzed with CCT curve for 123 crystallization, and the calculated results (function of growth
rate (R) and temperature gradient (G)) agreed well with the experimental results.
(3) Macro/microstructure formation processes of 123 crystals in YBCO were also studied by two-dimensional numerical simulation on the faceted peritectic growth of 123 crystals, and the results showed how the optimum structure forms in samples fabricated by infiltration-growth process.
Acknowledgements
This work was supported in part by Grant-in-Aid for Scientific Research (B2) of Japan. The authors would like to thank K. Yamada (Kyushu University) for assistance with experiment.
REFERENCES
1) M. Murakami, H. Fujimoto, K. Yamaguchi, N. Nakamura, N. Koshizuka and S. Tanaka: J. Adv. Sci.4(1992) 75.
2) M. Murakami, M. Morita, K. Doi and K. Miyamoto: Jpn. J. Appl. Phys.
28(1989) 1189.
3) Y. Imagawa, K. Kakimoto and Y. Shiohara: Physica C280(1997) 245. 4) N. Mori and K. Ogi: J. Japan Inst. Metals58(1994) 1444.
5) M. J. Cima, M. C. Flemings, A. M. Figueredo, M. Nakade, H. Ishii, H. D. Brody and J. S. Haggerty: J. Appl. Phys.72(1992) 179. 6) Y. Nakamura, T. Izumi, Y. Shiohara and S. Tanaka: J. Japan Inst.
Metals56(1992) 810.
7) N. Mori and K. Ogi: J. Japan Inst. Metals62(1998) 1109–1116. 8) N. Hari Babu, M. Kambara, P. J. Smith, D. A. Cardwell and Y. Shi:
J. Mater. Res.15(2000) 1235–1238.
9) N. Mori: Collected Abstracts of the 2003 Spring Meeting of the Japan Inst. of Metals, (p. 400).
10) N. Mori: Collected Abstracts of the 2002 Autumn Meeting of the Japan Inst. of Metals, (p. 500).
11) Y. Shiohara and A. Endo: Materials Science and Engineering R: Reports: A Review JounalR19(1997) 1–86.
12) N. Mori and K. Ogi: Mater. Trans.42(2001) 220–226. 13) N. Mori and K. Ogi: J. Japan Inst. Metals66(2002) 634–642. 14) N. Mori, H. Hata and K. Ogi: J. Japan Inst. Metals56(1992) 648. 15) A. Endo, H. S. Chauhan, T. Egi and Y. Shiohara: J. Mater. Res.11
(1996) 795.
16) H. A. Davies: Phys. Chem. of Glasses17(1976) 159. 17) L. Nastac: Proc. of MCSP IV (1999) pp. 31–42.
18) H. Yasuda and I. Ohnaka: Proc. of MCSP IV (1999) pp. 117–124.
(a)
(b)
(c)
100µm
123-crystals 211-particles Liquid
Fig. 8 Simulated growth process of faceted 123-cells from 211+liquid in hyper-peritectic YBCO (with fine 211 particles) fabricated by the conventional unidirectional solidification. (a) 200 s, (b) 400 s, (c) 600 s (f211L¼0:43,rm¼0:8mm,lnðsgÞ ¼lnð1:7Þ,T¼20K,G¼20K/cm,
[image:5.595.50.290.72.210.2]