Munich Personal RePEc Archive
The Effect of Intelligence on Financial
Development: A Cross-Country
Comparison
Kodila-Tedika, Oasis and Asongu, Simplice
1 February 2015
Online at
https://mpra.ub.uni-muenchen.de/67295/
1
AFRICAN GOVERNANCE AND DEVELOPMENT
INSTITUTE
A G D I Working Paper
WP/15/002
The Effect of Intelligence on Financial Development: A Cross-Country Comparison
Oasis Kodila-Tedika
Universityof Kinshasa Department of Economics, DRC
Simplice A. Asongu
African Governance and Development Institute, Yaoundé, Cameroon.
2
© 2015 African Governance and Development Institute WP/15/002
AGDI Working Paper
Research Department
The Effect of Intelligence on Financial Development: A Cross-Country Comparison
Oasis Kodila-Tedika & Simplice A. Asongu1
February 2015
Abstract
We assess the correlations between intelligence and financial development in 123 countries
using data averages from 2000-2010. Human capital is measured in terms of IQ, cognitive
ability & cognitive skills, while financial development is appreciated both from financial
intermediary and stock market development perspectives. Short-term financial measures are
private and domestic credits whereas long-term financial indicators include: stock market
capitalization, stock market value traded and turnover ratio. The following findings are
established. (1) With respect to private credit, the positive correlations of IQ and cognitive
ability are broadly similar while that of cognitive skills is substantially higher in terms of
magnitude. (2) The correlation between intelligence and other financial variables are broadly similar. (3) The underlying findings are broadly confirmed in terms of sign of correlation,
though the magnitude of correlation is higher (lower) with the addition of social capital or
ethnic fractionalization (institutions or income). (4) When continents are excluded to control
for extreme effects, baseline results are confirmed and the following on order of continental
importance in financial development is established in increasing magnitude: Africa,
Americas, Oceania, Europe & Asia.
JEL Code: E01, G20 I20, I29
Keywords: Financial development, Intelligence, Skill, Human Capital
Acknowledgement
We are highly indebted toAng & Kumar (2014) for sharing their data.
1
3 1. Introduction
Financial development remains fundamental to economic growth. Despite some
country-specific (Muchai, 2013) doubts, recent meta-studies have confirmed this mainstream narrative
(Asongu, 2015a). The findings are consistent with perspectives of, inter alia: policy evidence
(Chapili, 2013; Asongu, 2014a), financial markets (Agbloyor et al., 2015) and nexuses among
saving & exports for long-run economic growth (Wang et al., 2012).
While the relationship between finance and growth has been substantially investigated,
as far as we know, literature on the finance-KE (Knowledge Economy) nexus is scarce. Given
the abundantly documented role of finance in economic growth, investigating the relationship
between KE and finance is important since financial intermediation is indispensible for
converting saving into long-term investment opportunities.
The nexus between financial development and human capital has not been the object
of substantial research focus in theoretical and empirical literature. Arguments can be made to
justify the relationship between the two variables. An important human capital enables access
to better information, hence, a potential risk mitigating factor (Outrivelle 1999). Human
capital is also positively related to savings (Kelly 1980; De Gregorio, 1992; Bernheim et al.,
1997). This could be explained by the fact that developed intelligence is associated with
long-term horizon planning (Potrafke, 2012). It is within this framework that Jones and Podemska
(2010) have established a link between Intellectual Quotient (IQ) and savings (Podemska,
2010).
According to Ukenna et al. (2010), skills and training can better predict human capital
(HC) because they affect growth rapidly. Human capital in the financial sector in forms of
competent or skilled banking professionals could contribute to enhancing the stability of
banks. Evidence on complementarity between HC and financial development is provided by
4
development (or human resources) in the growth process. From a microeconomic study
viewpoint, education has been established to be an essential component of village bank
success in Thailand (Paulson, 2002).
The impact of traditional measurements (such as life expectancy, average schooling
years in the primary, second & tertiary levels and life expectancy) have not resulted in a
consensus due to issues in data measurement (De la Fuente & Doménech, 2006; Cohen &
Soto, 2007). The marginal/negligible role played by output in these indicators of human
capital has been criticized by Weede & Kämpf (2002) because of too much reliance on inputs.
The criticism has motivated some authors to use evaluation tests of international standard,
notably: the Program of International Student Assessment (PISA) and Trends in International
Mathematics and Science Study (TIMSS) (HanushekandKimko, 2000; Hanushek &
Woessmann, 2008, 2009).
Another current of the literature involving psychologists and Vanhanen (2001, 2002,
2006) has used Intellectual Quotient (IQ) data compiled from many countries. The data which
has been employed in many published studies (Lynn & Vanhanen, 2012) is increasingly being
used by a growing stream of economists, notably: Weede & Kämpf (2002), Jones &
Schneider (2006), Ram (2007), Potrafke (2012), Kodila-Tedika & Kanyama-Kalonda (2014),
Kodila-Tedika (2014), Rindermann et al. (2014), Kodila-Tedika & Mustacu (2014) and
Kodila-Tedika & Bolito-Losembe (2014). The current data from Lynn, Hanushek &
Vanhenenis which is increasingly being improved has recently been updated by Rindermann
(2007ab) and Meisenberg & Lynn (2011). The updated data which we use in the present study
has been recently employed by Kanyama-Kalonda (2014) and Meisenberg & Lynn, (2012).
By investigating the relationship between intelligence and financial development, the
study contributes to existing literature by steering clear of the current finance-KE studies and
5
literature that has been essentially focused on the African continent to a broad sample of 123
countries. In essence, a close relationship between KE and finance has been confirmed by
Asongu (2014b), especially with the instrumentality of Intellectual Property Rights (IPRs)
(Asongu, 2013a)2. Given the apparent linkage between IPRs, KE and IQ, it would be
interesting to extend the existing literature by investigating the role of IQ in financial
development.
The rest of the study is organised as follows. Section 2 discusses the data and
methodology. The empirical analysis and discussion of results are covered in Section 3.
Robustness checks are presented in Section 4. We conclude with Section 5.
2. Empirical strategies and data
2.1 Data
The study investigates cross-sectional average data between 2000-2010 from 123 countries.
The intelligence data sources from Meisenberg & Lynn (2011). This is an update of previous
versions found in Lynn & Vanhanen (2002, 2006). This dataset compiles hundreds of national
IQ test averages during the 20th and 21st centuries using the best methods of practice. Average
IQ measures both the nation’s labor quality and general-purpose human capital (Jones &
Schneider, 2006; Hanushek & Kimko, 2000).
The recent dataset has the appeal of including more nations as well as a composite indicator
of intelligence in human capital form.
Three indicators of intelligence are taken into account: the measurement of IQ from
Lynn & Vanhanen: an indicator for which missing values are completed with school
achievement and a measure of human capital that is a composite indicator for school
2
6
achievement and IQ. However, given that the measurement of the first is a sub-set of the
second, we restrict the analysis exclusively to the second and third measures.
The dependent variables consist of proxies in financial intermediary or short-run
financial development and stock market development or long-term financial development.
The former is measured by private sector credit and domestic credit which are proxies of
financial activity (Asongu, 2013b). It is important to note that domestic credit comprises of
credit from both private and public sectors. The latter or stock market variable includes: stock
market capitalization, stock market value traded and stock market turnover ratio. These
variables from Ang & Kumar (2014) are consistent with the underlying stock market
performance/development literature (Asongu, 2012, 2013c).
The control variables include: credit rights, trade openness, financial openness,
interactions between trade openness and financial openness, legal origins (British, French,
German & Scandinavian), religions (Catholic, Muslim & Protestants), latitude and tropics.
These variables which are from Ang & Kumar (2014) are defined in the appendix alongside
information on their corresponding sources. We discuss the expected signs concurrently with
the estimations in the results sections.
2.1. Empirical specification
Consistent with Ang & Kumar (2014), the specification in Eq. (1) below investigates the
effect of intelligence or Human capital (HC) on financial development (FD) across 123
countries.
i i i
i HC X
FD 12 3 (1)
Where: FDi(HCi) represents a financial development (human capital) indicator for country i
1
7
private credit, domestic credit, stock market capitalisation, stock market value traded and
stock market turnover ratio. HC are indicators of human capital discussed in the preceding
section while X embodies creditor rights protection, financial openness, trade openness, legal
origins, latitude and tropics.
Like in Ang & Kumar (2014), our main interest is to investigate if the HC coefficient
is statistically and economically significant. While Eq. (1) is estimated using Ordinary Least
Squares (OLS) using heteroscedasticity consistent standard errors, potential issues of
endogeneity would addressed with an instrumental variable (IV) estimation technique which
we describe in subsequent sections. In line with Ang & Kumar (2014), we employ private
sector credit in baseline regressions and use domestic credit and three stock market
performance dynamics for robustness checks.
3. Estimation results
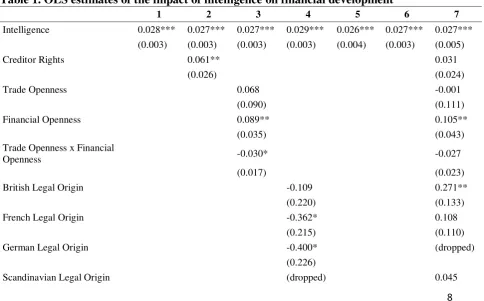
Table 1 below shows results of baseline regressions in Eq. (1). The first Column which shows
univariate regressions confirms the expected positive correlation between intelligence and
financial development. Hence intelligence is positively correlated with private sector credit.
Columns 2 to Column 7 assess the relationship conditional on other covariates (control
variables). The order of specification is consistent with Ang & Kumar (2014). From the
results, the positive correlation is broadly confirmed across specifications in significance and
magnitude of estimated human capital (or intelligence) coefficient. Accordingly, the estimated
coefficients vary between 0.026 and 0.029 and the degree of adjustment (or explanatory
power) of estimated coefficients also varies between 42.1% and 60.4%. It is logical to expect
an increasing R² with more control variables into the specifications. Hence, we could infer
from the baseline estimations that countries with high IQ are associated with higher degrees
8
Most of the significant control variables have the expected signs. (1) Creditor rights
protection has been associated with higher levels of financial development (La Porta et al.,
1998). (2) Financial openness is intuitively expected to be positively linked with more
availability of private credit because it offers possibilities of external financial flows.
However, too much trade openness may interact with financial openness to negatively affect
private domestic credit. The threshold value of the modifying variable (trade openness) which
is 2.96 (0.089/0.030) is within range of 0.205 to 3.729 (Ang & Kumar, 2014, p. 54). This
conclusion is broadly consistent with recent literature on the need for financial initial
conditions for the benefits of openness (Asongu, 2014d). (3) Countries of British legal origin
have been documented to have an edge over their French civil law counterparts (La Porta et
al., 2008; Asongu, 2012b). (4) The predominantly Protestant British culture also played a
substantial role in London’s emergence as the financial centre of the world (Rosenberg &
[image:9.595.71.556.465.766.2]Birdzell, 1986)
Table 1. OLS estimates of the impact of intelligence on financial development
1 2 3 4 5 6 7
Intelligence 0.028*** 0.027*** 0.027*** 0.029*** 0.026*** 0.027*** 0.027*** (0.003) (0.003) (0.003) (0.003) (0.004) (0.003) (0.005)
Creditor Rights 0.061** 0.031
(0.026) (0.024)
Trade Openness 0.068 -0.001
(0.090) (0.111)
Financial Openness 0.089** 0.105**
(0.035) (0.043)
Trade Openness x Financial
Openness -0.030* -0.027
(0.017) (0.023)
British Legal Origin -0.109 0.271**
(0.220) (0.133)
French Legal Origin -0.362* 0.108
(0.215) (0.110)
German Legal Origin -0.400* (dropped)
(0.226)
9 (0.279)
Latitude 0.248 -0.168
(0.248) (0.279)
Tropics 0.023 -0.149
(0.076) (0.111)
Fraction Catholic 0.095 0.143
(0.114) (0.119)
Fraction Muslim -0.004 -0.015
(0.099) (0.119)
Fraction Protestants 0.521*** 0.454*
(0.195) (0.261) _cons -1.876*** -1.864*** -1.987*** -1.634*** -1.757*** -1.868*** -0.112***
(0.212) (0.212) (0.232) (0.362) (0.265) (0.223) (0.401)
Number of observations 168 168 160 167 155 166 147
R2 0.421 0.438 0.496 0.498 0.419 0.473 0.604
note: .01 - ***; .05 - **; .1 - *;
Notes: The dependent variable is private credit to GDP, averaged over the period 2000–2010. Figures in parentheses are robust standard errors.
Dropped: Not involved in the specifications due to issues of multicollinearity and overparameterization.
4. Robustness checks
In Section 4, several robustness checks are performed on the baseline specification in Column
7 of Table 1. In the checks, alternative financial development measurements are used with
different indicators of human capital. Concretely, the robustness checks entail: the use of
alternative measurements of cognitive human capital (cognitive ability and cognitive skills) in
Section 4.1; alternative indicators of financial development (domestic credit and three stock
market performance dynamics) in Section 4.2; controlling for other effects (Section 4.3) and
exclusion of continents (Section 4.4).
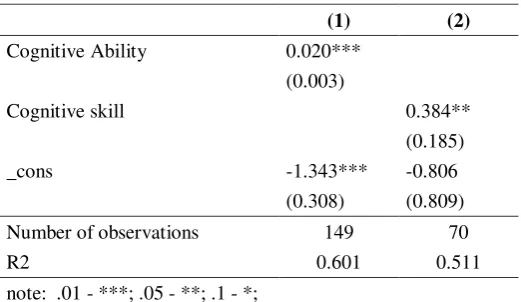
4.1 Alternatives measures of cognitive human capital
Cognitive human capital has been measured in different ways in the human capital literature.
As discussed in the data section, the current measurement has experienced an evolution.
While that of Rindermann (2007b) proposed a measurement of cognitive ability, Hanushek &
10
indicators to confirm the baseline findings in Table 1. The results broadly confirm the
baseline findings on a positive correlation between cognitive human capital and financial
development. It is also interesting to note that the variable from Rindermann (2007b)
produces findings that are more consistent with those in Table 1. On the other hand, though
with a lower level of significance, that of Hanushek & Woessmann (2009) substantially
deviates in terms of magnitude. Two inferences are established. (1) Cognitive ability is more
closely related to IQ in the appreciation of the correlation between human capital and
financial development. (2) Cognitive skills potentially drive more financial development than
[image:11.595.168.429.347.498.2]cognitive ability.
Table 2. Alternatives measures of cognitive human capital
(1) (2)
Cognitive Ability 0.020*** (0.003)
Cognitive skill 0.384**
(0.185)
_cons -1.343*** -0.806
(0.308) (0.809)
Number of observations 149 70
R2 0.601 0.511
note: .01 - ***; .05 - **; .1 - *;
A constant and all control variables (i.e., creditor rights, trade openness, financial openness, trade openness x financial openness,legal origins dummies, geographic variables and religion variables) used in Tables 1 are included in the estimations but the results are not reported to conserve space. Figures in parentheses are robust standard errors.
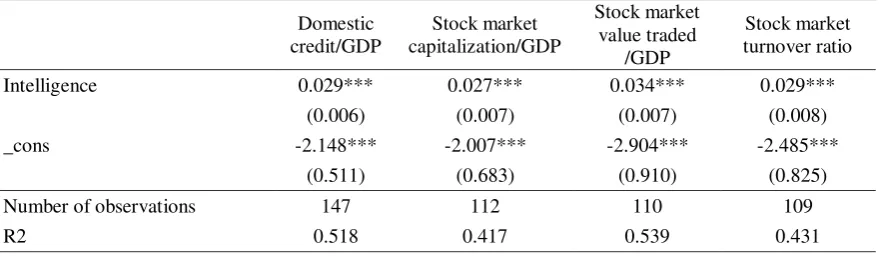
4.2 Alternative indicators of financial development
In Table 3 below, we employ the alternative measurements of financial development
discussed in the model specification section for further robustness purposes. These include:
one measurement of financial intermediary development and three indicators of stock market
performance. The resulting findings confirm the direction of the underlying correlation and
11
sensitivity of intelligence is almost the same. This is essentially because magnitudes of the
[image:12.595.72.512.170.299.2]estimated coefficients are broadly consistent across specifications.
Table 3.Alternative measures of financial development Domestic
credit/GDP
Stock market capitalization/GDP
Stock market value traded
/GDP
Stock market turnover ratio
Intelligence 0.029*** 0.027*** 0.034*** 0.029***
(0.006) (0.007) (0.007) (0.008)
_cons -2.148*** -2.007*** -2.904*** -2.485***
(0.511) (0.683) (0.910) (0.825)
Number of observations 147 112 110 109
R2 0.518 0.417 0.539 0.431
note: .01 - ***; .05 - **; .1 *;
A constant and all control variables (i.e., creditor rights, trade openness, financial openness, trade openness x financial openness, legal origins dummies, geographic variables and religion variables) used in Tables 1 are included in the estimations but the results are not reported to conserve space. Figures in parentheses are robust standard errors.
4.3. Controlling for other effects
In Table 4 below, we control for other effects to confirm the baseline findings. Notably, we
add dimensions of: social capital, institutions, ethic fragmentation, income and continents.
The definitions of these variables and their corresponding sources are provided in the
Appendix. In broad terms, these additional variables can be considered as controlling for the
failure to take into account the unobserved heterogeneity in baseline regressions.
We provide some justifications for the choice of additional control variables. Guiso et
al. (2004) accord social capital some major role in financial development. The role of
institutions has been investigated by many authors, inter alia: Girma & Shortland (2008).
Ethnic diversity has been documented to substantially impair financial development (Easterly
& Levine, 2003; Beck et al., 2003). The wealth of nations also fundamentally influences the
12
specificities are also considered based on the intuition that some continents are less developed
financially.
The underlying findings are broadly confirmed in terms of sign of correlation, though the
magnitude of correlation is higher (lower) with the addition of social capital or ethnic
fractionalization (institutions or income).
Most of the significant control variables have the expected signs. Accordingly, social
capital, institutions and income-levels are positively correlated with private credit. This is
consistent with the underpinnings from Guiso et al. (2004), Girma & Shortland (2008) and
[image:13.595.70.527.339.721.2]Ang & Kumar (2014) respectively.
Table 4. Controlling for other effects
Private credit/GDP Add Social
Capital
Add Institutions
Add Ethnic
Fractionalization Add Income
Add Continents Intelligence 0.030*** 0.016*** 0.026*** 0.018*** 0.029*** (0.005) (0.004) (0.005) (0.006) (0.006)
Social Capital 0.715**
(0.312)
Institutions 0.065***
(0.010)
Ethnic Fractionalization -0.194
(0.159)
Income 0.107**
(0.045)
Europe 0.013
(0.189)
Asia -0.040
(0.089)
Americas -0.070
(0.129)
Oceania -0.128
(0.197)
_cons -2.403*** -1.220*** -1.866*** -2.072*** -2.218***
(0.452) (0.382) (0.486) (0.413) (0.583)
Number of observations 105 147 146 146 147
R2 0.649 0.681 0.608 0.627 0.607
note: .01 - ***; .05 - **; .1 - *;
13 included in the estimations but the results are not reported to conserve space. Figures in parentheses are robust standard errors.
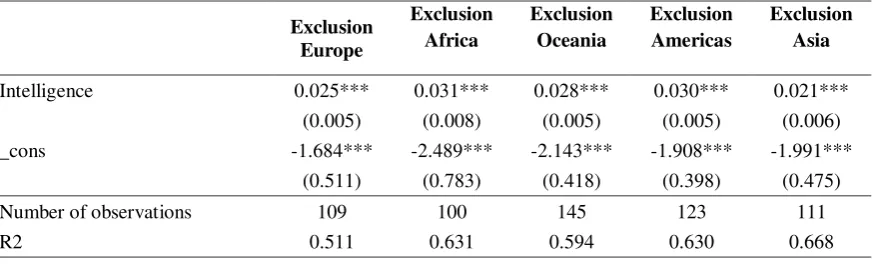
4.4. Exclusion of continents
Table 5 below presents a further robustness check in which we exclude continents. The
interest is to assess the behaviour of the variables of interest when a continent is excluded
from the sample. This is also a means of controlling for extreme values that could influence
the baseline findings. The relatively lower correlation coefficient observed when continents
are excluded implies the excluded continent has a higher level of financial development. In
the same line of intuition, a relatively higher correlation coefficient upon the exclusion of a
continent means the excluded continent has a lower level of financial development. In
addition to the baseline findings being confirmed in terms of magnitude of and significance in
the correlation coefficients, the following is the order of continental importance in financial
[image:14.595.74.511.460.592.2]development in increasing magnitude: Africa, Americas, Oceania, Europe & Asia.
Table 5. Exclusion of continents
Exclusion Europe
Exclusion Africa
Exclusion Oceania
Exclusion Americas
Exclusion Asia
Intelligence 0.025*** 0.031*** 0.028*** 0.030*** 0.021*** (0.005) (0.008) (0.005) (0.005) (0.006)
_cons -1.684*** -2.489*** -2.143*** -1.908*** -1.991***
(0.511) (0.783) (0.418) (0.398) (0.475)
Number of observations 109 100 145 123 111
R2 0.511 0.631 0.594 0.630 0.668
note: .01 - ***; .05 - **; .1 - *;
14 5. Concluding implications
The purpose of this study has been to assess the relationship between intelligence and
financial development in 123 countries using cross-sectional data between 2001-2010. Our
findings broadly contradict the perspective that human development can be enhanced only at
the expense financial development. Accordingly, the view of a trade-off substantially
misstates the fundamental purpose of human development and at the same time
underestimates the return to education, especially if it is construed as resulting in more
risk-taking.
Human capital is measured in terms of IQ, cognitive ability & cognitive skills, while financial
development is appreciated both from financial intermediary and stock market development
perspectives. Short-term financial measures are private and domestic credits whereas
long-term financial indicators include: stock market capitalization, stock market value traded and
turnover ratio. The following findings have been established. (1) With respect to private
credit, the positive correlations of IQ and cognitive ability are broadly similar while that of
cognitive skills is substantially higher in terms of magnitude. (2) The correlation between
intelligence and other financial variables are broadly similar. (3) The underlying findings are
broadly confirmed in terms of sign of correlation, though the magnitude of correlation is
higher (lower) with the addition of social capital or ethnic fractionalization (institutions or
income). (4) When continents are excluded to control for extreme effects, baseline results are
confirmed and the following on order of continental importance in financial development is
established in increasing magnitude: Africa, Americas, Oceania, Europe & Asia.
The findings have strong implications for countries in Sub-Saharan Africa where low
literacy rate influences people to hold wealth in physical assets as opposed to financial assets,
15
high literacy may push citizens to engage in financial transactions among themselves without
the intermediary of the formal financial system. Therefore, high education is needed for stock
market development. In the same vein, education also increases banking patronage.
It is also important to note that the type of education matter and financial development
project also matters. For instance, many analysts think the Douala Stock Exchange of
Cameroon has not picked-up well since its launch because the business community was not
properly informed/educated of the benefits of financial markets before it was launched. Hence
the stock market has failed to affect economic growth (Ake & Ognaligui, 2010).
The above evidence is not definitive, fundamentally because it points to the associations
between indicators of human capital and financial development, which are not causalities but
correlations. Hence, assessing the causal nexuses with data endowed with more degrees of
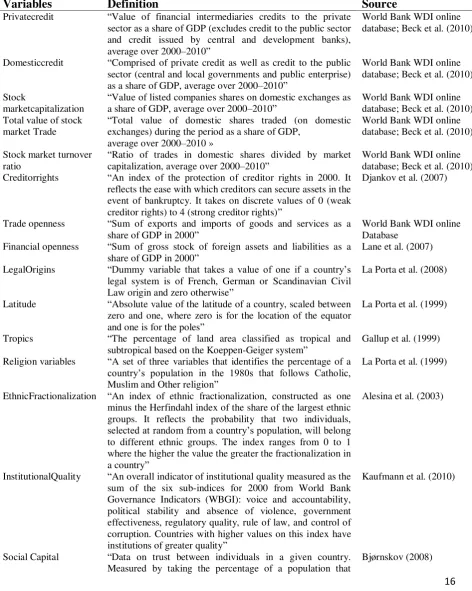
16 Appendix
[image:17.595.68.541.181.772.2]Appendix A. Data sources and summary statistics of variables
Table A1
Definitions and Sources of variables.
Variables Definition Source
Privatecredit “Value of financial intermediaries credits to the private sector as a share of GDP (excludes credit to the public sector and credit issued by central and development banks), average over 2000–2010”
World Bank WDI online database; Beck et al. (2010)
Domesticcredit “Comprised of private credit as well as credit to the public sector (central and local governments and public enterprise) as a share of GDP, average over 2000–2010”
World Bank WDI online database; Beck et al. (2010)
Stock
marketcapitalization
“Value of listed companies shares on domestic exchanges as a share of GDP, average over 2000–2010”
World Bank WDI online database; Beck et al. (2010) Total value of stock
market Trade
“Total value of domestic shares traded (on domestic exchanges) during the period as a share of GDP,
average over 2000–2010 »
World Bank WDI online database; Beck et al. (2010)
Stock market turnover ratio
“Ratio of trades in domestic shares divided by market capitalization, average over 2000–2010”
World Bank WDI online database; Beck et al. (2010) Creditorrights “An index of the protection of creditor rights in 2000. It
reflects the ease with which creditors can secure assets in the event of bankruptcy. It takes on discrete values of 0 (weak creditor rights) to 4 (strong creditor rights)”
Djankov et al. (2007)
Trade openness “Sum of exports and imports of goods and services as a share of GDP in 2000”
World Bank WDI online Database
Financial openness “Sum of gross stock of foreign assets and liabilities as a share of GDP in 2000”
Lane et al. (2007)
LegalOrigins “Dummy variable that takes a value of one if a country’s legal system is of French, German or Scandinavian Civil Law origin and zero otherwise”
La Porta et al. (2008)
Latitude “Absolute value of the latitude of a country, scaled between zero and one, where zero is for the location of the equator and one is for the poles”
La Porta et al. (1999)
Tropics “The percentage of land area classified as tropical and subtropical based on the Koeppen-Geiger system”
Gallup et al. (1999)
Religion variables “A set of three variables that identifies the percentage of a
country’s population in the 1980s that follows Catholic,
Muslim and Other religion”
La Porta et al. (1999)
EthnicFractionalization “An index of ethnic fractionalization, constructed as one minus the Herfindahl index of the share of the largest ethnic groups. It reflects the probability that two individuals,
selected at random from a country’s population, will belong
to different ethnic groups. The index ranges from 0 to 1 where the higher the value the greater the fractionalization in a country”
Alesina et al. (2003)
InstitutionalQuality “An overall indicator of institutional quality measured as the sum of the six sub-indices for 2000 from World Bank Governance Indicators (WBGI): voice and accountability, political stability and absence of violence, government effectiveness, regulatory quality, rule of law, and control of corruption. Countries with higher values on this index have institutions of greater quality”
Kaufmann et al. (2010)
Social Capital “Data on trust between individuals in a given country. Measured by taking the percentage of a population that
17
answers ‘Yes’ to the World Value Survey (WVS) question ‘In general, do you think that most people can be trusted?’,
supplemented by data from the Danish Social Capital Project, the Latinobarometro and the Afrobarometer”
Intelligence Meisenberg and Lynn
(2011)
References
Agbloyor, E. K., Abor, J., Adjasi, K. D., & Yawson, A., (2015). “Private Capital Flows and
Economic Growth in Africa: The Role of Domestic Financial Markets”, Journal of International Money and Finance: Forthcoming.
Ake, B., & Ognaligui, R. W., (2010) “Financial Stock Market and Economic Growth in
Developing Countries: The Case of Douala Stock Exchange in Cameroon”, International Journal of Business and Management , 5(5), pp. 82-88.
Alesina, A., Devleeschauwer, A., Easterly, W., Kurlat, S., & Wacziarg, R. (2003).”Fractionalization”.Journal of Economic Growth 8, pp. 155–194.
Ang, J. B., & Kumar, S., (2014). “Financial development and barriers to the cross-border diffusion of financial innovation”, Journal of Banking and Finance, 39 (2014), pp. 43-56.
Asongu, S. A. (2012a). “Government Quality Determinant of Stock Market Performance in
African Countries”, Journal of African Business, 13 (3), pp.183-199.
Asongu, S. A., (2012b). “Law and finance in Africa”, Brussels Economic Review, 55, (4), pp. 385-408.
Asongu, S. A., (2015a). “Finance and growth: New evidence from Meta Analysis”, Managerial Finance, 41(6): Forthcoming.
Asongu, S. A., (2015b). “Financial sector competition and knowledge economy: evidence from SSA and MENA countries”, Journal of the Knowledge Economy
http://link.springer.com/article/10.1007%2Fs13132-012-0141-4
Asongu, S. A., (2013a). “The ‘Knowledge Economy'-finance nexus: how do IPRs matter in
SSA and MENA countries?”, Economics Bulletin, 33(1), pp. 78-94.
Asongu, S. A., (2013b). “Real and monetary policy convergence: EMU crisis to the CFA zone”, Journal of Financial Economic Policy, 5,(1), pp. 20-38.
Asongu, S. A., (2013c). “African Stock Market Performance Dynamics: A Multidimensional
18
Asongu, S. A., (2014a). “How Would Monetary Policy Matter In The Proposed African Monetary Unions? Evidence From Output And Prices”, African Finance Journal, 16(2), pp. 34-63.
Asongu, S. A., (2014b). “The “knowledge economy”–finance nexus in SSA and MENA
countries”, International Journal of Islamic and Middle Eastern Finance and Management, 7(2), pp. 200-213.
Asongu, S. A., (2014c). “Knowledge Economy and Financial Sector Competition in African
Countries”, African Development Review, 26, (2), pp. 333-346.
Asongu, S. A., (2014d). “Financial development dynamic thresholds of financial
globalization: Evidence from Africa”, Journal of Economic Studies, 41, (2), pp.166 -195
Baltagi, B. H., Demetriades, P., & Law, S. H. (2009). “Financial development and openness: evidence from panel data”. Journal of Development Economics 89, pp. 285–296.
Beck, T., Demirguc-Kunt, A., Levine, R., (2003). “Law, endowments, and finance”.Journal of Financial Economics 70, pp. 137–181.
Beck, T., Demirgüç-Kunt, A., & Levine, R., (2010). “Financial institutions and markets across countries and over time: the updated financial development and structure database”.
World Bank Economic Review 24, 77–92.
Beck, T., Levine, R. & Loayza, N., (2000). “Finance and the sources of growth”.Journal of Financial Economics 58, pp. 261–300.
Benhabib, J., & Spiegel, M., (1994). “The Role of Human Capital in Economic Development: Evidence from Aggregate Cross-Country Data”. Journal of Monetary Economics 34, pp. 143–173.
Bernheim, B. D., Garrett, D. M. & Maki, D.M., (1997). “Education and savings: the long- term effects of high school curriculum mandates”. Mimeo.
Bjørnskov, C., (2008).” Social trust and fractionalization: a possible reinterpretation”.
European Sociological Review 24, pp. 271–283.
Chapili, J., (2013). “Monetary Policy, Foreign Exchange Intervention and Exchange Rate Volatility in Zambia”, African Finance Journal, 15(1), pp. 36-55.
Cohen, D. &Soto, M., (2007). “Growth and Human Capital: Good Data, Good Results”.
Journal of Economic Growth, 12, pp. 51-76.
De Gregorio, J., (1996). “Borrowing Constraints, Human Capital Accumulation and Growth”.
Journal of Monetary Economics, 37, pp. 49-71.
19
Much Difference Does Data Quality Make?”Journal of the European Economic Association 4, pp. 1-36.
Djankov, S., McLiesh, C., & Shleifer, A., (2007). “Private credit in 129 countries”.Journal of Financial Economics 84, pp. 299–329.
Evans, D., Green, C. & Murinde, V., (2002). “Human Capital and Financial Development in Economic Growth: New Evidence Using the Translog Production Function”. International Journal of Finance and Economics, 7, pp.123-140.
Gallup, J.L., Sachs, J.D., & Mellinger, A., (1999. “Geography and Economic Development”. Center for International Development (Harvard University), Working Papers No.1.
Girma, S., Shortland, A., (2008). “The political economy of financial development”. Oxford Economic Papers 60, pp. 567–596.
Guiso, L., Sapienza, P., & Zingales, L., (2004). “The role of social capital in financial development”.American Economic Review 94, pp. 526–556.
Hanushek, E. A., & Kimko, D. D., (2000). “Schooling, Labor-Force Quality, and the Growth of Nations”.American Economic Review, 90, pp. 1184-1208.
Hanushek, E. A., & Woessmann, L., (2008). “The Role of Cognitive Skills in Economic Development”.Journal of Economic Literature, 46(3), pp. 607-668.
Hanushek, E. A. &Woessmann, L., (2009). “Do better schools lead to more growth? Cognitive skills, economic outcomes, and causation”. IZA Discussion Papers No. 4575.
Hakeem, M., & Oluitan, O., (2012). “Financial Development and Human Capital in South Africa: A Time-Series Approach”, Research in Applied Economics, 4(3), pp. 18-38.
Jones, G., & Podemska, M., (2010). “IQ in the utility function: Cognitive skills, time preference, and cross-country differences in savings rates”. Retrieved 17 Dec. 2010 from http://mason.gmu.edu/~gjonesb/IQsavings.pdf
Jones, G., &Schneider, W. J., (2006). “Intelligence, human capital, and economic growth: A Bayesian Averaging of Classical Estimates (BACE) approach”. Journal of Economic Growth, 11, pp. 71-93.
Kalonda-Kanyama I., & Kodila-Tedika, O., (2012). “Quality of Institutions: Does Intelligence Matter?”, Working Papers 308. Economic Research Southern Africa.
Kaufmann, D., Kraay, A., Mastruzzi, M., (2010). “The Worldwide Governance Indicators: Methodology and Analytical Issues”. Policy Research Working Paper Series 5430, The World Bank
20
Kodila-Tedika, O., & Bolito-Losembe, R., (2014). “Poverty and Intelligence: Evidence Using Quantile Regression”, EconomiicResearrchGuarrdiian, (1), pp. 25-32.
Kodila-Tedika, O., & Mutascu, M., (2014). “Tax Revenues and Intelligence: Cross-Sectional Evidence”. MPRA Paper 57581, University Library of Munich, Germany.
La Porta, R., Florencio, L.-d.-S., Shleifer, A., & Vishny, R. W., (1997). “Legal determinants of external finance”. Journal of Finance 52, pp. 1131–1150.
La Porta, R., Florencio, L.-d.-S., Shleifer, A., & Vishny, R. W., (1998). “Law and finance” .Journal of Political Economy 106, pp. 1113–1155.
La Porta, R., Lopez-de-Silanes, F., Shleifer, A., 2008. “The economic consequences of legal origins”. Journal of Economic Literature 46, 285–332.
La Porta, R., Lopez-de-Silanes, F., Shleifer, A., Vishny, R., (1999). “The quality of government”. Journal of Law, Economics and Organization 15, pp. 222–279.
Lane, P. R., Milesi-Ferretti, & Maria, G., (2007). “The external wealth of nations market: Revised and extended estimates of foreign assets and liabilities, 1970–2004”. Journal of International Economics 73, 223–250.
Lynn, R., & Vanhanen, T., (2001). “National IQ and economic development: a study of eighty-one nations”. Mankind Quarterly 41, pp. 415-435.
Lynn, R., & Vanhanen, T., (2002). IQ and the Wealth of Nations. Westport CT: Praeger.
Lynn, R., & Vanhanen, T., (2006). IQ and Global Inequality. Augusta GA: Washington Summit.
Lynn, R., & Vanhanen, T., (2012a). Intelligence.A Unifying Construct for the Social Sciences. London: Ulster Institute.
Lynn, R., & Vanhanen, T. (2012b). National IQs: A review of their educational, cognitive, economic, political, demographic, sociological, epidemiological, geographic and climatic correlates. Intelligence, http://dx.doi.org/10.1016/j.intell.2011.11.004.
Mankiw, G. Romer, D., & Weil, D., (1992). “A contribution to the empirics of growth.”
Quarterly Journal of Economics 107, pp. 407–437.
Meisenberg, G., & Lynn, R., (2011). “Intelligence: A measure of human capital in nations”.
Journal of Social, Political and Economic Studies, 36(4), pp. 421-454.
Meisenberg, G., & Lynn, R., (2012). “Cognitive Human Capital and Economic Growth: Defining the Causal Paths”. Journal of Social, Political and Economic Studies, 37(4), pp. 141-179.
Muchai, J., (2013). “Assessing The Finance-Growth Channel in Kenya: A VAR Analysis”,
21
Outreville, J., (1999). “Financial Development, Human Capital and Political Stability”.
UNCTAD Discussion Paper No 142.
Potrafke, N., (2012). “Intelligence and corruption”. Economics Letters, 114,109-112.
Ram, R., (2007). “IQ and economic growth: Further augmentation of Mankiw-Romer-Weil model”. Economics Letters, 94, 7-11.
Rindermann, H., (2007a). “Intelligence, cognitive abilities, human capital, and rationality at different levels”. PsychologischeRundschau, 58(2), 137-145.
Rindermann, H. (2007b). “The g-factor of international cognitive ability comparisons: The homogeneity of results in PISA, TIMSS, PIRLS and IQ-tests across nations”. European Journal of Personality, 21, pp. 667-706.
Rindermann, H., Kodila-Tedika, O., & Christainsen, G., (2014). “Cognitive capital,
governance, and the wealth of nations”. MPRA Paper 57563, University Library of Munich, Germany.
Robinson, J., (1952). The Rate of Interest and Other Essays. Macmillan, London.
Rosenberg, N., & Birdzell, L., (1986). How The West Grew Rich: The Economic Transformation of The Industrial World. Basic Books, New York.
Stulz, R.M., & Williamson, R., (2003). “Culture, openness, and finance”. Journal of Financial Economics 70, pp. 313–349.
Ukenna, S., Ijeoma, N., Anionwu, C., & Olise, M., (2010). “Effect of Investment in Human Capital Development on Organisational Performance: Empirical Examination of the
Perception of Small Business Owners in Nigeria”. European Journal of Economics, Finance and Administrative Sciences, Issue 26.
Wang, V., Yun, H-C., & Lee S-H., (2012). “An Empirical Study of Taiwan's 1978-2006
Financial Development, Export, Saving and Economic Growth”, African Finance Journal, 14(1), pp. 87-101.