Munich Personal RePEc Archive
The Nuisance of Slow Moving Products
in Electronic Commerce
Chodak, Grzegorz
Wrocław University of Technology
20 February 2016
Online at
https://mpra.ub.uni-muenchen.de/70141/
The Nuisance of Slow Moving Products in Electronic
Commerce
Grzegorz Chodak1*
1
Department of Operational Research, Wroclaw University of Technology, Wroclaw, Poland *Corresponding author: [email protected]
Abstract
Article presents the important problem of products with low turnover in environment of electronic commerce. The key factors leading to the increasing number of slow moving stock keeping units (SKUs) in the context of online store are described. These issues are divided into two sets: general (not connected with online environment) and these which concern mainly online stores. The difficulty with identification of such SKUs is presented and proposition of inventory control shelf warmers indicator is shown. Afterwards the three-stage procedure for dealing with the occurrence of shelf warmers is described. The last part of the paper present the short conclusions.
Keywords
: Inventory Control, Online Store, Shelf Warmer, Slow Moving Products1. Introduction
The electronic commerce is developing rapidly in most countries. There is numerous literature concerning management of online stores. Many publications analyse recommendation systems, social marketing, search engine optimization and many other marketing aspects, but there is a research gap concerning the problem of slow moving products in online store - one of the most important aspects of inventory management. Online stores can offer numerous amount of items, because of two-steps transaction process (first step - customer creates an order, second step - the order is carried out; the second step may take place after a few days). Very wide assortment may lead to the increasing number of slow moving products which are sold from time to time or even never. Those products can be named "shelf warmers", as they lie for the long time on the inventory shelves. As the increasing number of slow moving products increases frozen capital, therefore it is very important to identify such a products in order to inventory optimization and liquidity ratios improvement.
The aim of this article is to indicate of the reasons
of “shelf warmers” accumulation in online store and
to propose the identification method for such a products. The multi-criteria recommendation system, which allows the reduction of inventory stocks is proposed as the method for decreasing the number of shelf-warmers in online store. The purpose of the proposed methods is to reduce the inventory costs and therefore increasing the store profits.
The structure of this article is the following. Firstly the key factors leading to the increasing number of shelf warmers are presented. Then shelf warmers indicator is described. Afterwards the proposal of three-stage reduction of shelf warmers procedure is shown. In the last part of the paper short conclusions are presented.
2. The key factors leading to the
increasing number of shelf warmers
The factors leading to increase the number of shelf warmers can be classified into two classes [Chodak, 2016]: the first group of reasons relates to the trade in general, while the second is associated with a specific e-commerce environment.
The factors that are usually responsible for the formation of unwanted inventory, are inaccurate demand forecasts and incorrect inventory control.
The subject about demand forecasting and inventory control has been analysed for many decades, for example, Croston [1974] drew attention to the unnecessarily high stocks that result from using inaccurate forecasts. Stochastic models
developing Croston’s Method for intermittent
demand forecasting [Shenstone, Lydia, and Rob J. Hyndman, 2005] may improve inventory control in some cases.
Sani et al. [1997] looked for the best periodic inventory control and demand forecasting methods for low demand items. They concluded that for very low demands below 20 per year, Naddor's heuristic [1980] is best both concerning costs and service.
the control of inventory for SKUs with so-called lumpy demand. While forecasting methods based on Exponentially Weighted Moving Averages (EWMA) are efficient for the fast moving SKUs, it was apparent to management that some over-stocking was occurring for the slow moving products [Johnston et at., 1996]. The inventory management of items with lumpy demands is very complicated task. In [Mak et al., 1999] a proposal of mathematical model is developed for the determination of optimal replenishment policies for such slow moving SKUs.
It should be mentioned that an important factor in the formation of unwanted inventory is incorrect product assortment planning (PAP) [Mantrala et al., 2009], [Mahajan et al., 2001].
The another reason of unwanted inventory may be improper pricing policy, leading to decreasing of demand. In electronic commerce the possibility of price comparison causes higher price elasticity of demand and therefore higher prices may lead to significant decrease of product sales.
The bibliography concerning intermittent demand is very wide, but there is a research gap concerning slow moving products in online stores, therefore factors leading to increase the number of shelf warmers in e-shops will be discussed more deeply.
The first factor concerning the specific environment of e-commerce is the ability to offer a large number of product items that make up the so-called long tail (long-tail idea was popularized by Chris Anderson in [Anderson, 2006]) . This is due to the three distinguishing features of electronic commerce:
two-step sales process (product ordered by the customer does not have to be physically available in the warehouse store),
low cost of the product presentation in virtual e-shop (in contrast to the traditional trade there is no limit due to the high cost of the exhibition space),
efficient search engines, which allow the customer to quickly find the desired product even with a large number of product items.
In traditional retail the assortment optimization models deals with a setting in which shelf space limits total inventory and also shelf-space allocation
determines the inventory level of each product [Kök
et al., 2007]). In electronic commerce there are many different inventory management models, that allow possessing different percentage range of assortment in stock (e.g. dropshipping models or other logistic outsourcing).
Offering a wide range of products in online store leads to increase of potential demand. Diverse search engine optimization allows the e-shop which have a large number of product items, attract a large number
of heterogeneous customers. However, offering a long tail of product items in stock, delivered by different suppliers may require ordering the slow moving items in quantity exceeding current demand, due to the minimum order quantity (MOQ) set by the supplier. For example the customer orders one product, but the MOQ is three items. Two items in
stock will “warm shelves” waiting for order. If the
problem of rests of MOQ considers thousands of SKUs it will significantly decrease the liquidity of company.
Another important factor is the lack of the need to maintain costly exhibition space in online stores. Warehousing costs, if they do not have to be stored at the exhibition areas are much lower. This may result in less pressure on the efficient inventory control. Managers may loosen inventory policy, paying more attention to the best sellers and not optimizing the inventory of low moving SKUs.
The third factor, which leads to increasing number of shelf warmers in online store is the large heterogeneity of online shoppers due to the absence of geographical constraints. Differentiation of customers may increase range of assortment in order to satisfying different tastes. On the other hand the variability of online environment may cause that even the shelf warmer in a few years can suddenly become a target of many customers (for example niche book, will be popularized by a teacher in one school and many parents will look for this book in Internet).
the postponement of delivery and cancellation of the order by customer.
The mentioned reasons may lead to increasing number of shelf warmers in online store, therefore there is a need to propose how to manage with this problem.
3. Shelf warmers indicator
In order to determine the shelf warmers among set of SKUs, the indicator is proposed [Chodak, 2016]. In the case of a small number of SKUs the usage of this type of indicator is not necessary. However, when the number of SKUs is large (e.g. more than a thousand), applying of such a tool allows to obtain important data, from the optimization of inventory costs point of view. Shelf warmers indicator can be used to designate the goods most lingering in the stock.
By using the FIFO method (first in first out), proposed indicator, shows the goods lying in stock, rather than those that are currently high stock and are characterized by high turnover. Although this indicator also points out those products with high turnover, but improper replenishment policy. Therefore the measurements of this indicator should be analysed two dimensionally.
Formally, this indicator can be expressed as:
where:
ZM – shelf warmers indicator; n – delivery number;
N – number of deliveries; the last delivery is number 1;
d – number of days of filling the shelves by SKUs in accordance with the FIFO;
I – amount of product.
This indicator can be calculated both in natural units, such as in monetary values. In the second case, it will mean defaulting value of the goods.
An example
Assume that the stock has 6 pieces of goods, of which one piece comes from the previous delivery, which took place 20 days ago, and 5 pieces from the last delivery, which took place 5 days ago. For aforementioned data shelf warmers indicator value will be 45.
The important topic is the evaluation of the correct value (or range) of this indicator. Firstly we can assume that it should be in the range (0, d1*I1), where d1 is the number of days elapsed from the date of last delivery, and I1 is the amount or value of the goods from last delivery. If the index value exceeds d1*I1 , this means that in stock are products from
earlier than the last delivery, therefore there is a need of changing ordering policy.
Determination how much days that have elapsed since the last delivery means that goods can be regarded as the shelf warmer is problematic, because it depends on many different factors like: product type, phase of the product life cycle etc.
Because high value of indicator may also take place due to a high rotating commodity, as well as the long time that has elapsed since the last (or previous) supply, therefore we suggest that this indicator should be two-dimensional:
(ZM, d1)
Goods can be classified applying the threshold values as follows:
ZMi > dli*I1i and d1i > mi => Tiϵ Z1
ZMi > dli*I1i and d1i < mi => Tiϵ Z2
ZMi < dli*I1i and d1i > mi => Tiϵ Z3
ZMi < dli*I1i and d1i < mi => Tiϵ Z4
ZMi > dli*I1i and d1i > mi => Tiϵ Z5
ZMi > dli*I1i and d1i < mi => Tiϵ Z6
ZMi < dli*I1i and d1i > mi => Tiϵ Z7
ZMi < dli*I1i and d1i < mi => Tiϵ Z8
where:
i – number of SKU.
mi– threshold value of the number of days elapsed
from the date of the last delivery of ith SKU.
d1i– number of days from the last delivery of ith
SKU.
I1i– amount of ith items in the last delivery.
Z1,..,Z8 – the classification sets of SKUs (see Table 1).
To determine the threshold value m may be applied indicator of sufficiency (WM). Sufficiency ratio (often encountered in the literature under the name of turnover ratio, expressed in days) determines the time for which should be sufficient stock of product:
where:
M – the size of the current inventory;
S d – average daily sale (quotient of sales volume
and the number of days in the period).
It is assumed that the threshold value of the shelf warmers indicator, is the parameter of each SKU. However in the case of low rotating goods, denominator can take a value close to 0 (or even 0, in the case of goods for which there was no sale yet), thus it seems reasonable to suggest average sufficiency ratio determined for the entire group of goods and accept it as the threshold value of m. The sufficiency ratio is only proposal of the m value, but
d S
M WM
N
n n n I
d ZM
another indicators can be taken into consideration in this case, concerning turnover of the product.
If the sale of the product has not occurred yet, the criterion for classifying the product as a shelf warmer is only the number of days from the last date of delivery that exceeds the value m.
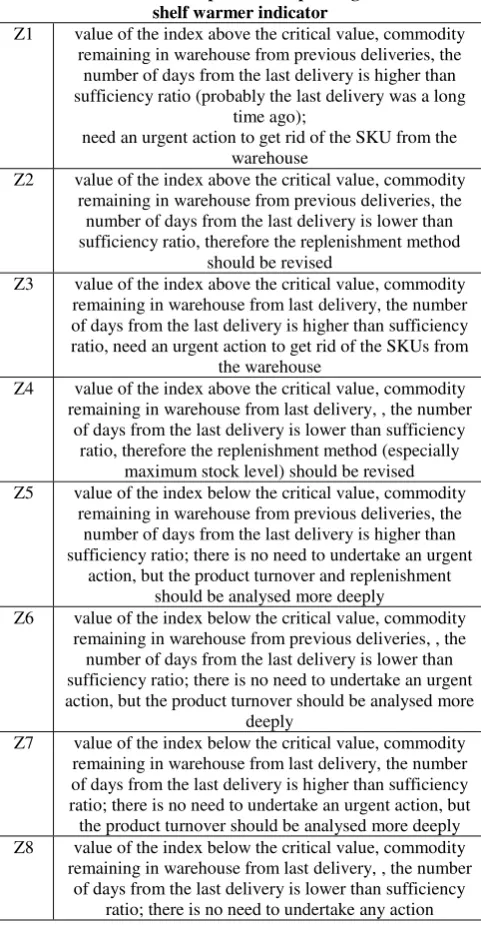
[image:5.595.54.295.178.641.2]The classification of products depending on the rate of shelf warmer indicator is presented in the Table 1.
Table 1. Classification of products depending on the rate of shelf warmer indicator
Z1 value of the index above the critical value, commodity remaining in warehouse from previous deliveries, the number of days from the last delivery is higher than sufficiency ratio (probably the last delivery was a long
time ago);
need an urgent action to get rid of the SKU from the warehouse
Z2 value of the index above the critical value, commodity remaining in warehouse from previous deliveries, the number of days from the last delivery is lower than sufficiency ratio, therefore the replenishment method
should be revised
Z3 value of the index above the critical value, commodity remaining in warehouse from last delivery, the number of days from the last delivery is higher than sufficiency ratio, need an urgent action to get rid of the SKUs from
the warehouse
Z4 value of the index above the critical value, commodity remaining in warehouse from last delivery, , the number
of days from the last delivery is lower than sufficiency ratio, therefore the replenishment method (especially
maximum stock level) should be revised Z5 value of the index below the critical value, commodity
remaining in warehouse from previous deliveries, the number of days from the last delivery is higher than sufficiency ratio; there is no need to undertake an urgent
action, but the product turnover and replenishment should be analysed more deeply
Z6 value of the index below the critical value, commodity remaining in warehouse from previous deliveries, , the number of days from the last delivery is lower than sufficiency ratio; there is no need to undertake an urgent action, but the product turnover should be analysed more
deeply
Z7 value of the index below the critical value, commodity remaining in warehouse from last delivery, the number of days from the last delivery is higher than sufficiency ratio; there is no need to undertake an urgent action, but the product turnover should be analysed more deeply Z8 value of the index below the critical value, commodity
remaining in warehouse from last delivery, , the number of days from the last delivery is lower than sufficiency
ratio; there is no need to undertake any action
In the case of goods for which the shelf warmers indicator value exceeds a critical value, it is necessary to implement procedures to reduce their inventory.
4. Proposal of three-stage reduction of
shelf warmers procedure
The identification of shelf warmers is important, but this is only one step in the process of inventory control improvement. On the Fig. 1 is presented the three-stage procedure enabling reduction of shelf warmers. The first stage was described in the previous topic.
The next step is implementation of method which enables reducing unwanted inventory. Standard techniques for reducing the unwanted inventory are the following: price promotion methods, the cross-selling, bundling of goods, additional forms of promotion. In some cases returning policy should be renegotiated with the suppliers (if it is possible).
Other possibilities in case of high inventory cost of SKU are scrapping and utilization. In some cases it could be cheaper than remaining this products in stock.
[image:5.595.309.556.324.444.2]The issue of selecting the best possible strategy and its linkage to organizational priorities and context has received very limited attention in the academic literature [Syntetos et al., 2010].
Fig. 1. The three-stage procedure for dealing with the occurrence of shelf warmers
In the case of an online store very important form of promotion of goods is a recommendation system (e.g. [Schafer , Konstan & Riedl 2001], [Adomavicius & Tuzhilin, 2005], [Senecal & Nantel, 2004]). It allows to offer goods which could be interested for the customer, as well as it can also become a way of reducing the unwanted inventory. A suitable combination of these two criteria, should not only allow the sale of goods according to demand, but also to reduce the inventory of shelf warmers.
In the following topic will be presented the recommendation system aimed at reducing the shelf warmers inventory in online store. More details about this recommendation model is in [Chodak & Suchacka, 2012].
The general idea of proposed recommendation model is to offer products which are more likely to be purchased by a target customer (i.e. products with high quality recommendation rank) and which generate also high cost in inventory at the same time. Depending on a specific Web store, two criteria (the quality recommendation rank and the product inventory cost) can be combined together.
Measurement of shelf warmers dynamics
Indicator(s) of working capital Method(s) of shelf warmers reduction
Recommendation system which takes into account inventory costs Identification of shelf warmers
We can use any recommendation technique to obtain a set of N top recommendations as a first step and then use product inventory costs to get the final set of recommendations, but we can also use multicriteria analysis. The second solution is proposed in this paper.
Taking into account the weights of the two criteria (quality recommendation rank and the product inventory cost) two different kinds of models are possible. In some models the weights are endogenous whereas in others they are automatically generated when the model is optimized (e.g. in [Ramanathan, 2006]). In proposed model the weights are partially exogenous: firstly, a decision maker (for example a manager) has to rank the criteria according to their importance and determine the value of weight w; then, w is corrected by LVi, the
factor reflecting a decline in the inventory cost of the ith product. The weights obtained are the same to all SKUs in the product population of a Web store.
The value of recommendation function for the ith SKU in relation to the jth product is calculated according to the formula [Chodak & Suchacka, 2012]:
RFij LViwQij_norm(1LViw)Ci_norm
where:
RFij is the recommendation function value for the ith product, estimated to take decision on showing the ith product together with the jth product or not,
LVi is the inventory cost factor indicating a percentage annual decline in the value of the ith product,
w is the weight established by a manager, w [0,1],
Qij_norm is the normalized value of quality
recommendation rank Qij, Qij_norm [0, 1], Ci_norm is the normalized value of the ith
product’s cost, Ci_norm [0, 1].
Values of the recommendation function are calculated for all products (this must be done periodically) and stored in database. The proposed recommendation system should point out products with improper inventory control and facilitate overtaking them from the warehouse. Products determined for the ith product will be presented on the Web page describing the ith product in a recommendation rectangle, which is usually placed under the product description.
The last step of the proposed three-stage procedure is measurement of shelf warmers dynamics. This step is intended to estimate if applied methods of unwanted inventory reduction are efficient or not. This topic will not analysed more deeply as there is a considerable literature about liquidity indicators concerning working capital.
5. Summary
The slow moving products are one of the key problem in online store with large number of stock keeping units. The various factors leading to raise the number of shelf warmers in e-shop presented in this paper show that this trouble may occur more often in e-commerce than in traditional brick and mortal trade. Slow moving SKUs can increase the overall inventory cost in online store, therefore proposed shelf warmer indicator seems to be a proper device for inventory optimization, which can be taken into account by e-commerce managers. Identification of such a problematic products is very important in context of proper inventory control. Proposed shelf warmer indicator enables to find products with incorrect inventory level. Such products should lower liquidity of company therefore, the inventory policy should be changed for them. The proposed three-stage procedure for dealing with the occurrence of shelf warmers, including recommendation model may improve the working capital liquidity of an e-shop.
References
[1] Adomavicius G., Tuzhilin A. (2005), Toward the Next Generation of Recommender Systems: A Survey of the State-of-the-Art and Possible Extensions. IEEE
Transactions on Knowledge and Data Engineering, Vol. 17, Issue 6, June 2005, pp. 734 - 749.
[2] Anderson, Chris. (2006), "Long tail. Why the future of business is selling less of more." New York: Hyperion. [3] Chodak G. (2016) Inventory control in online store - the
problem of "shelf warmers", Hradeckie Ekonomickie Dni, Hradec Kralove.
[4] Chodak, G., & Suchacka, G. (2012). Cost-oriented recommendation model for e-commerce. In Computer Networks (pp. 421-429). Springer Berlin Heidelberg. [5] Christopher M., (1986), The Strategy of Distribution
Management, Heinemann, Oxford.
[6] Croston J.D., (1974), Stock levels for slow moving items,
Operations Research Quarterly, vol. 25, no. 1, pp. 123-130.
[7] de Brito, M. P., & Dekker, R. (2003). Modelling product returns in inventory control—exploring the validity of general assumptions. International Journal of Production Economics, 81, 225-241.
[8] Gaur, V., Fisher, M. L., & Raman, A. (2005). An econometric analysis of inventory turnover performance in retail services. Management Science, 51(2), 181-194. [9] Johnston, F. R., & Boylan, J. E. (1996). Forecasting for
items with intermittent demand. Journal of the Operational Research Society, 113-121.
[10] Kök, A. G., & Fisher, M. L. (2007). Demand estimation and assortment optimization under substitution: Methodology and application. Operations Research, 55(6), 1001-1021.
[11] Mahajan, S., & Van Ryzin, G. (2001). Stocking retail assortments under dynamic consumer substitution.
Operations Research, 49(3), 334-351.
algorithms. Computers & Industrial Engineering, 37(1), 273-276.
[13] Mantrala, M. K., Levy, M., Kahn, B. E., Fox, E. J., Gaidarev, P., Dankworth, B., & Shah, D. (2009). Why is assortment planning so difficult for retailers? A framework and research agenda. Journal of Retailing, 85(1), 71-83. [14] Naddor E. (1980). An analytic comparison of two
approximately optimal (s, S) inventory policies. Technical Report 330, Department of Mathematical Science, Johns Hopkins University, Baltimore.
[15] Pyke, D. F., Johnson, M. E., & Desmond, P. (2001). E-FULFILLMENT. Supply Chain Management Review, 27. [16] Ramanathan R.: ABC inventory classification with
multiple-criteria using weighted linear optimization. Computers and Operations Research, Vol. 33, Issue 3, March 2006, pp. 695-700.
[17] Sani, B., & Kingsman, B. G. (1997). Selecting the best periodic inventory control and demand forecasting methods for low demand items. Journal of the Operational Research Society, 48(7), 700-713.
[18] Schafer J. B., Konstan J. A., Riedl J. (2001): E-Commerce Recommendation Applications. Data Mining and Knowledge Discovery, Vol. 5, No. 1-2, 2001, pp. 115-153. [19] Schultz, C. R. (1987). Forecasting and inventory control
for sporadic demand under periodic review. Journal of the Operational Research Society, 453-458.
[20] Senecal, S., & Nantel, J. (2004). The influence of online product recommendations on consumers’ online choices.
Journal of retailing, 80(2), 159-169.
[21] Shenstone, Lydia, and Rob J. Hyndman. "Stochastic models underlying Croston's method for intermittent demand forecasting." Journal of Forecasting 24.6 (2005): 389.
[22] Srinivasan, S. S., Anderson, R., & Ponnavolu, K. (2002). Customer loyalty in e-commerce: an exploration of its antecedents and consequences. Journal of retailing, 78(1), 41-50.
[23] Syntetos, A. A., Babai, M. Z., Davies, J., & Stephenson, D. (2010). Forecasting and stock control: A study in a wholesaling context. International Journal of Production Economics, 127(1), 103-111.