Solidi
fi
cation Microstructure and Critical Conditions of Shrinkage Porosity
Generation in Die Casting Process of JIS-ADC12 (A383) Alloy
+Masafumi Hamasaki
1and Hirofumi Miyahara
21Nagoya Research and Development Center, Mitsubishi Heavy Industries, Ltd., Nagoya 453-8515, Japan
2Department of Materials Science and Engineering, Graduate School of Engineering, Kyushu University, Fukuoka 819-0395, Japan
Differential thermal analysis (DTA), analyses of unidirectional solidification process and die casting process, and computational numerical simulations were conducted for JIS-ADC12 (A383) alloy to investigate the generation conditions of shrinkage porosities which occasionally appear in JIS-ADC12 die castings and affect the quality of products. The crystallization temperature of the primary alpha phase and AlSi binary eutectic phase are estimated to be 856 and 838 K from DTA, respectively. The multi-phase eutectic reaction of JIS-ADC12 alloy starts from 826 K, andfinishes at 801 K. The primary alpha dendrites are clearly observed in the unidirectional solidification microstructures, and the relationship between the secondary dendrite arm spacing 2 and the local solidification time¿f is expressed by the following equation:
2¼6:45¿0f:31. The primary alpha dendrites are also observed in the die cast sample. The average cooling rate estimated from2is approximately
60 K/s at the depth of 0.5 mm from the surface of die castings. The computational numerical simulation reveals that the values of solidification parameterG=pffiffiffiffiRincreases around the surface of the JIS-ADC12 die castings in where the amount of shrinkage porosities decreases. Especially, shrinkage porosities of the size lager than 200 µm is observed when the value ofG=pffiffiffiffiRis less than or equal to 1.4 K0.5s0.5/mm.
[doi:10.2320/matertrans.F-M2013806]
(Received October 17, 2012; Accepted April 9, 2013; Published June 25, 2013)
Keywords: JIS-ADC12 alloy, differential thermal analysis, unidirectional solidification, die casting, secondary dendrite arm spacing, local
solidification time, shrinkage porosity
1. Introduction
Die casting process which is a type of injection molding casting method has the advantage of producing a lot of casting products with smooth surfaces and low draft angles in short time. In fact, aluminum alloy die casting products are widely used for automobiles and other transportation vehicles, not only for simple structural parts, but also for engine cylinder blocks and air conditioner compressor casings, which require both of light weight and high-pressure resistance.
Aluminum alloy die casting products occasionally contain undesirable casting defects in the bodies, for example cold
flakes (scattered chilled layers),1,2) surface segregations,3) shrinkage cavities4)(open shrinkage, internal shrinkage and shrinkage porosities), and gas porosities.57) Especially, shrinkage porosities are regarded as a serious defect which cause problems to pressure resistance, strength and
dimen-sion accuracy. In order to assure the products’ quality,
generation of shrinkage porosities should be prevented by optimizing casting conditions such as cooling rate, temper-ature gradient, casting pressure and so on. In the case of conventional aluminum alloy castings, generation of shrink-age porosities is considered due to the lack of molten alloy
which needed to complement the solidification shrinkage.
Consequently, several modeling methods, such as temper-ature gradient method8) and G=pffiffiffiffiR method,9) have been
proposed to find a critical condition for generation of
shrinkage porosities. In order to find the critical conditions practically, it is necessary to accurately determine parameters such as temperature gradient (G), solidification velocity (V) and cooling rate (R) at solid/liquid interface in solidification. However, in die casting process, it is difficult to measure
these parameters directly by using thermocouples, because molten alloy is injected with high pressure and cooled rapidly by water-cooled die. Therefore, prediction studies based on computational numerical simulations are usually adopted as an alternative method. In this case, the accuracy of simulation results should be adequately verified. A useful verification
method is to estimate solidification time by measuring
secondary dendrite arm spacing (2) of die cast sample
metallographically, and then to compare the results with
simulated one. However, the relationship between 2 and
solidification time10)has not been studied sufficiently, even JIS-ADC12 which is the most popular commercial alloy for die casting.
In this study, we conducted a unidirectional solidification examination for JIS-ADC12 alloy to clarify solidification sequence and development of primary dendrites and eutectic structures. In addition, the pressure resistance parts of JIS-ADC12 alloy was made by using die casting process, and thermal diffusivity such as isothermal diagrams versus time in die casting process were drawn with computational numerical simulations. The accuracy of simulations was verified by comparing simulated solidification time with empirically estimated solidification time from 2. Further-more, variation of solidification parameter G=pffiffiffiffiR in simu-lated thermal field was compared to actual distribution of shrinkage porosities. Finally, critical conditions of shrinkage porosity generation in die cast JIS-ADC12 alloy were evaluated.
2. Experimental Procedure
Chemical composition of commercial JIS-ADC12 alloy used in this study is listed in Table 1. Si content reached 11.5 mass%(hereafter mass%is abbreviated to%) which was almost AlSi eutectic composition. In addition, the effective
alloying elements such as 2.27% of Cu and 0.15% of Mg
+This Paper was Originally Published in Japanese in J. Japan Foundry
Engineering Society84(2012) 375382.
were used to improve thermal resistance and aging ability. First, crystallization and eutectic temperatures of JIS-ADC12 alloy were clarified with a differential thermal analyzer (DTG-60, Shimadzu Co. Ltd., Japan). The sample of 20.2 mg was set in an alumina container and heated at 30 K/min to 923 K with flowing N2 gas at 300 ml/min, and then it was
cooled at 3 K/min. The crystallization process was evaluated by measuring temperature difference between this sample and
reference sample (Al2O3) with thermocouples. Obtained
crystallization temperatures were evaluated by the results from unidirectional solidification process.
Microstructural development was characterized by unidi-rectional solidification technique with vertical Bridgman-type equipment which is illustrated in Fig. 1. The equipment consists of three main parts; electric furnace having soaking area of 400 mm in length, water cooling zone and driving mechanism. The sample with diameter of 4 mm and length of 150 mm was inserted into the high purity alumina tube with inside diameter of 5 mm and outside diameter of 8 mm. Inside of alumina tube was vacuumed to a few Pa by rotary pump, and thenfilled with argon gas at 1 atm. The sample was set in electric furnace, and then the upper part was heated and held at 973«0.5 K in the furnace, and the lower part was cooled by water. Temperature gradient (G) was controlled at 10.3
K/mm in the temperature range 826 to 856 K, which was
revealed as the massy zone temperature by DTA, the sample was pulled down with constant velocity (V) of 0.02, 0.12 and
0.5 mm/s by driving mechanisms and stepping motor. These solidification conditions were established to make the value ofG/Vchange drastically from 21 to 515 Ks/mm2, as shown in Table 2. Finally, in order to observe microstructure of solidification interface, solidifying samples were quenched by the abrupt change of pulling speed up to 40 mm/s during the experiments. Longitudinal cross-sections of specimens were mirror-polished by alumina powders of 3 µm in diameter and diamond paste of 1 µm in diameter and etched
with 0.5% HF aqueous solution, and observed
metallo-graphically. The secondary dendrite arm spacing (2) was measured 5 times to get an average value in each sample via the secondary dendrite arm spacing method.
On the other hand, die casting test was conducted by using die of compressor parts and 350 t cold chamber die casting machine, as illustrated in Fig. 2. The casting conditions were as follows: molten metal temperature of 938«3 K, plunger
speed for injection of 2.3 m/s and casting pressure of
80 MPa, as listed in Table 3. Cross-section of part A in the cast sample, which is illustrated in Fig. 2(b), was polished and etched with 0.5 HF aqueous solution, followed by the micro structural observation with optical microscope and measurement of2with the method previously outlined.
[image:2.595.87.258.79.422.2]Furthermore, in order to evaluate solidification behavior during die casting process, the variation of temperature distribution during solidification process was simulated by commercial software (Flow3D, ver.9.4.1) with physical
Table 1 Chemical compositions of alloy (mass%).
Cu Si Mg Zn Fe Mn Ni Ti Pb Sn Cr
2.27 11.5 0.15 0.86 0.82 0.15 0.09 0.04 0.08 0.02 0.03
[image:2.595.311.546.100.293.2]Fig. 1 Schematic illustration of the unidirectional solidification equipment.
Table 2 Unidirectional solidification tests condition.
No.
Furnace temperature,
T(K)
Temperature gradient,
G(K/mm)
Solidification rate,
V(mm/s)
Cooling rate,
R(K/s)
G/V
(Ks/mm2)
1 973 10.3 0.50 5.2 20.6
2 973 10.3 0.12 1.2 85.8
3 973 10.3 0.02 0.2 515
(a)
(b)
A
[image:2.595.308.547.360.436.2]Fig. 2 Appearance view of die cast sample (a), and magnified cross section of evaluated portion pointed out by arrow A (b).
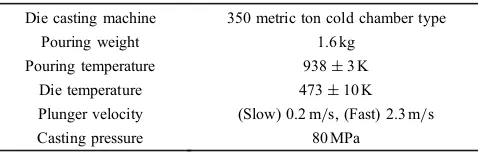
Table 3 Conditions of die casting test.
Die casting machine 350 metric ton cold chamber type
Pouring weight 1.6 kg
Pouring temperature 938«3 K
Die temperature 473«10 K
Plunger velocity (Slow) 0.2 m/s, (Fast) 2.3 m/s
characteristics listed in Table 4. Additionally, the growth of primarily dendrites was observed to be completed at the temperature of multi-component eutectic reaction start (AlSi eutectic finish). Thus, it was assumed that solid fraction of primary dendrites increase linearly from liquidus temperature to multi-component eutectic start temperature in the computa-tional simulation.
3. Results and Discussion
3.1 Analysis of solidification process sequence with DTA Figure 3 shows differential thermal analysis curve during cooling process at the rate of 3 K/min. Here, vertical axis indicates electromotive force (¦E[®V]), which is represented by temperature difference between this sample and reference. Analysis curve of this alloy reveals three kinds of exothermic reaction. Therefore, exothermic onset and offset temper-atures, which are indicated by arrows “a”“d”, were determined by detailed thermodynamic analysis. That is to say, the start and finish temperatures of each crystallization
can be clarified by replacement¦E by logarithmic function of (¦E¦Eb), where¦Ebis base line.11)
Figures 4 and 5 show the variation in log(¦E¦Eb) in
temperature range 840 to 870 K and 780 to 840 K, respectively. As shown in Fig. 4, log(¦E¦Eb) increases
almost linearly with decreasing temperature at liquid state condition, but increases sharply at 856 K, as indicated by
arrow “a”. This sudden change could correspond to the
beginning of release of latent heat in primary alpha solidification, that is, liquidus temperature of alpha dendrite is estimated at 856 K.
[image:3.595.309.542.73.296.2]In the lower temperature range, a remarkable exothermic reaction peak can be recognized at around 830 K in Fig. 3. Thus, the crystallization is estimated to start at 838 K by the extrapolation technique as shown by arrow “b”. Since
Table 4 Physical characteristics used for solidification simulation.
ADC12
Liquidus temperature 856 K
Multicomponent eutectic temperature 826 K Latent heat of fusion 389 kJ/kg Liquidus specific heat 1084 J/kgK Solidus specifc heat 963 J/kgK Liquidus density 2660 kg/m3
Solidus density 2800 kg/m3
Liquidus thermal conductivity 103 W/mK Solidus thermal conductivity 96 W/mK
Mold
Specific heat 502 J/kgK
Density 7700 kg/m3
Thermal conductivity 30 W/mK
b
c
a
d
Eb
Δ
Fig. 3 Differential thermal analysis curve of sample.
0.50 0.52 0.54 0.56 0.58 0.60 0.62 0.64 0.66
840 845 850 855 860 865 870
Temperature, T /K
Log (
E
Δ
−Δ
Eb
)
a
Fig. 4 Logarithmic analysis of DTA result (T=840870 K).
0.0 0.5 1.0 1.5 2.0 2.5
780 790 800 810 820 830 840
c
d
Temperature, T /K
Log (
Δ
E
−Δ
Eb
)
[image:3.595.48.292.83.230.2] [image:3.595.51.295.172.493.2] [image:3.595.311.543.337.570.2]chemical composition of present sample is close to AlSi eutectic composition and AlSi eutectic structure occupies
about 80% in volume fraction as mentioned later, this
exothermic reaction may be AlSi eutectic crystallization. In the lower temperature range of large peak of this exothermal reaction, the inflection temperature is recognized at 826 K
indicated by arrow “c” in Fig. 5. Since many alloying
elements such as Cu, Mg, Zn, etc. are contained in addition to Si in this alloy, 826 K could correspond to beginning of the exothermic reaction due to crystallization of
multi-component eutectic phase after AlSi eutectic reaction.
Finally, log(¦E¦Eb) vs. temperature curve stabilized again
at 801 K indicated by arrow“d”, that means multi-component eutectic reaction was finished at 801 K.
[image:4.595.71.527.76.294.2]3.2 Unidirectional solidification structures
Figure 6 presents typical longitudinal section of uni-directionally solidified sample at the constant velocity (V) of 0.12 mm/s. Solidified microstructure of the samples is composed of the primary¡dendrite and an amount of several
eutectic structures in interdendritic region. Since fine
dendrites are recognized around area “a”, this region could be liquid state until just before quenching. The primary dendrites seem to grow from position “A”, and are well-developed parallel to the heatflow direction. Meanwhile, the coarse AlSi eutectic structure is observed in the interden-dritic region of area “b”, and it has the irregularity of solid/liquid interface. Its volume fraction seems to increase gradually as solidification proceeds, and at position“B”the eutectic structure covers almost all area among the secondary
dendrite arms. Thus, AlSi eutectic finished growing at
position “B”. Secondary dendrite arm also obviously tends to coarsen as the distance from the dendrite tip. Therefore,
secondary dendrite arm spacing (2) measurements were
performed along to primary dendrite trunk, and2variation was summarized in Fig. 7. In this figure, positions marked “A”“C” and areas “a”“d” correspond to the locations indicated in Fig. 6. As shown in Fig. 7, there is almost
no variation in secondary dendrite arm spacing at the right side of position “B”. Consequently, the primary dendrite,
AlSi eutectic structure and liquid could exist in the
marked area from position “A” to “B”, and the primarily dendrite and AiSi eutectic structure start to grow around position “A”and area “b”, respectively, then both of them stop growing around position “B”. Considering this micro-structural development corresponds to the result of DTA, temperatures of dendrite tip (position“A”) and crystallization of AlSi eutectic (position“b”) concluded as 856 and 838 K, respectively.
Finally, crystallization of multi-component eutectic seems to start around position “B” and multi-component eutectic structure is clearly recognized among dendrite arms and Al Si eutectic structures from area“c”to the lower temperature
(a)
(b)
(c)
(d)
Solidification direction
b
d
a
c
A
B
C
100µm 500µm
Fig. 6 Microstructures of longitudinal section of uni-directionally solidified sample (No. 2,V=0.12 mm/s).
0 5 10 15 20 25
0 1 2 3 4 5 6 7 8 9 10
a
b
c
d
A
B
C
Distance, d/mm
Secondary dendrite arm spacing,
λ2
/
μ
m
[image:4.595.314.540.333.555.2]area. Thus, AlSi eutectic structure finishes growing and multi-component eutectic structure generates around position “B”, and which could be corresponding 826 K indicated by arrow“c”in Fig. 5. From the comparison with DTA analysis (Fig. 5) and unidirectional solidification microstructure (Fig. 6), it is presumed that multi-component eutecticfinishes growing, that is, solidification completes, at position “C”in Fig. 6 at 801 K by calculation from distance and temperature gradient.
3.3 Coarsening of dendrite arm
As mentioned in Fig. 7, secondary dendrite arm coarsens as solidification proceeds until generation of multi-compo-nent eutectic structures. Figures 8(a) and 8(b) show longi-tudinal sections of unidirectional solidification samples at the
velocity of 0.50 and 0.02 mm/s, respectively. Secondary
dendrites of 0.02 mm/s sample are developed larger than
that of 0.50 mm/s sample. Thus, relationship between 2
and local solidification time is summarized in Fig. 9. In
the present study, 2 were measured in the area of
multi-component eutectic growing, because primary dendrite
finishes growing and outline of secondary dendrite arm can be clearly observed. Local solidification time is defined as the time interval between initiation of primary dendrite and multi-component eutectic structure. The coarsening theory of
2in casting process12)is well known, and based on driving force due to the difference in curvature of secondary dendrite arm. The relationship between 2 and local solidification is expressed in eq. (1). In this equation, exponentnis known to be close to 1/3 regardless of the kind and the amount of alloying elements.13)
2¼A¿fn ð1Þ Where,2is secondary dendrite arm spacing [µm], and¿f is local solidification time [s]. The relationship between2and
¿fin present study can be expressed as in eq. (2), as shown in Fig. 9,
2¼6:45¿f0:31 ð2Þ 0.31 of the exponent n is calculated, and is close to the value reported by Mori et al.14) Besides, the relationship between cooling rate (R), which is defined as the temperature difference between liquidus line and multi-component reaction start point divided by local solidification time, and
2is expressed as eq. (3) in the present condition.
2 ¼18:2R0:31 ð3Þ
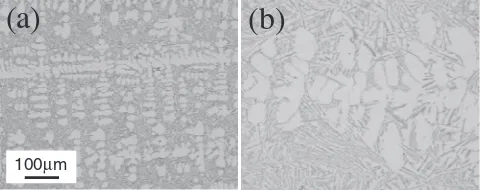
3.4 Microstructures of die cast sample
Figure 10 shows the typical cross-sectional microstruc-tures of die cast sample produced by the conditions in Table 3. Several analyses by optical microscope revealed that some casting defects such as porosities are introduced in parts, which are relatively thicker than other parts of the sample as shown at part “A” of Fig. 2(a). Porosities are hardly observed just below the surface, but many porosities of more than 200 µm size in diameter are recognized at the depth of more than 3.2 mm. Thus, analysis by the scanning electron microscope was carried out on the porosities. Dendrite structure is clearly revealed at the surface of every porosity as shown in Fig. 10. That indicates that this porosity is shrinkage one which was introduced due to the lack of feeding of molten metal at solidification process. Besides, the equiaxed primary dendrites observed at parts
cf, and no directionality is recognized whereas molten
metal is directionally solidified from surface toward inside
of the part. Dendrite structure of solidified sample was
relativelyfine in the vicinity of surface, and become coarser with an increase in depth. Figure 11 shows the relationship
between 2 variation and distance from surface into the
center of part “A” in die cast sample. Average secondary arm spacing of 4 µm is measured at the depth of 0.25 mm from the surface. Considering that eq. (3) presents the relationship between the cooling rate (R) and substituting
2, more than 60 K/s and 1020 K/s of cooling rate are estimated at the depth of 0.5 mm and at the center of the section, respectively.
3.5 Computational numerical simulation of solidifi ca-tion in die casting process
Since the introduction of casting defects including porosities could depend on the thermal diffusivity and other solidification conditions, temperature distribution in die casting process was predicted by computational numerical simulation. Figure 12 shows calculated temperature
distri-(a)
(b)
100μm
Fig. 8 Microstructures of longitudinal section of uni-directionally
solidi-fied samples during multicomponent system eutectic reaction (a) No. 1, V=0.50 mm/s (b) No. 3,V=0.02 mm/s.
1 10 100
1 10 100 1000
Local solidification time, θf/s
Secondary dendrite arm spacing,
λ2
/
μ
m
[image:5.595.49.290.71.166.2] [image:5.595.312.542.73.286.2]bution with temperature contours at the time of 0.20 s after the infiltration of molten metal. Temperature contours show almost parallel to the surface, which indicates that the solid/ liquid interface unidirectionally progress from the surface toward the center along the x-axis. In order to clarify the sequence of temperature distribution, one dimensional representation of temperature variation from the point of (x,z)=(0,0) along thex-axis in Fig. 12 is adopted as shown
in Fig. 13. Immediately after infiltration, temperature of molten metal was higher than liquidus line (856 K) in most parts of the sample deeper than 0.6 mm, and then decreased from the sample surface. For example, the temperature
of 1 mm depth decreases to 838 K (where AlSi eutectic
[image:6.595.71.526.67.367.2]reaction starts) in about 0.51 s, and decreases to 826 K (where multi-component eutectic reaction starts) in about 1 s. But cooling velocity is generally high in die casting, and even at 4 mm depth, which is the center of specimen, temperature reaches 826 K in about 2.5 s. Figure 14 presents the passing time which refers to a period of time required for the temperature to reach the liquidus line (856 K) and
Fig. 10 Cross-sectional microstructures of die cast sample (a), and shrinkage porosity by scanning electron microscope (b). (c) (d) (e) and (f ) Optical microscope photos.
0.0 2.0 4.0 6.0 8.0 10.0
0.0 1.0 2.0 3.0 4.0
Distance from surface, x /mm
Secondary dendrite arm spacing,
λ2
/
μ
m
[image:6.595.53.286.415.647.2]Fig. 11 Distribution of secondary dendrite arm spacing in die cast sample.
[image:6.595.358.496.421.596.2]multi-component eutectic temperature (826 K) along x-axis in Fig. 12. That is, solidification velocity of primary alpha dendrite tip and eutectic phases can be estimated. Tip of dendrite moves very fast and reaches the position of x=1 and 4 mm (center of the sample) in about 0.2 and 0.5 s
as shown by solid line in the figure. On the other hand,
multi-component eutectic structure solidifies at relatively
slow velocity of 0.6 mm/s until 1.5 mm depth, and then
solidifies at 4.5 mm/s until the center of the sample as shown in broken line. If we suppose that time interval between solid line and broken line indicates local solid-ification time ¿f, the variation of calculated ¿f against the
each position onx-axis is summarized in Fig. 15. The value of ¿f results in 0.1 s in the vicinity of sample surface, and then gradually increases until the 1.5 mm depth. Finally ¿f keeps constant at about 1.5 s, that indicates similar
solid-ification microstructure would be obtained from 1.5 mm
depth to the center of the sample. The values of ¿f are
estimated by2in Fig. 11 and eq. (2), and also plotted in this
figure. Computational simulation results could be in good
agreement with the experimental data. That indicates the solidification behavior of the JIS-ADC12 alloy in die casting process can be predicted with the numerical simulation accurately, even with rapid solidification due to water-cooled die and high pressure conditions.
3.6 Optimization of solidification parameter in die casting process
In order to figure out the solidification behavior in die casting process, the basic properties of temperature gradient G(K/mm), solidification velocityV(mm/s) and cooling rate R (K/s) should be fully-clarified in the process. If two of them are detected, last parameter can be deduced by the
relationship,R¼GV. However, these values move
depend-ing on the focused time and temperature contour curve, as shown in Fig. 12 and Fig. 13. Thus, it may be necessary that the proper solidification parameters are occasionally confi g-ured by computational simulation. Regarding the movement of temperature contour curves as dendrite and eutectic growth, three cooling rates (R) passing through 848, 838
and 828 K in the massy zone were evaluated. R was
calculated from G and V at each location, and compared
with the average cooling rate from 856 K through 826 K. As shown by filled circle in Fig. 16, the average cooling rate is about 60 K/s atx=0.5 mm followed by the decrease with an increase in the depth, and becomes about 2030 K/s at deeper than 1 mm. Cooling rate calculated by focusing on 848 K contour curve shows a significantly higher level than that of the average cooling rate in almost every position,
t= 0.08s
t= 0.51s
t= 1.0s
t= 1.5s
t= 2.5s 826K
t= 2.0s 838K
Distance from surface, x /mm
T
emperature,
T
/K
[image:7.595.50.292.70.298.2]856K
Fig. 13 Calculated temperature distribution at several time alongx-axis in Fig. 12.
0.0 0.5 1.0 1.5 2.0 2.5 3.0
0.0 1.0 2.0 3.0 4.0
T= 856K
T= 826K
Distance from surface, x /mm
Passing time of temperature contour line,
t
/s
Fig. 14 Elapsed time of temperature contour curve at 856, 826 K along x-axis in Fig. 12.
0.01 0.10 1.00 10.00
0.0 1.0 2.0 3.0 4.0
Experiment Simulation
Distance from surface, x /mm
Local solidification time,
θf
[image:7.595.313.544.72.294.2]/s
[image:7.595.53.289.356.591.2]as shown by the triangle symbol. The value of 174 K/s is, particularly, estimated at a depth of 0.5 mm. Cooling rate calculated by focusing on 828 K contour curve shows exactly the opposite in the average cooling rate as indicated by the square. Cooling rate is estimated more than 20 K/s at deeper than 1.5 mm, while the sample is insufficiently cooled at a depth of 0.9 mm. Meanwhile, cooling rate calculated by focusing on 838 K contour curve shows a good agreement with the average cooling rate. As shown in Fig. 3, 838 K corresponds to AlSi eutectic reaction starts temperature. Since AlSi eutectic growth covers almost all of the latent heat of solidification and influences the thermal diffusion
field of this alloy, cooling rate at 838 K could agree with the average cooling rate.
Finally, temperature gradient (G), solidification rate (V) and Niyama parameter G=pffiffiffiffiR,15) calculated by focusing on 838 K contour curve, were summarized in Fig. 17. Maximum
G of 33 K/mm is shown near the surface, and then G
gradually decreases and becomes 5 K/mm atx=4 mm deep. V is estimated 2 mm/s near the surface, and reduces to a
minimum value of 0.9 mm/s at x=1.5 mm, followed by a
gradual increase with the depth, and then becoming 4.2 mm/s at x=4 mm deep. Therefore, G=pffiffiffiffiR results in maximum values of 3.74.0 at 1.5 mm deep from surface, and then falls to 1.0 K0.5s0.5/mm at the center of die cast sample. As shown
in Fig. 10, shrinkage porosities were hardly observed near the surface, and those of over 200 µm size were only appeared at deeper than 3.2 mm. Therefore, it can be concluded that the critical condition ofG=pffiffiffiffiR, where larger than 200 µm size shrinkage porosities were recognized, was 1.4 K0.5s0.5/mm in the present die casting condition.
4. Conclusions
In order to optimize of solidification microstructures and eliminate casting defects in the JIS-ADC12 alloy die casting
process, unidirectional solidification and actual die casting experiments were performed, and experimental results were evaluated with the numerical simulation in detail. The obtained results are shown as follows,
(1) Temperatures of liquidus line, AlSi eutectic crystal-lization and multi-component eutectic crystalcrystal-lization of commercial JIS-ADC12 alloy are concluded to be 856, 838 and 826 K, respectively. Solidification completion temperature in which the multi-component eutectic is complete can be decided as 801 K.
(2) Primary alpha dendrites are clearly observed in the unidirectionally solidified samples under the conditions
of temperature graduation G of 10.3 K/mm,
solid-ification velocityVof 0.020.50 mm/s and cooling rate R of 0.25.2 K/s. The relationship between 2 and ªf is described as in following equation,2¼6:45ª0f:31. (3) Primary alpha dendrites are also observed in die cast
sample. Average cooling rate estimated by 2 is more than 60 K/s at 0.5 mm deep and 1020 K/s around the center of the sample.
(4) Temperature distribution calculated based on 838 K contour curve in die cast sample shows good agreement with the average cooling rate estimated by 2.
(5) Computational numerical simulation revealed that solidification parameter G=pffiffiffiffiR increases near the surface in die cast sample, where shrinkage porosities were hardly observed. The critical condition ofG=pffiffiffiffiR, which leads to the generation of larger than 200 µm size shrinkage porosities, was estimated to 1.4 K0.5s0.5/mm.
Acknowledgments
This work was supported by Japan Society for the Promotion of Science (JSPS) KAKENHI (Grant-in-Aid for Young Scientists (B) 23760714, Grant-in-Aid for Scientific Research (B) 22360315 and Grant-in-Aid for Exploratory Research 23656480).
0 40 80 120 160 200
0.0 1.0 2.0 3.0 4.0
Distance from surface,
x
/mmCooling rate,
R
/Ks
–1
Average cooling rate 848K
[image:8.595.52.286.68.298.2]838K 828K
Fig. 16 Cooling rates calculated based on various temperature contour curves.
0.0 2.0 4.0
0.0 1.0 2.0 3.0 4.0
0.0 2.0 4.0 10 20 30 40
,K
0.5
s
0.5
/mm
V
,mm/s
G
,K/mm
R
G
/
[image:8.595.307.545.71.289.2]Distance from surface, x /mm
REFERENCES
1) H. Iwahori, K. Tozawa, Y. Yamamoto and M. Nakamura:J. JILM34
(1984) 389394.
2) H. Iwahori, K. Tozawa, T. Asano, Y. Yamamoto, M. Nakamura, M. Hashimoto and S. Uenishi:J. JILM34(1984) 525530.
3) I. Murashima, A. Ishikawa, H. Sasaki and N. Nishi:J. JILM49(1999) 487492.
4) T. Momono and K. Ikawa: J. JFS61(1989) 895900. 5) Y. Shinada, Y. Ueda and K. Taki: J. JFS61(1989) 920925. 6) Y. Shinada, Y. Ueda and K. Taki: J. JFS61(1989) 926931. 7) K. Chijiiwa and R. Ozaki: Kokusai Imono Kekkan Bunnrui Zushu,
(Japan Foundry Society, 2004) pp. 143148.
8) I. Onaka:Computer Dennetsu Gyouko Kaiseki(Fundamental analysis
of heat transfer and solidification by Computer), (Maruzen, 1985) pp. 212215.
9) E. Niyama, T. Uchida, M. Morikawa and S. Saito: AFS J. Int. Cast Metals54(1982) 507.
10) A. Kamio:J. JILM31(1981) 136147.
11) The Chemical Society of Japan:Shin Jikken Kagaku Kouza 2 Kiso
Gijutsu 1, (Maruzen, 1997) pp. 9596.
12) T. Z. Kattamis, J. C. Coughlin and M. C. Flemings: Trans. Met. Soc. AIME239(1967) 1504.
13) The Japan Institute of Metals:Chuzo Gyoko, (Maruzen, 1992) pp. 99 102.
14) N. Mori, K. Ogi and K. Matsuda: J. Japan Inst. Metals40(1976) 406 411.