Munich Personal RePEc Archive
Pervasive bullying and its negative
consequence on standardized tests of
Reading, Science and Mathematics – A
comparative analysis of three countries in
Sub-Saharan Africa
Kibriya, Shahriar and Zhang, Yu and Anton-Erxleben,
Katharina and Naureen, Fatema
Center of Conflict and Development, Texas AM University, US
Agency for International Development, McGill University, Montreal
Canada
30 December 2016
Online at
https://mpra.ub.uni-muenchen.de/81117/
Pervasive bullying and its negative consequence on standardized tests of Reading, Science
and Mathematics – A comparative analysis of three countries in Sub-Saharan Africa
Authors: Shahriar Kibriya, Yu Zhang, Katharina Anton-Erxleben and Naureen Fatema
Authors’ affiliation and full address:
Shahriar Kibriya: Center on Conflict and Development, Texas A&M University, 600 John Kimbrough Blvd, College Station, TX 77843
(Email: [email protected]. Tel: +1 979 204 7890).
Yu Zhang(corresponding author): Institute of Economics and Finance, Nanjing Audit University. (Email:[email protected])
Katharina Anton-Erxleben: Raising Voices, Kampala Uganda.
Naureen Fatema: McGill University, Montreal Canada.
Abstract: School bullying is a common yet unfortunate occurrence associated with several
hindering outcomes for children’s educational and psychological development. Using a
nationally representative data sample of 26,467 students from three sub-Saharan African countries of Ghana, Botswana and South African, we investigate the prevalence of bullying and
its ramification on students’ academic performance. The data reveals that more than 50% of the
survey participants were bullied regularly in school. We employ a Propensity Score based matching technique to estimate the effect of bullying of their performance on standardized reading, mathematics and science tests. The results of our estimation reveal statistically significant decreases due to bullying in scores on all three types of standardized evaluations between 3% to 8% for all three countries.
Acknowledgements: This research was funded and commissioned by the United States Agency for International Development (USAID). Subsequently, a longer version of the study was submitted to USAID as a report. We are grateful to the Africa Education Office, USAID,
Pervasive bullying and its negative consequence on standardized tests of Reading, Science
and Mathematics – A comparative analysis of three countries in Sub-Saharan Africa
1. Introduction:
Bullying in and around educational settings is a global phenomenon. Bullying can be physical,
verbal, or relational, which refers to children being systematically excluded from social activities
by their peers (Olweus, 1993). Most Current estimates by the non-governmental organization
Plan International suggests that around 20% of the global student population is affected by
bullying (Greene et al., 2013). A few recent studies from countries of Europe, South America
and USA have shown that bullying can lead to school avoidance and poor attendance, inability to
concentrate, negative attitudes, lack of academic engagement, depression and reduced
self-esteem, and even physical health problems (e.g. Ammermueller 2012; Brown & Taylor 2008;
Eriksen et. al 2012; Ponzo 2013; Hazel, 2010; Ouellet-Morin et al., 2011). However, for African
countries the only previous research on bullying and its negative consequence have been
documented for a gender based study of Ghanaian 8thgrade mathematics students’ (Kibriya et al.
2016). In this research note, we extend on the previous knowledge and generate new evidence of
pervasiveness of bullying and its negative consequences through an extensive comparative
analysis of standardized Reading, Mathematics and Science tests administered on 4th and 8th/9th
grade students in Ghana, Botswana and South Africa using a nationally representative data
sample of 26,467 students.
2. Data
We construct a large data set from two international assessments, the Trends in Mathematics and
Sciences Study (TIMSS) and the Progress in Reading and Literacy Study (PIRLS), conducted in
2011 by the International Association for the Evaluation of Educational Achievement (IEA).
These include assessments of students’ reading, math, and science skills and knowledge as well
2.1 Participants
The PIRLS and TIMSS use nationally representative samples of students in the fourth and eighth
grade in Botswana, Ghana, and South Africa. 3,108 participants are analyzed for reading
performance, 7,807 for math, and 15,552 for science. (The same students from each grade are
surveyed for math and science performance) Ninth grade students participated in the TIMSS in
Botswana and South Africa. In Botswana and South Africa, the pre-PIRLS, an easier and shorter
version of the PIRLS, was administered. All students and their associated schools were randomly
chosen.
2.2 Measures
Student achievement in reading, math, and science is reported on a scale of 0 to 1000 with
typical scores in the range of 300 to 700. Experiences of bullying were measured through the
Student Questionnaire. The “Students Bullied at School” scale was constructed from students’
responses to the following six items:
a) I was made fun of or called names
b) I was left out of games or activities by other students
c) Someone spread lies about me
d) Something was stolen from me
e) I was hit or hurt by other student(s) (e.g., shoving, hitting, kicking)
f) I was made to do things I didn’t want to do by other students
Response options were: “At Least Once a Week,” “Once or Twice a Month,” “A few times a
year,” or “Never.” From these responses, three categories of bullying frequency were created:
“About Weekly”, “About Monthly”, and “Almost Never.” Students bullied “Almost Never” reported never experiencing at least three of the six bullying behaviors and each of the other
three behaviors “a few times a year,” on average. Students bullied “About Weekly” reported experiencing each of three of the six behaviors “once or twice a month” (bullied 3-6 times a
month) and, in addition, each of the other three “a few times a year,” on average.
In addition to the Student Questionnaire, the Home Questionnaire (completed by parents or legal
and Curriculum Questionnaire provide relevant information about other variables that may
influence performance, including school resources, instructional approaches, teacher
characteristics, student attitudes, and home support for learning.
3. Data Analysis Method
“Bullied weekly,” a binary variable, is used as the key explanatory variable for the analysis presented. To obtain un-confounded estimates, we control for school specific characteristics;
students’ age, and sex; teachers’ age, sex, and experience; parents’ income and education, and facilities available to students at home. The propensity score in this experimental setting is the
probability of a unit (i.e., a student) being assigned to a treatment (i.e., being bullied weekly),
given a set of observed covariates. This approach, proposed by Rosenbaum and Rubin (1983),
solves the ‘curse of dimensions’ by combing all confounders into a single propensity score, and
matches observations based on the score. Thus we are able to identify the influence of bullying
by comparing the average difference in academic performance between the group of students
who are bullied and the matched sample of students who had a similar chance of being bullied,
based on their other observed covariates, but are not actually bullied (Abadie and Imbens, 2016;
Rosenbaum and Rubin, 1983). We obtain the average treatment effect on the treated (ATT). To
formally define the ATT, we define two potential outcomes. 𝑌0𝑖 is the academic performance (in
this case, test score) for individual i if he or she is not treated (i.e. bullied) and 𝑌1𝑖 is the value of
the outcome variable for individual i if he or she is treated. The ATT is given by
E[(Y1i−Y0i)|T=1].
4. Results and Discussion:
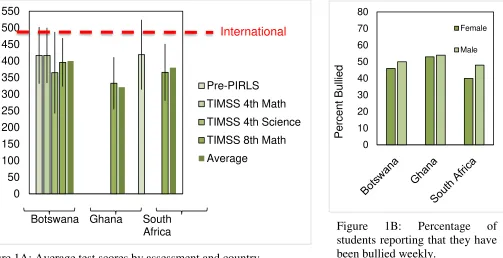
Figure 1A shows the average test scores for each country and each discipline. Considering that
that the international average is 500 points (source: PIRLS and TIMSS) and the low international
benchmark is 400 points (source: PIRLS and TIMSS), we confirm that academic performance in
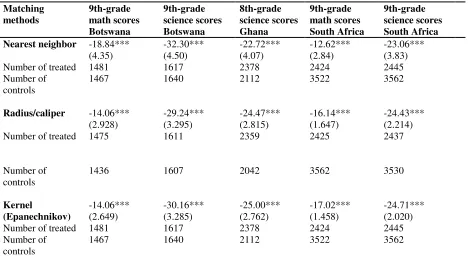
the three countries is not up to international standards. Figure 1B shows the percentage of
students who were bullied weekly, disaggregated by sex. The figure shows that bullying is
widespread in all three countries, with around 50% of the students reporting regular experiences
[Figure 1 here]
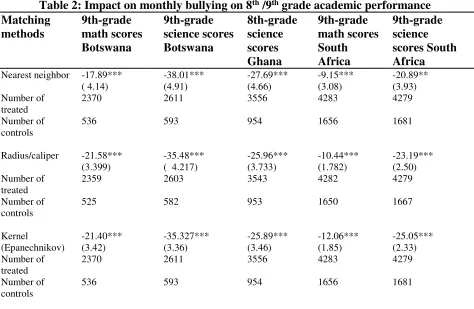
Following, we estimate the possible negative impact of “bullied weekly” on standardized
reading, mathematics and science tests. We implement three matching algorithms: nearest
neighbor, radius, and kernel (Caliendo & Kopeining, 2008; Imbens, 2015). Table 1 summarizes
the results of bullying on 4th graders performance in pre-PIRLs (reading), mathematics and
science tests for Botswana and pre-PIRLS (reading) test scores in South Africa with the three
matching algorithms. In terms of the direction of effect, both countries show consistent and
significant negative effects of bullying for the tested disciplines. The magnitude of this impact is
highest for South African students’ reading scores with a decrease around 24.51 points on
average, while lowest is for mathematics exams in Botswana with 12.37 points decrease on
average. Reading and Science scores of Botswanan students’ exhibit an average decrease of
13.49 and 13.67 respectively across the three matching methods. The negative impact for 4th
grade students is almost equal for all subjects in Botswana implying that the effect is robust and
consistent across all disciplines.
[Table 1 here]
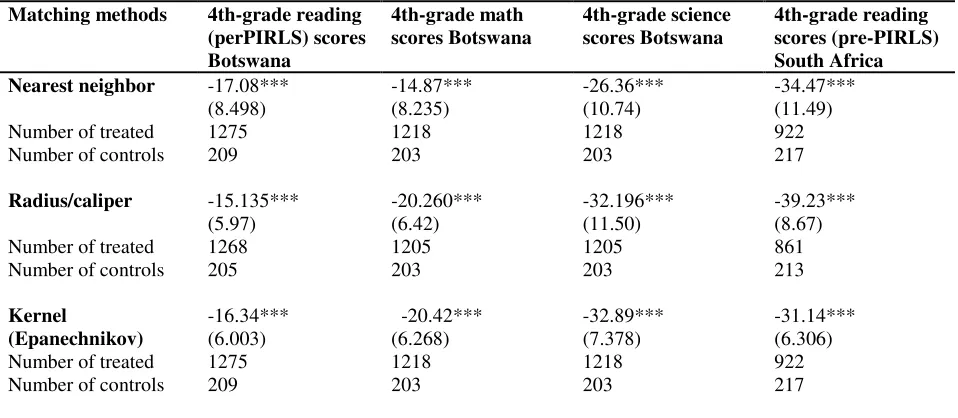
Table 2 summarizes the results of bullying on 8/9th graders performances on math and
science exams for Botswanan, Ghanaian and South African students. The results show
statistically significant negative effect of bullying across all three countries and matching
algorithms in both of the disciplines. However, unlike 4th grade students, 8th/9th grade bullied
students are more sensitive towards science scores than mathematics scores. The average score
decrease in science exams are 30.53, 24.06 and 24.06 for Botswana, Ghana and South Africa
respectively. Math scores decreased an average of 15.65 and 13.49 for Botswanan and South
African students. Botswanan students were the most affected by bullying at school and also had
the highest discrepancy levels between mathematics and science scores.
To summarize our results, at an average score of 400 points, the effects of bullying
correspond to a 3% to 8% decrease in performance and are consistent across all countries,
monthly” variable and showed similar results. The impact of “bullied monthly” is provided in the online appendix.
[Table 2 here]
5. Conclusion:
The determinants of in-class performance depend on a myriad of quantitative and qualitative
factors. While we remain cautious to claim causality, our efforts at least establish consistent,
strong, negative consequences of bullying on academic performance in various disciplines across
sub-Saharan Africa with a relatively large dataset. We also provide evidence of an alarming
percentage of students being bullied and harassed in selected schools. We recommend stronger
and specific programs targeted to the reduction of bullying in African schools and expect such
REFERENCES
Kibriya, Shahriar, Zhicheng Phil Xu, and Yu Zhang. "The negative consequences of school bullying on academic performance and mitigation through female teacher participation: evidence from Ghana." Applied Economics 49.25 (2017): 2480-2490.
Abadie, A., & Imbens, G. W. (2016). Matching on the estimated propensity score. Econometrica, 84(2), 781-807.
Ammermueller, A. (2012). Violence in European schools: A widespread phenomenon that matters for educational production. Labour Economics, 19(6), 908-922.
Brown, S., & Taylor, K. (2008). Bullying, education and earnings: evidence from the National Child Development Study. Economics of Education Review, 27(4), 387-401.
Eriksen, T. L. M., Nielsen, H. S., & Simonsen, M. (2012). The Effects of Bullying in Elementary
School (No. 6718). The Institute for the Study of Labor.Greene, M., Robles, O., Stout, K. and
Suvilaakso, T., 2013. A girl’s right to learn without fear: Working to end gender-based violence at school. Woking: Plan International.
Nansel, T. R., Overpeck, M., Pilla, R. S., Ruan, W. J., Simons-Morton, B., & Scheidt, P. (2001). Bullying behaviors among US youth: Prevalence and association with psychosocial adjustment.
Journal of the American Medical Association, 285(16), 2094-2100.
Olweus, D. (1993), Bullying at School: What We Know and What We Can Do. Blackwell Publishing.
Ouellet-Morin, I., Odgers, C. L., Danese, A., Bowes, L., Shakoor, S., Papadopoulos, A. S., & Arseneault, L. (2011). Blunted cortisol responses to stress signal social and behavioral problems among maltreated/bullied 12-year-old children. Biological psychiatry, 70(11), 1016-1023.
Ponzo, M. (2013). Does bullying reduce educational achievement? An evaluation using matching estimators. Journal of Policy Modeling, 35(6), 1057-1078.
Table 1: Impact on weekly bullying on 4th grade academic performances
Matching methods 4th-grade reading (perPIRLS) scores Botswana 4th-grade math scores Botswana 4th-grade science scores Botswana 4th-grade reading scores (pre-PIRLS) South Africa Nearest neighbor -16.22***
(5.60) -14.09** (6.32) -15.04* (9.01) -24.52*** (9.01)
Number of treated 862 844 844 575
Number of controls 951 954 954 720
Radius/caliper -12.48*** (4.64) -11.11*** (3.37) -11.90* (6.46) -25.52*** (6.28)
Number of treated 834 827 827 562
Number of controls 947 948 948 680
Kernel (Epanechnikov) -11.79*** (3.90) -11.93*** (3.46) -14.13*** (5.04) -23.52*** (4.34)
Number of treated 862 844 844 575
Number of controls 951 954 954 720
*,**,*** denotes significance levels at 10%, 5% and 1% respectively. Standard errors are in parenthesis
0 10 20 30 40 50 60 70 80 P ercent B ul lied Female Male
Figure 1B: Percentage of students reporting that they have been bullied weekly.
0 50 100 150 200 250 300 350 400 450 500 550
Botswana Ghana South
Africa T est S core Pre-PIRLS
TIMSS 4th Math
TIMSS 4th Science
TIMSS 8th Math
Average
International Average
[image:9.612.68.548.324.523.2]Table 2: Impact on weekly bullying on 8th grade academic performances Matching methods 9th-grade math scores Botswana 9th-grade science scores Botswana 8th-grade science scores Ghana 9th-grade math scores South Africa 9th-grade science scores South Africa Nearest neighbor -18.84***
(4.35) -32.30*** (4.50) -22.72*** (4.07) -12.62*** (2.84) -23.06*** (3.83)
Number of treated 1481 1617 2378 2424 2445
Number of controls
1467 1640 2112 3522 3562
Radius/caliper -14.06*** (2.928) -29.24*** (3.295) -24.47*** (2.815) -16.14*** (1.647) -24.43*** (2.214)
Number of treated 1475 1611 2359 2425 2437
Number of controls
1436 1607 2042 3562 3530
Kernel (Epanechnikov) -14.06*** (2.649) -30.16*** (3.285) -25.00*** (2.762) -17.02*** (1.458) -24.71*** (2.020)
Number of treated 1481 1617 2378 2424 2445
Number of controls
1467 1640 2112 3522 3562
Appendix
Table 1: Impact on monthly bullying on 4th grade academic performances
Matching methods 4th-grade reading (perPIRLS) scores Botswana
4th-grade math scores Botswana
4th-grade science scores Botswana
4th-grade reading scores (pre-PIRLS) South Africa Nearest neighbor -17.08***
(8.498)
-14.87*** (8.235)
-26.36*** (10.74)
-34.47*** (11.49)
Number of treated 1275 1218 1218 922
Number of controls 209 203 203 217
Radius/caliper -15.135***
(5.97)
-20.260*** (6.42)
-32.196*** (11.50)
-39.23*** (8.67)
Number of treated 1268 1205 1205 861
Number of controls 205 203 203 213
Kernel
(Epanechnikov)
-16.34*** (6.003)
-20.42*** (6.268)
-32.89*** (7.378)
-31.14*** (6.306)
Number of treated 1275 1218 1218 922
Number of controls 209 203 203 217
Table 2: Impact on monthly bullying on 8th /9th grade academic performance Matching methods 9th-grade math scores Botswana 9th-grade science scores Botswana 8th-grade science scores Ghana 9th-grade math scores South Africa 9th-grade science scores South Africa
Nearest neighbor -17.89*** ( 4.14) -38.01*** (4.91) -27.69*** (4.66) -9.15*** (3.08) -20.89** (3.93) Number of treated
2370 2611 3556 4283 4279
Number of controls
536 593 954 1656 1681
Radius/caliper -21.58***
(3.399)
-35.48*** ( 4.217)
-25.96*** (3.733) -10.44*** (1.782) -23.19*** (2.50) Number of treated
2359 2603 3543 4282 4279
Number of controls
525 582 953 1650 1667
Kernel (Epanechnikov) -21.40*** (3.42) -35.327*** (3.36) -25.89*** (3.46) -12.06*** (1.85) -25.05*** (2.33) Number of treated
2370 2611 3556 4283 4279
Number of controls
536 593 954 1656 1681