ISSN: 1816-949X
© Medwell Journals, 2020
Perceptions and Experiences of Physiotherapy Students Regarding their
Academic Year Environment in a Health Sciences University in
Tshwane, Gauteng Province, South Africa
1
Karabo Raphokwane and
2Solly Matshonisa Seeletse
1Department of Physiotherapy,
2
Department of Statistics and Operations Research,
Sefako Makgatho Health Sciences University, Ga-Rankuwa Township,
1 Molotlegi Street, Pretoria, Gauteng Province, South Africa
Abstract: Sefako Makgatho Health Sciences University (SMU) is a university established in 2015 on the
Medunsa campus of University of Limpopo (UL) due to the unbundling from UL. In 2016, physiotherapy students of SMU complained about deficiencies in their academic achievements and learning. This incident inspired a study to determine perceptions and experiences of physiotherapy students towards their academic learning environment and to measure their academic performances. The study used a mix of quantitative and qualitative descriptive design. It used a questionnaire to collect data variables on student satisfaction concerning items of learning and teaching. Analysis of data depended on graphical displays and descriptive statistics. Study participants were registered SMU physiotherapy students making the total population size of 181 distributed as 47 first years, 51 second years, 39 third years and 44 fourth years. The study found a high level of discontent with teaching conduct. Various deficiencies were identified from the student’s viewpoint. The study concluded that majority of students were dissatisfied with lecturing methods, academic conduct and the entire learning environment.
Key words: Learning environment, lecturer conduct, student performance, academic performances
INTRODUCTION
The environment of learning can be detrimental to student learning if the conditions are bad or can be conducive for learning. These conditions are controlled by academic staff, support staff as well as the facilities available, among others. In the Sefako Makgatho Health Sciences University (SMU) in Tshwane, Gauteng province of South Africa, physiotherapy students over the years have hinted that their learning environments are not ideal for best student performance. Various factors the students mention which need to be improved include their lecturers, administrative staff, the facilities and the atmosphere. This study was interested in improving learning conditions of SMU physiotherapy students. For first year students who have not yet experienced the learning settings and people, the study intends to uncover their perceptions regarding the learning in physiotherapy. For senior students their experiences as physiotherapy students in SMU are required.
Study background: Students’ academic progress and
well-being are positively affected by a well conducive environment (Odole et al., 2014). Conducive learning
environments are characterised by lecture halls that are convenient, lecturers who care, effective student support and campus life that is not disruptive, among others. Physiotherapy students’ perceptions regarding their learning environment has shown to be of great importance, since it might have an effect on the academic performances. Such study was done in Malaysia and results showed that students had positive perception towards their educational environment (Veasuvalingam and Arzuman, 2014). However, campus experience also matters as it is in fact the actual happening around students’ and their studies. Bakhshialiabad et al. (2015) inform that students’ learning environment has a significant role in determining students’ academic achievement and learning.
In the year 2016, physiotherapy students at SMU complained about their academic achievements and learning environment which inspired the researchers to determine both the perceptions and experiences of physiotherapy students towards their academic learning environment.
Research context: The study determined the perceptions
of first-year students and the experiences of senior students enrolled for the bachelor of science degree in
Corresponding Author: Solly Matshonisa Seeletse, Department of Statistics and Operations Research,
physiotherapy at SMU. It aspired to determine the way first year students were affected by their perceptions of their learning environment in their studies while the senior students are investigated on their experiences over the years. It was in the spirit that the students who are the main clients in an academic enterprise should be allowed input in issues that affect them. In this instance, their learning environment is the main concern of the study. The study was undertaken with the hope that their inputs caould be useful, mainly if some of their input may be feasible and realistic.
Problem statement: The learning environment has a
significant role in determining student’s academic achievement and learning (Bakhshialiabad et al., 2015). Thus, the learning experiences occurring as a result of the environment are important determinants of students’ performances. Furthermore, according to Nahar et al. (2010), students’ perceptions of their educational environment are a useful basis for modifying and improving the quality of educational environment.
In year 2016, the director organized a meeting of school of health care sciences students of SMU, in order to address their complaints. This served as a platform for students from all the departments to present their complaints. The department of physiotherapy was among the departments with prominent students’ complaints. There seemed to be a certain negative perceptions by students regarding their learning environment. As their perceptions were also valuable, students’ experiences due to the learning environment were equally important. Consequently, the researchers were prompted to investigate the experiences and perceptions of SMU physiotherapy students regarding their academic overall learning environment and conditions that were likely to influence their performance in one way or the other in the department or SMU campus.
Purpose of the study: The study purpose was to
determine the perceptions and experiences on academic performance of physiotherapy students of their academic learning environment at Sefako Makgatho Health Sciences University. The study objectives were three-fold, to determine the students’ perceptions of their academic learning environment in SMU, to explore the experiences of students’ on their learning environment in SMU and to investigate the relationship between students’ experiences and academic performance.
Student performance
Student performance conceptualization: Students’
performances have a positive relationship with communication and guidance and a negative relationship with family stress (Mushtaq and Khan, 2012). According
to Lizzio et al. (2002), students’ perceptions is reported to be influencing learning outcomes such as academic achievement, satisfaction and development of key skills either directly or mediated through their approaches to study. The causes of poor performance of students in their studies emanate from diverse sources. The causes of the high failure rate include shortage of properly trained facilitators, inadequacy of teaching facilities, lack of funds to procure necessary equipment, poor quality of textbooks, large classes, poorly motivated facilitators, lack of laboratories and libraries, poorly coordinated supervisory activities, interference of the school system by the civil service, continual transfers of facilitators and principals, automatic promotions of learners, the negative role of public examinations on the teaching learning process and inequality in education opportunities all hamper the smooth acquisition of knowledge (Tshabalala and Ncube, 2016). Other causes are lack of student support; shortage of instructional resources for teaching; and subject content that does not fully cover the syllabus. The misconception that the subject is difficult, fear and anxiety regarding the subject, often constrain the performance of students (Attwood, 2014). These, therefore, include and imply unconducive learning environments.
Perceptions, behaviours and academic progress:
Conducive and intimidating environments: According to Oyeyemi et al. (2012), asking questions in an intimidating manner, correcting physiotherapy students in front of their patients, basing judgement on indirect evidence, not recognising extra effort of students, after-hour unavailability and setting time limits for teaching activities were identified as hindering behaviours to student performance.
Students’ academic performance is believed to be positively affected by a favourable environment. A qualitative methodology was used to conduct research to assess the perception of students in Malaysia Health Science University on their learning environment with a simple random sampling technique being used to select participants. The study revealed that a knowledgeable, motivated, skilled and an approachable lecturer who interacts socially with students and willing to re-explain to the students who miss some information during lecturing when they ask for clarity is believed to have a positive impact on students’ learning outcome (Odole et al., 2014). In the study done by Shamaki (2015), intelligence is not the only determinant of academic achievement of students. The academic achievement of students is always associated with so many, components of the learning environment. The learning environment has a great influence on students’ academic achievement.
MATERIALS AND METHODS
Research design: The study was conducted as a mix of
quantitative and qualitative descriptive designs. Quantitative methods are used to find out how much how many how often and to what extent. On the other hand qualitative methods are concerned with opinions, feelings and experiences. In this study a correlational type of quantitative design was used whereby the researchers utilized a questionnaire to collect quantitative data focusing on assessing age, the gender and students’ principles of physiotherapy test results average. This study design was used to determine the extent of a relationship between the three variables (perception, experiences and academic performance) using statistical data. This type of research was used to recognize trends and patterns in data but it does not go so far in its analysis to prove causes for these observed patterns. The data, relationships and distributions of variables were only studied. Variables from the data collected were not manipulated; they were only identified and studied as they occurred (Leedy and Ormrod, 2013). Section A of the questionnaire was also used to collect qualitative data that described the perception and experiences of participants. The Dundee Ready Educational Environment Measure (DREEM) and the self-constructed Grobler and Raphokwane (2005) questionnaire had been adapted for the study.
Table 1: Study population strata
Level of study Population Participants
1st years 47 students 19
2rd years 51 students 46
3rd years 39 students 31
4th years 44 students 21
Total 181 117
Inclusion and exclusion criteria: The initial intent was
to involve the entire 181 physiotherapy students who were registered in the physiotherapy study programmes during the year 2017. The study, however, resolved to exclude students from the study population who did not want to participate and/or refused to give consent.
Target population and sampling procedure: The
population for a study refers to all the subjects that belong to a group of items in which a researcher has interest to know and understand certain issues about it (Darawsheh and Stanley, 2014). In this study, this is explained below.
All SMU physiotherapy students registered in year 2017 making the total population size of 178 distributed as about 47 first year students, 51 second years, 39 third years and 41 fourth years. From the target population, each student from each level of study was used when piloting the study.
From the 178 who were asked to participate, total of 117 students agreed to give consent and agreed to participated, of the study.
Sampling: A sample is a subset of a study population that has been selected for use in a study. The quantitative study required a representative sample in order to be representative and for inferences to be made as it is required to be generalizable (Baffour et al., 2013; Hacking, 2011). This study was initially designing a stratified sampling method because of the natural strata from the first to fourth year levels of student studies. The population size, however was small enough to be handled in this study. Therefore, a census was used on the target population total of 181 physiotherapy students, 47 first years, 51 second years, 39 third years and 41 fourth years where census entails a research method using all the members of the study population. During actual data collection though because of exclusions and nonresponses, the actual sample consisted of 19 first years, 46 second years, 31 third years and 21 fourth years to provide a sample of size 117. This was a 65% sampling ratio. This ratio is satisfactory as it far exceeds the rule of thumb sampling ratio of 10% (Table 1).
Ethical considerations: All participants were fully
37
10 5 3 4
24
7 6
2 40
35 30 25 20 15 10 5 0
Pe
rc
e
n
ta
g
e
No Yes No Yes
Female Male
0 1 2 3 5 the reasons for participating in the study. They were
informed of their right to refuse to participate with no prejudice and their right to withdraw at any time during the study without consequences’ to them. The study received clearance from the university’s ethical and research committee before it commenced.
Data collection: The Dundee Ready Educational
Environment Measure (DREEM) questionnaire which was adapted as Grobler and Raphokwane (2005) questionnaire was used for data collection. It consisted of two parts, parts A and B. It was first piloted using physiotherapy academic staff as they were not in the study population. Before the data collection, the researchers requested permission to conduct the study in writing from the head of the physiotherapy department who granted the permission. Then the students were contacted by emails and hard copy letter in which they were informed about the study and invited to participate. The questionnaire was distributed to only those who had signed consent forms. The data collection exercise took one week to accomplish.
Data analysis: The data are in categorical form designed
to provide pre-determined meanings according to the development of the study questionnaire. As a result, matrices and frequency tables were used to present the data. The analyses were carried out using descriptive statistics based on coded categories, frequency tables, percentages and tests of hypothesis. A smoothing method is an analysis of data that appear to be complex. Smoothing is a method used to estimate rough data including discrete data, using continuous data through a curve that is easy to describe with a mathematical operation or function (Shahidehpour et al., 2002; Weron, 2014). It enables coded data to be described using descriptive measures even when they naturally cannot be well-explained. Averages in coded data are explained and described by values which they have closest proximity (Conejo et al., 2005; Lei and Feng, 2012). Smoothing methods enable benchmarking and comparisons on average, and can be used to forecast trends in some instances (Taylor, 2010). In this study, smoothing is used to determine the partialities and inclines of perceptions
and experiences of the students with respect to various attributes investigated as per the items of the research questionnaire.
RESULTS AND DISCUSSION
The study interprets the results from the coded values, taking advantage of smoothing methods of data analyses and the results interpretation.
Respondents’ profiles: On the demographics of
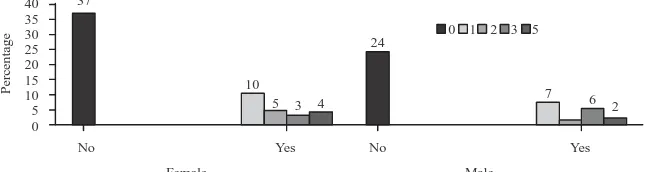
participants, mean, median and modal ages were concentrated around the ages 18-22 years as their smoothed values were 1.33, 1 and 1, respectively from the codes 1 = 18-22; 2 = 23-27; 3 = 28-32 and 4 = over 33 years of age. Regarding their gender, the smoothed mean, median and mode were, respectively, 1.6, 2 and 2. Since, 1 = male and 2 = female, the SMU physiotherapy students were mostly females (Fig. 1).
Concerning the races to which they belonged, the smoothed mean, median and mode were respectively, 1.1, 1 and 1. The races were defined as 1 = blacks, 2 = whites, 2 = coloureds and 4 = Indians even though smoothing would be difficult to interpret due to unranked categories, in this case the concentration is persistently indicating that these are black students. About the level at which they were studying at the time, the smoothed mean, median and mode were respectively, 2.6, 2 and 2. The levels were defined as 1 = 1st, 2 = 2nd, 3 = 3rd and 4 = 4th levels, the respondents were mostly at second and third year levels.
Students who once failed a course: Concerning whether
they repeated a course since registering for physiotherapy, the smoothed mean, median and mode were respectively, 0.9, 0 and 0. The codes were 0 = never repeated and 1 = repeated, the results show that most student never failed even though there were few who once failed the courses.
[image:4.612.149.477.614.700.2]Figure 2 shows that high percentages of female students aged between 18 and 22 years old were the ones failing the most (portraying an outlier threat) while females aged between 23 and 27 years of age were failing the least. Regarding the number of levels which the
25
20
15
10
5
0
Pe
rc
en
ta
g
e
33
4
16
8
12 10
7 9
1
Female Male Female Male
No Yes
18-22 23-27 28-32
Female Male Female Male
2016 principle test 1 2016 principle test 2 25
20
15
10
5
0
P
er
centag
e
0-44 45-49 50-59
6.4 14.4
17.6 13.6
6.4
0.8
8.0 8.8 16.8
3.2 2.4 1.6
8.0 11.2
20.8 16.8
1.6 0.8
7.2
2.4 14.4
11.2
[image:5.612.103.490.79.359.2]5.6 0.0 60-69 70-79 80 or more Fig. 2: Academic levels repeated
Fig. 3: Test 1 and tests 2 comparisons
once-failed students had to repeat, the smoothed mean, median and mode were respectively, 1.6, 2 and 2. The codes of levels were 1 = once, 2 = twice, 3 = three times and 4 = 4 times. Thus, the results indicate that student who once had to repeat a level never repeated more than one level. For those who failed principles, the number of times at which the failed students had to repeat, the smoothed mean, median and mode were respectively, 0.6, 0 and 0. The codes on theory/principles were also defined also as 1 = once, 2 = twice, 3 = three times and 4 = 4 times. Thus, the students who once repeated because of theory never repeated two levels. For those who failed clinical, the levels at which they failed produced smoothed mean, median and mode, respectively of 0.3, 0 and 0. Again, clinicals had never been failed by a single student at different levels.
The appearance exhibited in Fig. 3 is an indication that female student improved in performance from test 1 to test 2 while males dropped in performances, except for old males.
Late registration: Regarding students whose
registrations as students were ever delayed and thus disturbing starting the course at the beginning with other students, the smoothed mean, median and mode were respectively, 2.4, 2 and 3. The codes were 1 = strongly agree, 2 = agree, 3 = disagree and 4 = strongly disagree. The central locations indicate a split verdict in favour agreement that the student have at some point being
delayed but slightly. This shows that only few students could have been delayed to register in time to start the course with everyone else.
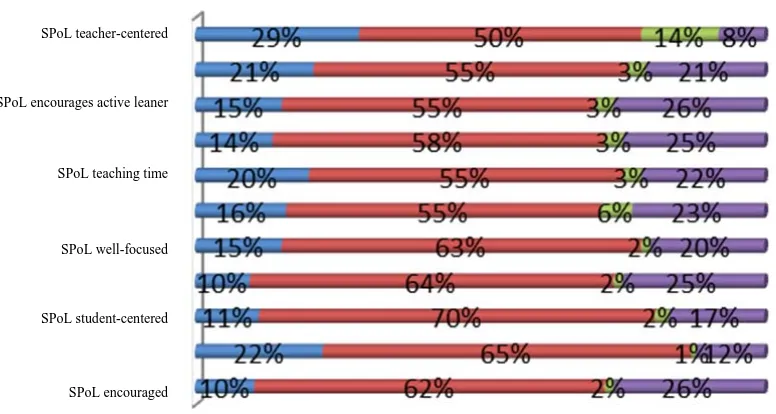
Students’ perceptions of learning: The codes on the
questions were defined as 1 = strongly agree, 2 = agree, 3 = disagree, 4 = strongly disagree. The results for this items probed appear of this document. The questions were given below.
C I am encouraged to participate during teaching sessions
C The teaching is often stimulating C The teaching is student-centered
C The teaching helps to develop my competence C The teaching is well-focused
C The teaching helps to develop my confidence C The teaching time is put to good use
C The learning objectives of the course are clear C The teaching encourages me to be an active learner C Long-term learning is emphasized over short-term
learning
C The teaching is too teacher-centered*
Fig. 4: Students’ perception of learning
Fig. 5: Students’ perception of lecturers
The medians and modes for these questions were all equal to three and the means revolve very close to three. This is an overwhelming response to indicate that the students’ perceptions of learning in the department are negative.
Students’ perceptions of lecturers: The codes defined in
the previous subsection apply. The items probed were below (Fig. 5).
C The lecturers are knowledgeable
C The lecturers adopt a patient-centered approach to consulting
C The lecturers ridicule the students* C The lecturers are authoritarian*
C The lecturers have good communication skills with students
C The lecturers are good at providing feedback to students
C The lecturers provide constructive criticism C The lecturers give clear examples
C The lecturers get angry during teaching*
C The lecturers are well-prepared for their teaching sessions
C The students irritate the lecturers
SPoL teacher-centered
SPoL encourages active leaner
SPoL teaching time
SPoL well-focused
SPoL student-centered
SPoL encouraged
Agree Disagree Strongly agree Strongly disagree
SPoL teacher-centered
SPoL long term learning emphasized
SPoL encourages active leaner
SPoL learning objectives
SPoL teaching time
SPoL confidence
SPoL well-focused
SPoL competence
SPoL student-centered
SPoL stimulating
SPoL encouraged
Fig. 6: Students’ perception of atmosphere
This figure displays results that need to be clarified. The numerical version of results appears. They show that items 1-3, 5-7 and 10, indicate central location values of mean = mode = 3 and the mean of approximately 3 (i.e., ±3). On these items, the students are satisfied with the lecturer’s ways of facilitation. All the others indicate median = mode = 2 and mean = ±2. These indicate that the students generally do not approve of the lecturer’s ways of facilitation on these items including that the lecturers tend to be authoritarian and sometimes get angry during teaching. However, the responses in item 4 indicate that despite these negative perceptions on some items, the lecturers do not seem to ridicule students. Also, lecturers were viewed as not authoritarian; as providing clear examples as not getting angry during lecturing and the students believed that they did not irritate the lecturers.
Students’ perceptions of the atmosphere: The earlier
codes apply. The items probed were given below. C The atmosphere is relaxed during ward teaching C This department is well time-tabled
C Cheating is a problem in this school* C The atmosphere is relaxed during lectures
C There are opportunities to develop my interpersonal skills
C I feel comfortable in class socially
C The atmosphere is relaxed during class/seminars/ tutorials
C I find the clinical experience disappointing* C I am able to concentrate well
C The enjoyment outweighs the stress of the course C The atmosphere motivates me as a learner C I feel able to ask the questions I want
The display appear in Fig. 6 and numerical results are given. Item 10 indicates central location values of mean = mode = 2 and the mean of ±2. This indicates that the students felt that there could be more stress than enjoying the course. Then, all the other items indicate median = mode = 3 and mean = ±3. These indicate that the students seem to be satisfied with the atmosphere of their learning.
Students’ social self-perception: The codes on the
questions are as before. The questions were given below.
C There is a good support system for students who get stressed
C I am too tired to enjoy the course* C I am rarely bored in this course C I have good friends in this course C My social life is good
C I seldom feel lonely
C My accommodation is pleasant
Figure 7 displays the results. Item 2 indicates central location values of mean = mode = 2 and the mean of ±2. This indicates that the students are tired to enjoy the course. All the others indicate median = mode = 3 and mean = ±3, except item 4 which has mode = 4. These items indicate consistency with the students’ disapproval of their social self-perceptions.
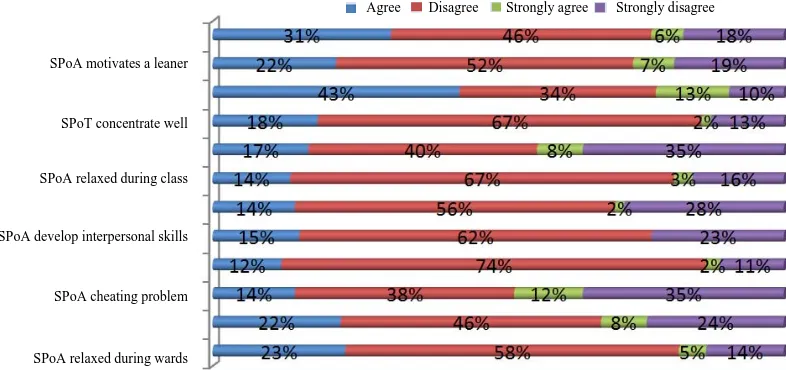
Students’ academic self-perceptions: The codes on the
items probed are as before. The questions were given below (Fig. 8).
SPoA motivates a leaner
SPoT concentrate well
SPoA relaxed during class
SPoA develop interpersonal skills
SPoA cheating problem
SPoA relaxed during wards
Fig. 7: Student’s social-self-perception
Fig. 8: Student’s academic self-perception
Student’s academic self-perception:
C Learning strategies that worked for me before continue to work for me now
C I am confident about my passing this year C I fell i am being well prepared for my profession C Last year’s work has been a good preparation for this
year’s work
C I am able to memorize all i need
C I have learnt a lot about empathy in my profession C My problem-solving skills are being well developed
here
C Much of what i have to learn seems relevant to a career in healthcare
The bar chart above displays the facts about the items of the variable (student’s academic self-perception). As per the results, the medians and modes for these
SSSP accommodation pleasant
SSSP seldom feel lonely
SSSP good social life
SSSP have good frieds
SSSP rarely bored
SSSP tired to enjoy course
SSSP good support system for stressed students
Agree Disagree Strongly agree Strongly disagree
SASP what leaned is relevant to career
SASP skills well developed
SASP leaned about empathy in profession
SASP able to memorize
SASP last year prepared for this year
SASP prepared for profession
SASP confidence about passing
SASP leaning strategies
Table 2: Student’s academic self-perception
Variables Test 1 Test 2
Mean 2.896 3.008
SE 0.111195 0.105645
Median 3 3
Mode 3 3
SD 1.243201 1.181142
Skewness 0.328157 -0.19473
Range 5 5
Minimum 1 1
Maximum 6 6
[image:9.612.71.299.234.340.2]Sum 362 376
Table 3: t-test: two-sample assuming unequal variances
Variables 2016 test 1 2016 test 2
Mean 2.896 3.008
Variance 1.545548 1.395097
Observations 125 125
Hypothesized mean difference 0
df 247
t stat -0.73022
p (T<= t) one-tail 0.232975 t critical one-tail 1.651046 p (T<= t) two-tail 0.46595 t critical two-tail 1.969615
questions are all equal to three and the means revolve very close to three. This is an indication that the immense majority of these students’ self-perceptions of learning in the department are not in favour of what actually happens with regards to the items of the variable (i.e., their academic self-perceptions are negative) (Table 2).
Test 1 vs. test 2 performance: As a further evaluation,
the students were also investigated on their 2016 academic year performances in the two tests prescribed for their major courses. Their test results (marks of performance) on both tests appear in the next table.
The impression is that the mean of test 1 is lower than of test 2. This is an indication of drop in performance from test 1 going into test 2. However, in order to tests for statistical significance of this signal, a comparison of the two tests is conducted using a t-test below (Table 3).
The study interprets the results from the coded values, taking advantage of smoothing methods of data analyses and results interpretation.
Respondents’ profiles: Most physiotherapy students
from level 1 to level 4 were aged between 18 and 22 years female students were in the majority and most senior students participated compared to first years. Few students failed some modules but there were no student repeating levels more than once. Some few students had registered late and could not start with the rest of their peers.
Students’ perception of learning: The students indicated
to not been encouraged to participate in lectures; the
teaching was viewed as not stimulating, teaching viewed as not being student-centred but lecturer-centred; teaching not helping to develop student confidence and competence; teaching not being well-focused; teaching time not put to good use; unclear learning objectives and long-term learning not emphasised.
Students’ perception of lecturers: The respondents
believed that their lecturers were not knowledgeable; teachers were viewed as authoritarian; lacking communication skills not good at providing feedback to students; not good at providing feedback to students and not providing constructive criticism. Also, the students viewed lecturers as not authoritarian as giving clear examples not enraged during lecturers.The students did not view themselves as infuriating the lecturers.
Students’ perception of the atmosphere: The students
found the wards, tutorial and lecture atmosphere to be relaxed and motivating; the department to be well time-tabled; cheating not a worry; opportunities existing to develop student’s interpersonal skills; students felt comfortable in lecturers; concentration existence and able to questions necessary for learning. However, there was enough stress to offset the joy of the course.
Students’ social self-perception: Student support
systems were viewed as inadequate; students were bored and tired by the course; good friends were lacking; social life not exiting; feeling of loneliness and somewhat unpleasant accommodation.
Students’ academic self-perception: Students found old
useful strategies no longer assisting; confidence to pass was low they lacked preparedness for practicing their profession; memorising necessary information was difficult; empathy learning was inadequate; problem solving skills were not well developed and some irrelevant content covered a large proportion of learning.
Test 1 vs. test 2 performance: The performance in the
two prescribed tests did not provide statistical significance of deterioration. However, a slight increase was shown which surely implies that there was no improvement from the first to the second tests.
CONCLUSION
Hence, there is no statistical evidence at the 5% level of significance that performance on the two tests is different. Thus, the indicated drop is of minimal consequence.
RECOMMENDATIONS
The students believe that some aspects were not done correctly. They pointed at items where they were not satisfied. As to how these items were not satisfactory is a mystery as the questionnaire did not dwell into details of the issues. Therefore, the department of physiotherapy should take teaching corrective actions on issues that were not satisfactory:
The physiotherapy department of SMU should address’ identified student learning problems as a matter of urgency (i.e., high priority); tackle teaching and feedback towards student improvement in learning and lecturer improvement in facilitating; lead dialogues where students list their points of dissatisfaction; solicit suggestions from students on their expected models and work with relevant student bodies to fashion the conditions of benefit to students and their lecturers.
REFERENCES
Attwood, T., 2014. Why are some students so poor at maths. SEN Magazine Ltd., Clitheroe, England. https://senmagazine.co.uk/articles/articles/senarticl es/why-are-some-people-so-poor-at-maths Baffour, B., T. King and P. Valente, 2013. The modern
census: Evolution, examples and evaluation. Int. Stat. Rev., 81: 407-425.
Bakhshialiabad, H., M. Bakhshi and G. Hassanshahi, 2015. Student’s perceptions of the academic learning environment in seven medical sciences courses based on DREEM. Adv. Med. Educ. Pract., 6: 195-203. Benson, S.K., 2011. Factors contributing to poor
performance in mathematics at KCPE in in Public primary schools in Isiolo District, Eastern Province, Kenya. M.Ed. Thesis, Kenyatta University, Nairobi, Kenya.
Conejo, A.J., M.A. Plazas, R. Espinola and A.B. Molina, 2005. Day-ahead electricity price forecasting using the wavelet transform and ARIMA Models. IEEE Trans. Power Syst., 20: 1035-1042.
Darawsheh, W. and M. Stanley, 2014. Reflexivity in research: Promoting rigour, reliability and validity in qualitative research. Int. J. Therapy Rehabil., 21: 560-568.
Grobler, A. and K. Raphokwane, 2005. Perception of students regarding their Physiotherapy. M.Sc. Thesis, Department at the Medical, University of Southern Africa, Southern Africa.
Hacking, I., 2011. An Introduction to Probability and Logic. Cambridge University Press, London, UK.,. Leedy, P.D. and J.E. Ormrod, 2013. Practical Research:
Planning and Design. 10th Edn., Pearson Education, London, UK., ISBN: 9781292021171, Pages: 384.
Lei, M. and Z. Feng, 2012. A proposed grey model for short-term electricity price forecasting in competitive power markets. Int. J. Electr. Power Energy Syst., 43: 531-538.
Lizzio, A., K. Wilson and R. Simons, 2002. University student’s perceptions of the learning environment and academic outcomes: Implications for theory and practice. Stud. Higher Educ., 27: 27-52.
Manoah, S.A., F.C. Indoshi and L.O.A. Othuon, 2011. Influence of attitude on performance of students in mathematics curriculum. Educ. Res., 2: 965-981. Miheso, K.M., 2012. Factors affecting mathematics
performance among secondary school students in Nairobi Province, Kenya. Ph.D. Thesis, Kenyatta University, Nairobi, Kenya.
Mji, A. and M. Makgato, 2006. Factors associated with high school learners poor performance: A spotlight on mathematics and physical science. South African J. Educ., 26: 253-266.
Mushtaq, I. and S.N. Khan, 2012. Student’s factors affecting academic performance. Global J. Manage. Bus. Res., 12: 16-20.
Nahar, N., M.H.K. Talukder, M.T.H. Khan, S. Mohammad and T. Nargis, 2010. Students perception of educational environment of Medical Colleges in Bangladesh. Bangabandhu Sheikh Mujib Med. Univ. J., 3: 97-102.
Nosair, E., Z. Mirghani and R.M. Mostafa, 2015. Measuring students perceptions of educational environment in the PBL program of Sharjah medical college. J. Med. Educ. Curr. Dev., 2: 71-79. Odole, A.C., O.O. Oyewole and O.T. Ogunmola, 2014.
Nigerian physiotherapy clinical students perception of their learning environment measured by the Dundee ready education environment measure inventory. Int. J. Higher Educ., 3: 83-91.
Oyeyemi, A.Y., A.L. Oyeyemi, A.A. Rufai, S.M. Maduagwu and H.N. Aliyu, 2012. Knowledge, attitude and willingness of Nigerian physiotherapy students to provide care for patients living with acquired immunodeficiency syndrome. Physiother. Theory Pract., 3: 1-10.
Shahidehpour, M., H. Yamin and Z. Li, 2002. Market Operations in Electric Power Systems: Forecasting, Scheduling and Risk Management. 1st Edn., John Wiley and Sons Inc., New York, ISBN-10: 0471443379.
Shamaki, T.A., 2015. Influence of learning environment on students academic achievement in mathematics: A case study of some selected secondary schools in Yobe State-Nigeria. J. Educ. Pract., 6: 40-44. Taylor, J.W., 2010. Triple seasonal methods for
Tsanwani, A.R., 2009. Tracing factors that facilitate achievement in mathematics in traditionally disadvantaged secondary schools. Ph.D. Thesis, University of Pretoria, Pretoria, South Africa. Tshabalala, T. and A.C. Ncube, 2016. Causes of poor
performance of ordinary level pupils in mathematics in rural secondary schools in Nkayi district: Learner’s attributions. Nova J. Med. Biol. Sci., Vol. 1, No. 1. 10.20286/nova-jmbs-010113
Veasuvalingam, B. and H. Arzuman, 2014. Physiotherapy students perception of their educational environment: A study to identify the areas of concern for remedial measures at two schools of physiotherapy in Malaysia. Educ. Med. J., 6: e30-e39.