warwick.ac.uk/lib-publications
A Thesis Submitted for the Degree of PhD at the University of Warwick
Permanent WRAP URL:
http://wrap.warwick.ac.uk/78850
Copyright and reuse:
This thesis is made available online and is protected by original copyright. Please scroll down to view the document itself.
Please refer to the repository record for this item for information to help you to cite it. Our policy information is available from the repository home page.
Identification of novel
transcripts involved in
insecticide resistance in
African malaria vectors.
Victoria Anne Ingham
BA Hons (Oxon), MSc
Submitted for the degree of Doctor of
Philosophy
Systems Biology DTC, University of
Warwick, in collaboration with the
Vector Biology Department at
Liverpool School of Tropical
Medicine
Table of Contents
List of Figures ... 5
List of Tables ... 8
Acknowledgements ... 10
Declaration ... 11
Summary ... 12
Abbreviations ... 13
1. INTRODUCTION ... 15
Malaria ...16
Overview. ... 16
Causative agent and transmission. ... 16
Vector Control ...19
Overview. ... 19
Vector control: Insecticide treated nets... 21
Insecticide Resistance Mechanisms. ...23
Overview. ... 23
Target site resistance. ... 23
Metabolic resistance. ... 24
Cuticular resistance. ... 31
Transcriptional control of xenobiotic response. ... 32
Microarray Analysis. ...33
Microarray and enrichment analysis. ... 33
Hypotheses ... 37
2. MATERIALS AND METHODS... 38
Study One: Analysis of gene expression in different body parts. ...39
Mosquito rearing conditions ... 39
Microarray experiments... 39
Microarray analysis ... 41
qPCR ... 42
Preparation of antibodies ... 43
Immunofluorescence and microscopy ... 43
Study Two: Meta-analysis ...44
Microarray analysis ... 44
Metadata collection ... 45
Clustering ... 46
Enrichment ... 47
GO term attribution ... 47
GaGa analysis ... 47
Transcription factor identification ... 48
Study Three: Deltamethrin candidate search ...49
Mosquito rearing conditions ... 49
qPCR ... 49
RNAi ... 50
Localisation of candidate genes ... 51
Induction ... 52
Bioassays ... 52
Localisation Enrichment ... 52
Study Four: Keap1-Maf-S-cnc pathway ...52
Probability of a transcript being differentially regulated in n arrays by chance ... 52
Enrichment tests ... 53
Mosquito rearing conditions ... 53
RNAi ... 53
qPCR ... 53
Microarrays ... 54
Microarray analysis ... 54
Pathway analysis ... 54
Correlation networks ... 54
Study Five: Met involvement with public health insecticides ...55
Mosquito rearing conditions ... 55
RNAi ... 55
qPCR ... 55
Microarrays ... 55
Microarray analysis ... 56
Enrichments and Pathway Analysis ... 56
Bioassays ... 56
Correlation networks ... 56
Yeast two-hybrid ... 56
Motif identification ... 56
3. DISSECTING THE ORGAN SPECIFICITY OF INSECTICIDE RESISTANCE CANDIDATE GENES IN ANOPHELES GAMBIAE: KNOWN AND NOVEL CANDIDATE GENES. ... 58
Introduction ...59
Aims ...61
Results ...61
Body Part Specific Transcript Enrichment: Overview. ... 62
Body Part Specific Transcript Enrichment: Detoxification Genes. ... 65
Body Part Specific Transcript Enrichment: Novel Genes. ... 71
Discussion ...78
4. EXPLORATORY META-ANALYSIS OF ANOPHELES MICROARRAY EXPERIMENTS ... 80
Introduction ...81
Aims ...82
Results ...82
Microarray meta-analysis: Revealing relationships. ... 82
GO Term clustering shows low discriminatory groupings. ... 92
An. coluzzii and An. arabiensis show unrelated transcriptomes. ... 94
Candidate Selection: Transcription factors. ... 99
Candidate Selection: Transcriptomic response to a core of pyrethroid resistant populations. ... 101
Gene Enrichment: Survivor Studies... 105
Discussion ... 107
5. FUNCTIONAL CHARACTERISATION OF CANDIDATE TRANSCRIPTS. ... 110
Introduction ... 111
Aims ... 111
Results ... 111
SAP2: Validating the phenotype. ... 118
SAP2: Localisation and induction. ... 119
Discussion ... 122
6. TRANSCRIPTIONAL REGULATION OF XENOBIOTIC RESPONSE: MAF-S .. 128
Introduction ... 129
Aims ... 131
Results ... 132
Correlation networks reveal putative transcriptional interactions ... 133
Maf-S knockdown and influence on putative detoxification interactors ... 136
Transcriptional response to Maf-S knockdown ... 137
Pathway changes after knockdown of Maf-S ... 144
Discussion ... 154
7. TRANSCRIPTIONAL REGULATION OF XENOBIOTIC RESPONSE: METHOPRENE TOLERANT ... 157
Introduction ... 158
Aims ... 159
Results ... 160
Transcriptomic changes after RNAi knockdown ... 160
Pathway changes after Met knockdown ... 163
Phenotyping of Met-RNAi ... 166
Met Xenobiotic Response: Evidence ... 169
Met Xenobiotic Response: Yeast Two-Hybrid ... 170
Transcription factor knockdowns: general or specific response? ... 172
Discussion ... 176
8. GENERAL DISCUSSION ... 180
9. APPENDIX ... 191
List of Figures
Figure 1.1: Malaria transmission and bed net usage statistics (WHO,
2014)………...19 Figure 1.2: Mechanism of action of cytochrome p450s (Meunier et al.,
2004)………26 Figure 1.3: Mechanism of action of carboxylesterases (Hemingway &
Karunaratne, 1998)……….………27 Figure 1.4: Glutathione-S-transferase mechanisms (Armstrong,
1991)………29 Figure 1.5: General UDP-glycosyltransferase mechanism (Tukey & Strassburg, 2000)…….………...…...30 Figure 3.1: Schematic of design of structure specific microarray experiments….62 Figure 3.2: Gene enrichment in individual body parts in insecticide susceptible and resistant mosquitoes…………...……….63 Figure 3.3: Local expression of all cytochrome p450s, following a phylogenetic dendrogram……….67 Figure 3.4: Local expression of cytochrome p450s linked to insecticide…………..68 Figure 3.5: qPCR validation of body part enrichment of cytochrome p450s……..69 Figure 3.6: Immunohistochemical stainings of cytochrome p450s associated with pyrethroid resistance…….………70 Figure 3.7: Validation of selection of transcripts from the candidate list by
Figure 4.2: Hierarchical clustering plots of all microarray studies used………91
Figure 4.3: Total number of significant (p ≤ 0.001) transcripts for each study...93
Figure 4.4: Hierarchical clustering plot of GO term number in each study………..94
Figure 4.5: Factor analysis using a smaller subset of studies………..……….95
Figure 4.6: Correlation plot of transcripts significant in one or more studies…...97
Figure 4.7: Transcription factor candidates……….100
Figure 4.8: Summary of limma analysis for pyrethroid studies……….…..102
Figure 4.9: Schematic of experimental design………...…..104
Figure 5.1: qPCR validation of eight candidate transcripts………113
Figure 5.2: Transcript expression levels 72 hours post dsRNA injection………..115
Figure 5.3: Mortality levels of dsRNA injected mosquitoes after exposure to deltamethrin………116
Figure 5.4: Mortality 24 hours post bendiocarb exposure………..117
Figure 5.5: Two dsRNA SAP2 constructs……….…119
Figure 5.6: SAP2 localisation……….……….………..…..120
Figure 5.7: SAP2 transcript expression post deltamethrin exposure…….….…...121
Figure 5.8: Kaplan-Meier plot of survival on injected and uninjected mosquitoes………122
Figure 6.1: Maf-S-cnc-Keap1 pathway………..…………131
Figure 6.2: Log2 fold change values for Maf-S-cnc-Keap1 pathway………132
Figure 6.3: Maf-S correlation network……….135
Figure 6.4: Knockdown levels of two Maf-S constructs……….136
Figure 6.5: Maf-S influence on correlated transcripts………...……….137
Figure 6.6: Microarray design……….…..………138
Figure 6.8: Purine and pyrimidine metabolic pathways……….……145-147 Figure 6.9: Pathways showing significant transcript changes in
Maf-S-RNAi………149-152
Figure 6.10: Mortality after exposure to deltamethrin………..156
Figure 7.1: Microarray design………160
Figure 7.2: Met construct mapping……….161
Figure 7.3: Changes due to Met-RNAi………165
Figure 7.4: Mortality associated with exposure to insecticides………..….167
Figure 7.5: Drosophila yeast-two hybrid interactome for Met………171
List of Tables
Table 2.1: qPCR primer list……….………42-43 Table 2.2: Primer sequences for qPCR……….49-50
Table 2.3: Primer sequences for dsRNA………...………..51
Table 2.4: RNAi primers………...53
Table 2.5: Primer sequences for Maf-S knockdown qPCR………..…54
Table 2.6: RNAi Met primers……….55
Table 2.7: Met qPCR primers……….55
Table 3.1: Overview of probes over or under transcribed in each body part for both the resistant and susceptible strains when compared to the whole organism………64-65 Table 3.2: Probe list from stringent analysis of direct transcriptome comparisons of dissected body parts from susceptible and resistant strains………..71-75 Table 3.3: Highest/Lowest expressed transcripts between resistant and susceptible populations………77
Table 4.1: Study information……….84-86 Table 4.2: Summary of metadata variance………...88
Table 6.1: Maf-S correlated transcripts………..….134 Table 6.2: Significant GO terms for significantly up- and down-regulated
transcripts………..……….139-140 Table 6.3: Significant detoxification transcripts………..140-142 Table 7.1: Significant gene ontology terms for transcripts DE in Met knockdown studies………162-163 Table 7.2: Detoxification family members down-regulated in Met-RNAi….168-169 Table 7.3: Enrichment terms for Maf-S-RNAi and Met-RNAi………....174-175 Table 7.4: Detoxification transcripts significantly differential in both Met and
Acknowledgements
Firstly, I would like to thank my three supervisors Professor Hilary Ranson, Dr Jonathan Moore and Dr Simon Wagstaff for the chance to complete my PhD and all of the help and assistance afforded to me throughout my 3 years. I have been extremely fortunate to have three friendly and approachable supervisors who I have always been able to go to for guidance and support.
Secondly, thank you to the entire Vector Biology group, members past and present, who have assisted me at various points and made working across two departments a pleasure. I would like to particularly offer my thanks and appreciation to Patricia Pignatelli who has been fantastic in lending me a hand whenever I need it.
Thank you also, to the members of the Systems Biology DTC who have helped me when I've needed it and made me welcome on my visits to the department.
Declaration
This thesis is submitted to the University of Warwick in support of my application for the degree of Doctor of Philosophy. I declare that all work
Summary
Insecticide resistance in malaria vectors is increasing across Sub-Saharan Africa, due, at least in part, due to the scale up of vector control programmes
implemented to overcome morbidity and mortality associated with malaria. Four classes of public health insecticides are widely utilised in vector control
strategies such as indoor residual spraying and insecticide treated nets;
pyrethroids in particular are heavily used being the only class licensed for bed net usage. Despite the increase in resistance to these insecticides, and the implications this has for malaria control, resistance mechanisms remain incompletely understood. This study identifies transcripts associated with resistance to pyrethroid insecticides in African malaria vectors.
Study one describes the specific localisation of resistance-associated transcripts in different body parts of the mosquito. Both known and novel candidates are identified and their enrichments in two major detoxification structures (the midgut and malpighian tubules), the abdomen integument and the remaining tissues determined. Study two lays the foundation for the remaining studies by using a meta-analysis based approach to analyse all available pyrethroid resistant versus susceptible microarray datasets at LSTM performed on
Anopheles gambiae s.l. Studies three through five explore three major candidates arising from this meta-analysis SAP2, a chemosensory protein; Maf-S a
transcription factor with known involvement in redox response in Drosophila
Abbreviations
ABCs: ATP-binding cassette transporters
ace-1: Acetylcholinesterase-1
AHR: Aryl- hydrocarbon
ANOVA: Analysis of variance
ARE: antioxidant response element
bHLH-PAS: Basic helix-loop-helix-PER-ARNT-SIM CCEs: Carboxyl/cholinesterase
cDNA: Complementary DNA CHC: Cuticular hydrocarbons COEs: Carboxylesterases cRNA: Complementary RNA CSPs: Chemosensory proteins
DAVID: Database for Annotation, Visualization and Integrated Discovery DDT: Dichlorodiphenyltrichloroethane
DE: Differential expression DNA: Deoxyribonucleic acid ER: Endoplasmic reticulum FDR: False discovery rate GaGa: Gamma-Gamma Model GFP: Green fluorescent protein GO: Gene ontology
ITNs: Insecticide treated nets
kdr: Knockdown resistance
KEGG: Kyoto encyclopaedia of genes and genomes LLINs: Long lasting insecticidal nets
LSTM: Liverpool School of Tropical Medicine
Met: Methoprene tolerant
MeV: Multi-experiment viewer MCMC: Mixed chain Monte Carlo mRNA: Messenger RNA
MS: Mean square
NADPH: Nicotinamide adenine dinucleotide phosphate P450s: Cytochrome p450s
PBS: Phosphate-buffered saline PSA: Pyrethroid survivor arrays qPCR: Quantitative PCR
RNA: Ribonucleic acid RNAi: RNA interference
R vs S: Resistant versus Susceptible SS: Sum of squares
tRNA: Transfer RNA
UDP: Uridine disphosphate
Malaria
Overview.
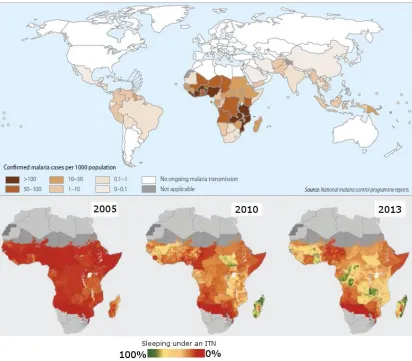
In 2013 there were an estimated 198 million cases of malaria, with 584 000 deaths, 78% of these being in children under five (WHO, 2014) (Figure 1.1). Although these statistics are alarming, malaria cases have actually fallen
dramatically since 2000, with a 47% decrease in mortality rates and number of infections decreasing by 26% (WHO, 2014). Currently, 97 countries and
territories have on-going malaria transmission and seven countries are in prevention of reintroduction stage, equating, in total, to 104 endemic countries. The greatest burden of malaria is found in Africa, with 80% of cases and 90% of all malaria associated deaths (WHO, 2014). Several problems confound the reporting of malaria, for example, people with acquired immunity show mild or no symptoms after infection. Moreover, the symptoms of malaria are not readily distinguishable from several other diseases and both self-treating and
misdiagnosis are common due to poor medical infrastructures (Hay et al., 2010a; Mharakurwa et al., 2013)
Causative agent and transmission.
Malaria is caused by five species of the protozoan apicomplexan parasite
species known to transmit the disease worldwide (Sinka et al., 2010b). Many competent vectors are found within Africa, a factor in the high prevalence of malaria across the continent (Sinka et al., 2010b). The most highly efficient vectors are part of the Anopheles gambiae complex, which is composed of the dominant vector species An. gambiae, An. coluzzii, An. arabiensis, An. merus and
An. melas with the latter two being restricted to coastal regions (Hay et al., 2010b; Coetzee et al., 2013). In addition to the An. gambiae complex, Africa has several other competent vectors including An. funestus, An. nili and An. moucheti. Dominant vector species are described as such due to the high impact on public health, largely due to their anthrophilic biting behaviour (Sinka et al., 2010b).
Vector ecology is complex, with variations across seasons and between urban and rural areas (Hay et al., 2010b). An. gambiae has a very large geographical range (Sinka et al., 2010a; Sinka et al., 2010b; Hay et al., 2010b) with five
chromosomal forms (Coluzzi et al., 1985) and two molecular forms (della Torre
et al., 2001). Improvements in molecular systematics since the early 21st century have allowed more detailed exploration of the An. gambiae complex (Coetzee et al., 2013). These data have shown that the two molecular forms - 'M' and 'S', have very little gene flow across West Africa (<1%) (della Torre et al., 2005) and individual countries (Coetzee et al., 2013). Although reproductive isolation of the two forms is incomplete (Weetman et al., 2012), there are pre-existing
flow was the accepted consensus; however, in 2013 Coetzee et al. (Coetzee et al., 2013) described two new species within the An. gambiae complex, renaming the 'M' form as An. coluzzii whilst retaining An. gambiae for the 'S' form and
describing an Ethiopian species: An. amharicus (Coetzee et al., 2013).
Figure 1.1: Malaria transmission and bed net usage. (a) Countries with on-going malaria transmission. (b) Proportion of households with bed nets from 2005 - 2014. Modified from the World Malaria Report (WHO, 2014).
Vector Control
Overview.
access to at least one ITN within a single household due a projected 214 million nets to be distributed by the end of 2014 (WHO, 2014). With only one class of insecticide licensed for bed net use, the pyrethroids (Davies et al., 2007), selection pressure for resistance against this insecticide class is high.
Pyrethroids are one class out of four currently used in IRS programmes, with the others being the organochlorides, organophosphates and carbamates. The most infamous insecticide, DDT, an organochloride, is still utilised for IRS. Pyrethroids were the most commonly used insecticide class in IRS programmes until
recently. This, in addition to the use of this class in agriculture and domestic applications such as aerosols and coils, creates several major exposure routes for the mosquitoes (Davies et al., 2007; Ranson et al., 2011). More recently,
pyrethroids have been replaced by carbamates and organophosphates in many IRS programmes due to problems of resistance (Mnzava et al., 2015).
other dominant vector species (Bayoh et al., 2010; Derua et al., 2012; Jones et al., 2012b; Mwangangi et al., 2013; Lwetoijera et al., 2014; McCann et al., 2014).
Vector control: Insecticide treated nets.
The percentage of household bed nets has risen from 3% in 2000 to 49% in 2013 (WHO, 2014) (Figure 1.1). Every year it is necessary to distribute 150 million bed nets to protect at-risk people throughout the African continent, which equates to one LLIN for every 1.8 person. These LLINs are generally provided free of charge to all at risk, with a mass distribution every three years. The scale up of global interventions has significantly reduced the mortality and morbidity associated with malaria infection (WHO, 2014).
The increased use of insecticides in agriculture, IRS and ITNs exerts a large selection pressure on the exposed mosquito populations and has resulted in resistance to the major classes of insecticide (Fanello et al., 2000; Awolola et al., 2005; Liu et al., 2006; Davies et al., 2007; N’Guessan et al., 2007; Müller et al., 2008a; Müller et al., 2008b; Awolola et al., 2009; Kawada et al., 2011; Ranson et al., 2011; Namountougou et al., 2012; Edi et al., 2012; Badolo et al., 2012; Temu
et al., 2012; Jones et al., 2012b; Bigoga et al., 2012; Kwiatkowska et al., 2013; Protopopoff et al., 2013; Jones et al., 2013; Mawejje et al., 2013; Ilboudo-Sanogo
et al., 2013; Corbel & N’Guessan, 2013; Koffi et al., 2013; Nardini et al., 2013; Riveron et al., 2013; Shetty et al., 2013; Namountougou et al., 2013; Fossog Tene
least 64 countries, with 77 countries actively monitoring insecticide resistance (WHO, 2014). A lack of investment in the discovery of new public health
insecticides has resulted in no new active ingredients being produced in the last 30 years (Davies et al., 2007; Ranson et al., 2011) making the issue of resistance management and mitigation critical.
Common resistance mechanisms employed by Anopheline vectors that have been studied extensively include target site mutations, resulting in a loss of sensitivity to specific insecticides (Martinez‐Torres et al., 1998; Verhaeghen et al., 2006a; Davies et al., 2007; Donnelly et al., 2009; Namountougou et al., 2013) and
Insecticide Resistance Mechanisms.
Overview.
Two main evolutionary forms of resistance have been studied and characterised in Anopheles species: metabolic resistance and target site resistance. Target site resistance leads to a decreased response to the insecticide due to mutations in the specific area targeted by each class of insecticides (Martinez‐Torres et al., 1998), whereas metabolic resistance acts through increased clearance and detoxification of insecticides (Xu et al., 2005).
Target site resistance.
Out of all the resistance mechanisms in the An. gambiae species complex, the most thoroughly understood is knock-down resistance or kdr. kdr is a target site mutation at the para voltage gated sodium channel, which provides resistance to the two insecticides that target this; DDT and pyrethroids. These insecticides work by preventing the sodium channels from shutting, resulting in prolonged nervous impulses, eventually causing paralysis and death (Davies et al., 2007; Ranson et al., 2011). There are two main mutations in the sodium channel, a substitution of a leucine allele with a phenylalanine or serine residue at position 1014 (Davies et al., 2007; Ranson et al., 2011). The two substitutions were originally termed kdr East (Ramphul et al., 2009) and kdr West (Dabire et al., 2009) reflecting their presumed origin in the African continent; however, both mutations are now widely distributed (Djègbè et al., 2011; Ndiath et al., 2012; Mawejje et al., 2013; Nwane et al., 2013; Ibrahim et al., 2014; Dabiré et al., 2014).
Ibrahim et al., 2014; Edi et al., 2014b) and An. arabiensis (Djègbè et al., 2011; Kawada et al., 2011; Jones et al., 2012b)but has not been seen in An. funestus
(Coetzee & Koekemoer, 2013).
A second target site mutation conferring insecticide resistance affects a
carboxylesterase, ace-1. The ace-1 mutation causes acetylcholine esterase to be insensitive to organophosphate and carbamate classes of insecticide.
Acetylcholine esterase hydrolyses the neurotransmitter acetylcholine, leading to termination of nerve signals. Both organophosphates and carbamates bind to acetylcholine esterase, inhibiting it, leading to paralysis and death. ace-1
resistance in Dipterans is conferred due to three separate amino acid
substitutions (Alout & Weill, 2008), but only a single point mutation in the ace-1 gene at position 119, resulting in a glycine to serine substitution, has been
described in An. gambiae s.l (Weill et al., 2003; Weill et al., 2004; Weetman et al., 2015).
Metabolic resistance.
A second method of resistance is based around a reduced exposure to the
insecticide through several methods: (i) preventing uptake (ii) sequestration (iii) metabolism and (iv) excretion (Xu et al., 2005). Both sequestration and
metabolism are important in arthropod insecticide resistance and can be
conjugated compounds can be transported out of the cells by cellular transporters such as ABC transporters (Xu et al., 2005).
Metabolic resistance has been shown to play a role in resistance to insecticides, although the true extent and genetic involvement is unknown (Ranson et al., 2011). Five classes of detoxification proteins have been linked extensively with removal or sequestration of the active insecticide before it reaches its target site (Ranson et al., 2002; Ranson et al., 2011). These classes are: cytochrome P450s, carboxylesterases (COEs), ABC transporters, glutathione-S-transferases (GSTs) and glucuronosyltransferases (UDPs) (Ranson et al., 2002; Ahn et al., 2012). Detoxification enzymes are encoded by large gene families in An. gambiae and
An. coluzzii, with 111 Cytochrome P450s, 31 GSTs, 51 COEs (Ranson et al., 2002), 55 ABC transporters (Roth et al., 2003, Ranson and Pignatelli, unpublished daa) and 26 UDPs (Ahn et al., 2012).
Cytochrome p450s are a superfamily of mono-oxygenases, acting by using a heme group to oxidise molecules, often resulting in hydrophilic secondary
products for clearance (Figure 1.2). Cytochrome P450s are the most well studied of the five detoxification families and have been shown to directly metabolise three of the four commonly used insecticide classes (pyrethroids,
metabolism (Müller et al., 2008b, Paine and Yunta Yanes, unpublished data),
CYP6M2 involved in DDT and pyrethroid metabolism (Stevenson et al., 2011; Mitchell et al., 2012) and the CYP6Z family implicated in pyrethroid metabolite binding in Aedes mosquitoes (Chandor-Proust et al., 2013).
Figure 1.2: Mechanism of action of Cytochrome P450s. Incomplete diagram showing: (1) Substrate binds in proximity to the heme group, which results in a change of conformation, displacing H2O from the heme iron, changing its state.
(2) Substance binding induces electron transfer from NADPH via a reductase. (3) Oxygen binds ferrous heme. (4) A second electron is transferred from the
reductase, reducing Fe-O2. (5) The peroxide group in (4) is protonated twice,
releasing H2O, forming a highly active P450 compound. (6) After catalysis, the
system returns to the original state. (Meunier et al., 2004).
Many insecticides contain ester bonds and so are amenable to hydrolysis via esterases (Sogorb & Vilanova, 2002) (Figure 1.3). Esterases have been linked to insecticide sequestration, being the primary resistance mechanism for
resistance in Aedes aegyptii and Culex pipiens by ubiquitous over-expression in resistant strains (Guillemaud et al., 1997; Bisset et al., 2011; Poupardin et al., 2014; Grigoraki et al., 2015) and pyrethroid resistance in Musca domestica
(Zhang et al., 2007). Carboxylesterases have also been found up-regulated in pyrethroid resistant populations in a number of An. gambiae, coluzzii and
arabiensis microarray experiments (Witzig, 2012; Jones et al., 2012b;
Kwiatkowska et al., 2013; Mawejje et al., 2013; Jones et al., 2013; Fossog Tene et al., 2013; Hemingway et al., 2013; Abdalla et al., 2014; Thomsen et al., 2014; Toé
et al., 2015) although a direct role in insecticide metabolism has not yet been demonstrated for Anopheles carboxylesterases .
Figure 1.3: Mechanism of action of carboxylesterases. Carboxylesterases hydrolyse ester groups, resulting in the formation of an alcohol and an acid metabolite (Hemingway & Karunaratne, 1998).
(Tang & Tu, 1994; Pedra et al., 2004; Le Goff et al., 2006; Low et al., 2010), the planthopper, Nilaparvata lugens (Vontas et al., 2001; Vontas et al., 2002)and a number of mosquito species (Ranson et al., 2001; Ortelli et al., 2003; Enayati et al., 2005; Lumjuan et al., 2007; Lumjuan et al., 2011; Aravindan et al., 2014). GSTs have been experimentally shown to conjugate glutathione to
organophosphate (Huang et al., 1998) as a secondary detoxification step
(Hemingway et al., 1991). Organochlorides are dehydrochlorinated by GSTs; this is a particularly important resistance mechanism for DDT breakdown (Ranson et al., 2001; Ortelli et al., 2003; Lumjuan et al., 2007; Low et al., 2010; Lumjuan et al., 2011; Aravindan et al., 2014). Evidence exists for a role of GSTs in pyrethroid resistance (Vontas et al., 2001; Lumjuan et al., 2011), which may be due to the protective activity against lipid peroxidation due to oxidative stress (Yang et al., 2001). Furthermore, a single amino acid change, L119F in an up-regulated GST (GSTE2 in An. funestus)has been shown to enlarge the DDT binding cavity, allowing more efficient metabolism of DDT (Riveron et al., 2014b). GSTE2 has also been demonstrated to directly metabolise the pyrethroid permethrin (Riveron et al., 2014b).
Although GSTs are found ubiquitously across all organisms, insects contain two classes of GSTs that are not found in mammalian organisms, the delta and epsilon classes, both of which are found in An. gambiae, with seven and 12 members respectively (Ranson et al., 2002). The epsilon class has been linked to insecticide resistance with GSTE2 demonstrating the highest level of
further to this, GSTs have been found upregulated in microarray experiments on resistant mosquitoes (Witzig, 2012; Jones et al., 2012b; Kwiatkowska et al., 2013; Mawejje et al., 2013; Jones et al., 2013; Fossog Tene et al., 2013; Hemingway et al., 2013; Abdalla et al., 2014; Thomsen et al., 2014; Toé et al., 2015).
Figure 1.4: Glutathione-S-transferase mechanisms. (a) Glutathione conjugation to an unspecified xenobiotic and resultant product. (b) DDT dehydrochlorination through GST action (Armstrong, 1991).
2014) (Figure 1.5). UGTs are found in the endoplasmic reticulum membrane and have a conserved structure, with an N-terminal binding domain and C-terminal UDP-glycoside binding domain (Magdalou et al., 2010). Although little is known about arthropod UGTs, activity has been observed against a variety of plant allelochemicals (Huang et al., 2008b; Ahn et al., 2011). Insect UGTs have also been implicated in resistance towards several classes of insecticide (Pedra et al., 2004; Vontas et al., 2005; Silva et al., 2012; Bozzolan et al., 2014), a hypothesis strengthened by their localisation to the three primary detoxification structures; the midgut, malpighian tubules and fat bodies (Ahn et al., 2012). Furthermore, UGTs have been detected as differentially expressed in a variety of microarray experiments on resistant mosquitoes (Witzig, 2012; Jones et al., 2012b;
Kwiatkowska et al., 2013; Mawejje et al., 2013; Jones et al., 2013; Fossog Tene et al., 2013; Hemingway et al., 2013; Abdalla et al., 2014; Thomsen et al., 2014; Toé
Figure 1.5: General UDP-glycosyltransferases mechanism. Lipophilic
compounds have glycoside groups conjugated to them through the UGT enzyme to produce hydrophilic glucuronide (Tukey & Strassburg, 2000).
Although mammalian ABC transporters are very well studied due to their roles in drug resistance, very little is known of the arthropod ABCs (Dermauw & Van Leeuwen, 2013). ABC-transporters act as a pump removing xenobiotics and potentially GST-conjugates found in cells in an energy-dependent manner, thereby lowering the concentration to a sub-lethal amount (Cole et al., 1994; Schinkel et al., 1995; Germann & Chambers, 1998). Mammalian ABC transporters have been shown to work in conjunction with phase II conjugating enzymes such as GSTs and UDP-glycosyltransferases, further strengthening their putative role in xenobiotic transport (Dermauw & Van Leeuwen, 2013). Although direct links between insecticide resistance and ABCs are missing, work in Drosophila have linked ABCs to resistance through both insecticide transport (Buss & Callaghan, 2008) and a putative 'detoxification network' (Shah et al., 2012). ABC
transporters are regularly found as upregulated in microarray experiments of insecticide resistant mosquitoes (Witzig, 2012; Jones et al., 2012b; Kwiatkowska
et al., 2013; Mawejje et al., 2013; Jones et al., 2013; Fossog Tene et al., 2013; Hemingway et al., 2013; Abdalla et al., 2014; Thomsen et al., 2014; Toé et al., 2015).
Cuticular resistance.
other species, reductions in the rate of cuticular penetration have been associated with resistance. In An. gambiae both genes encoding structural
proteins within the cuticle and those encoding enzymes which catalyse key steps in the biosynthetic pathway of the outer layer of the cuticle (cuticular
hydrocarbons) have been found up-regulated in multiple pyrethroid resistant populations (Awolola et al., 2009; Jones et al., 2013). In addition, cytochrome p450s are also involved in Drosophila cuticular hydrocarbon synthesis, with
CYP4G16 and CYP4G17 homologs (Qiu et al., 2012). Thickening of the cuticle is a putative mechanism to limit uptake of the insecticide through the abdomen of the mosquito. Ongoing studies are investigating the rate of uptake of insecticides in susceptible and resistant populations and comparing their CHC composition.
Transcriptional control of xenobiotic response.
Very little is known about the transcriptional control of xenobiotic detoxification in Dipteran species. In mammalian systems, Aryl- hydrocarbon receptor (AHR) and NRF2 have been shown to be key regulators of drug-metabolising enzymes through binding xenobiotic and antioxidant response elements (XRE/ARE) (Miao
et al., 2005). In black swallowtail caterpillars, Papilio polyxenes and corn earworms, Helicoverpa zea the expression of Cytochrome P450s have been shown to be regulated by the action of XRE binding in response to toxic
compounds (Brown et al., 2005; Zhang et al., 2010). In the case of P. polyxenes
the binding response was shown to be through AHR in a homologous manner to mammalian systems (Brown et al., 2005). Despite these links in Lepidopteran species, the Drosophila homologue spineless appears to play only a
2006). Just two transcription factors have been linked to insecticide resistance in Drosophila: Maf-S to DDT (Misra et al., 2011; Misra et al., 2013)and
Methoprene-tolerant to methoprene and pyriproxyfen(Charles et al., 2011; Zhang et al., 2011; Zou et al., 2013). These are described in more detail in subsequent chapters.
Microarray Analysis.
Microarray and enrichment analysis.
No gold standard currently exists for the analysis of microarray data, with different groups employing different methods, resulting in variation in the differentially expressed genes identified. Many tools are currently available for analysis, including several packages for R (Smyth, 2004; Rossell, 2009) and graphical user interface based tools (Mehta & Rani, 2011), such as MeV (Pan, 2002). Linear models are often applied, which are a generalisation of linear regression, taking into account multiple variables; the limma (Smyth, 2004) package in the statistical software R and variations of ANOVAs most often found in the literature. All methods available within R require pre-processed data, which in itself produces variability in the data, with different methods of
background correction (Kooperberg et al., 2002; Ritchie et al., 2007), within and between array normalisation (Yang et al., 2002; Bolstad et al., 2003; Smyth & Speed, 2003; Yang & Thorne, 2003; Irizarry et al., 2003; McGee & Chen, 2006).
Comparing across multiple arrays, with different experimental methods leads to additional challenges. These comparisons can be analysed using a venn-diagram like approach, using the GaGa package in R (Rossell, 2009). The GaGa analysis technique differs from the traditional approach by attempting to discern patterns across several independent microarray datasets, resulting in a fold change that is a direct multiplier between the two original fold changes. GaGa works by modelling the gene expression data by fitting a gamma-gamma
distribution (Rossell, 2009) and resulting in specified groups that show a similar pattern across genes or a different expression pattern between one or several groups.
Microarray data analysis problems are further confounded by the long gene list outputs, with no obvious biological meaning (Koschmieder et al., 2012). These long gene lists require interpretation, with several popular methods available, including DAVID analysis (Huang et al., 2007; Huang et al., 2008a), KEGG
pathway analysis (Kanehisa & Goto, 2000) and GO term enrichment (Ashburner
et al., 2000). Some of these tools are available for Anopheles specific analysis, though the data is often based on Drosophila homologs and is thus, less complete (Consortium, 2003; Lyne et al., 2007). A dedicated Anopheles online database is available but currently, without any enrichment analysis tools (Lawson et al., 2009).
Pathway analysis is an important step from a gene centric approach to
hampered by the lack of knowledge of complete pathways within insects. KEGG (Kanehisa & Goto, 2000) and Biocarta (Nishimura, 2001) are the most complete pathway databases; however, neither contain any fly specific pathways, being based around human and E. coli metabolic processes. Furthermore, pathway analysis currently suffers from the failure to take into account any form of pathway hierarchy, with genes higher up in a given pathway likely to have greater affect than those at the terminus (Tarca et al., 2009). Numerous methods have been developed to improve pathway analysis, with different statistical techniques and completely new methods being employed (John Tomfohr, Jun Lu, 2005; Werner, 2008; Tarca et al., 2009; Khatri et al., 2012; Huang & Lin, 2013).
In addition to large genes lists, microarrays offer a rich source of data that is difficult to interpret. Using correlation networks, it has previously been
demonstrated that biological patterns can be inferred (Stuart et al., 2003; Mutwil
et al., 2010). A variety of methods exist for the production of clusters within correlation networks, such as cliques/factions, MCMC models and Bayesian methods (Stuart et al., 2003; Mutwil et al., 2010). By using a strict correlation cut off and a priori knowledge, these networks can give rise to clusters showing similar patterns of expression patterns. These data can allow inference of pathways or functionality of the clusters.
with similar experimental design can add confidence to candidate selection and allow identification of relationships between transcripts that were missed in stand-alone experiments (Tseng et al., 2012).
Hypotheses
1) Structure specific microarray experiments will reveal patterns of transcript expression and novel insecticide resistance candidate transcripts missed using whole organism microarrays.
2) A meta-analysis based approach will reveal relationships between arrays and transcripts and identify novel insecticide resistance candidate transcripts.
Study One: Analysis of gene expression in different body parts.
Mosquito rearing conditions
The An. gambiae used in these experiments were all reared under standard insectary conditions at 27oC and 70-80% humidity under a 16:8 hour
photoperiod. The N’Gousso strain is originally from Cameroon and is susceptible to all classes of insecticide (Harris et al., 2010). N’Guosso is the M molecular form of An. gambiae, recently re-classified as a separate species, An. coluzzi (Coetzee et al., 2013). In contrast, the Tiassalé strain from Côte D'Ivoire is resistant to all classes of insecticide (Edi et al., 2012; Edi et al., 2014a). This strain was colonised from the field site in 2012 and is a mixture of the M and S molecular forms. At the time of the study, the LD50 for the Tiassalé strain was 68 and 81 fold higher than
the corresponding value for the N’Gousso strain for permethrin and deltamethrin respectively. Further details of the resistance profile of this strain are contained within the references (Edi et al., 2012; Edi et al., 2014a).
Microarray experiments
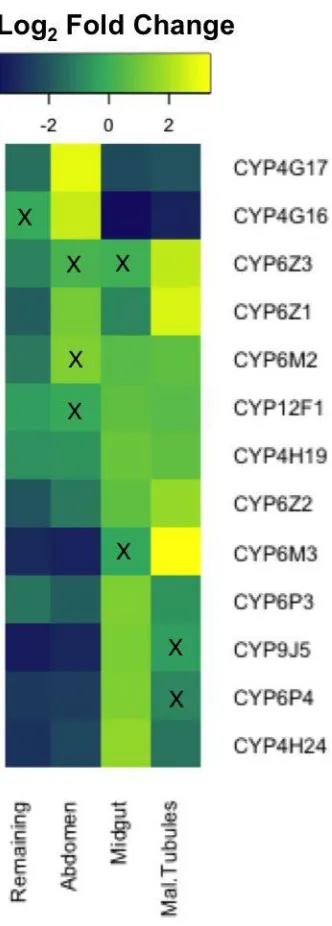
In this section, P. Pignatelli performed all preparation for cRNA, C. Jones, V. Ingham and P. Pignatelli performed the hybridisations and subsequent scanning. RNA was extracted from three dissected body parts: the malpighian tubules, the midgut and the abdomen integument (containing the fat body but also epidermal, neuronal, muscle and oenocyte cells) with the remaining undissected body parts forming a fourth sample group. Mosquitoes were collected between the hours of 8am and 2pm and dissected immediately on a CO2 block. Post dissection, each
using PicoPure RNA Isolation kit (Arcturus), from 12 three-five day old non-blood fed, presumed mated females. The quantity and quality of the RNA was assessed using a nanodrop spectrophotometer (Nanodrop Technologies UK) and Bioanalyser (Agilent) respectively. Four biological replicates were prepared for each body part per strain. RNA from the four dissections was pooled according to the proportion of RNA extracted from each body part to reconstitute the ‘whole organism’ (7%, 6%, 24% and 63% RNA from abdomen integument, malpighian tubules, midgut, and remaining material respectively). The use of a reconstituted reference sample minimised potential sources of bias that could have arisen from circadian changes in gene expression and changes in the proportion of the M or S molecular form in the different biological replicates. 100ng of RNA was amplified and labelled with Cy3 and Cy5, using the Two colour low input Quick Amp labelling kit (Agilent) following the manufacturer’s instructions. Samples were then purified (Qiagen) with the cRNA yield and quality assessed using the nano-drop and Bioanalyser respectively. RNA from each Tiassalé body part was competitively hybridised with the respective N’Gousso body part, as well as each body part from the resistant and susceptible strain being compared to the re-constituted whole organism. Dye swaps were performed on two out of four technical replicates for each array, to correct for dye bias. Labelled cRNAs were hybridised to the whole genome 8x15k Anopheles gambiae array (ArrayExpress accession number A-MEXP-2211). Microarray hybridisation, washing and scanning were performed according to previously described protocols (Mitchell
Microarray analysis
The resulting data were analysed using R. Within-array normalisation was carried out by Loess, and between array normalisation by Aquantile both found within the limma package (Smyth, 2004). Signals were corrected for dye by performing and correcting for dye swaps. The limma package (Smyth, 2004) was used to fit linear models to normalised corrected signals to assess differential expression using a design matrix to infer contrast matrices where necessary. All parameters used were default. A bespoke pipeline using the GaGa package (Rossell, 2009) was used to fit gamma-gamma models of variation to normalised corrected signals, in order to assign probes to one of two patterns of expression: X equals Y or X does not equal Y, where X represents the resistant population arrays and Y the susceptible arrays. These data were subsequently used to assess enrichment in each expression pattern, through GO term analysis using the TopGO package (Alexa & Rahnenfuhrer, 2010). A standard FDR adjusted p value cut off of p ≤ 0.05 was applied to all data describing localisation of detoxification candidates. A second stringent selection method was used to reduce the probe list based on previously published methodology (Morey et al., 2006), requiring that the following criteria were met: adjusted p-value ≤ 0.001, raw fluorescence intensity > median, and Tiassalé vs. N’Gousso ±0.485 Log2 fold change between the strains. All candidates
qPCR
RNA (4µg) from each biological replicate was reverse transcribed using Oligo dT (Invitrogen) and Superscript III (Invitrogen) according to manufacturer’s instructions. Quantitative real-time PCR was performed using SYBR Green Supermix III (Applied Biosystems) using an MX3005 and the associated MxPro software (Agilent). Primer Blast (NCBI) (Ye et al., 2012) was used to design primer pairs (Table 2.1). Where possible, primers were designed to span an exon junction but this was not achievable for six of the P450 genes (CYP325A1, CYP6P3,
CYP4G17, CYP6Z3, CYP12F2 and CYP6Z2) due to the high degree of sequence similarity. Each 20µl reaction contained 10 µl SYBR Green Supermix, 0.3 µM of each primer and 1µl of 1:10 diluted cDNA. Standard curves were produced using whole N’Gousso cDNA, in 1, 1:5, 1:25, 1:125 dilutions. qPCR was performed with the following conditions: 3 minutes at 95oC, with 40 cycles of 10 seconds at 95oC
and 10 seconds at 60oC. All amplification efficiencies of designed primers were
within acceptable range (90-120%), following MIQE guidelines (Bustin et al., 2009).
DESCRIPTION ID FORWARD REVERSE
CYP6Z3 AGAP008218 CCACGCAATTGCATTGGTCT TTCTACGCGCATGGGGAAAC
CYP6Z2 AGAP008217 ACTATCCGTTCGGAGCTGGT TGTGGCCTGGAACTTGAAC
CYP6P3 AGAP002865 TGTGATTGACGAAACCCTTCGGAAG ATAGTCCACAGACGGTACGCGGG
CYP12F2 AGAP008020 GCAACAAAGGTCGTTACGCA AATGTCAGGTGGGCTGTACG
CYP305A1 AGAP005656 TGAACGAGGTACACCGGAAC GTAACACCCAGTCGTGTCCC
CYP4G17 AGAP000877 TGACGGTGGACATTCTGCTC GTCACACATTTTCATGACAGCCA
Diminutive AGAP000646 CGTCCGATTCCGATGAAGAAA CGAGGCGGTGCGTATCTTG
Unknown AGAP001717 TTTGCCATTGTCCCGTTTGC AACTGTTTCGGTTCGGTGGT
Xanthine Dehydrogenase
AGAP006226 CTAATCTCGGCTGACACGC GCTGTTAGCTTTGTGCACCTT
LRIM8B AGAP007456 ACGATGACGATCACACGGATT CGTCACGCACTAGACAGGTT
Semialdehyde Synthase
AGAP008632 GTTTATGCACGTTGGACCCG TCCGATCGATTTGGGCATCA
Unknown AGAP010047 TAGCTGCTACGACGAATCGC ACTGCCACATCCAGCAACAT
Short-Chain Dehydrogenase/Redu ctase
AGAP011852 CGAACTCGTTCCACAATGCG ACAATGACCGCCGGATTGAC
EF AGAP005128 GGCAAGAGGCATAACGATCAATGCG GTCCATCTGCGACGCTCCGG
Table 2.1: qPCR primer list. Forward and reverse primers used for all qPCR reactions. All primer products are between 80 and 150 base pairs and follow MIQE guidelines.
Preparation of antibodies
All antibody staining and confocal microscopy was performed by J Vontas et al, University of Crete.
Fragments encoding unique peptides for CYP6Z1 and CYP4G17 were cloned into the pET 16b vector. Upon expression, the resulting His-tagged peptide was purified to homogeneity by Ni-NTA affinity chromatography and used to raise rabbit polyclonal antibodies. The CYP6Z1 peptide sequence was: VALRDLNNPDSFINNIRTAGVFLCPGLLKFTGINSLSPPMKKFTTEVISSHLHQRETGQ VTRKDFIQMLTDLRRKAGSSGEETLTDA and the CYP4G17 peptide: KRQLKIHLRLDPLFNLTGVKKEQERLLQIIHGLTRKVVREKKQLYERQMAEGKMPSPS LTEIIGKEEKPGEGQLGGSPAFISQ. The antibody for CYP6Z2 was a gift from Dr Mark Paine (LSTM, UK). Rabbit antibodies to CYP6Z2 were prepared to the C terminal peptide sequence MRIDHRK by Moravian Biotechnology, Brno, Czech Republic.
Immunofluorescence and microscopy
Female mosquitoes (three-five days old) were fixed in cold solution of 4% paraformaldehyde (PFA) (methanol free, Thermo scientific) in phosphate-buffered saline (PBS) for four hours and then were cryo-protected in 30% sucrose/PBS at 40 C for 12 h. Finally, mosquitoes were immobilized in optimum
Immunofluorescent analysis, followed by confocal microscopy, was performed on longitudinal sections of frozen pre-fixed mosquito specimens. More detailed, 10um sections, obtained in Leitz kryostat 1720 digital, were washed (three x five minutes) with 0.05% Tween in PBS and blocked for three hours in blocking solution (1% Fetal Bovine Serum, biosera, in 0.05% Triton/PBS). Then, the sections were stained with rabbit primary antibodies in 1/500 dilution, followed by goat anti-rabbit (Alexa Fluor 488, Molecular Probes) (1/1000) that gave the green fluorescence. Also To-PRO 3-Iodide (Molecular Probes), which stains DNA specifically (red fluorescence), was used, after RNAse A treatment. As controls, pre-immune serums (in 1/500 dilutions) and anti-rabbit (Alexa Fluor 488, 1/1000) were tested, in parallel with a-P450’s to check specificity of each primary antibody. Finally images were obtained on Leica TCS-NT Laser Scanning microscope using the 40x-objective.
Study Two: Meta-analysis
Microarray analysis
Microarray datasets, and associated metadata were provided by members of the Department of Vector Biology at LSTM. All microarrays were analysed using the limma R package, applying linear models to correct and normalise data, inferring differential transcript expression. Data was normalised using affycoretools (MacDonald, 2008). Both within (loess), and between (aquantile) array
The data had been obtained using two different experimental designs. For some experiments, RNA extracted from one resistant strain was compared directly with RNA extracted from a susceptible strain, in other instances, complete loop designs were used, comparing each extracted RNA with multiple strains. Both R vs S and complete loop methodologies were represented in the arrays. In the case of complete loop designs, a design vector with susceptible population as the reference was used to calculate the contrast matrix. False discovery rate testing was used for multiple test correction. All other parameters were kept as default. (Code available at:
https://github.com/VAI3064/PhD-Code/blob/master/limma%20function.R,
https://github.com/VAI3064/PhD-Code/blob/master/MyNormalizeBetweenArrays.R,
https://github.com/VAI3064/PhD-Code/blob/master/MyNormalizeWithinArrays.R,
https://github.com/VAI3064/PhD-Code/blob/master/myMA.RG.R,
https://github.com/VAI3064/PhD-Code/blob/master/myMA2.RG.R)
Metadata collection
Metadata associated with each array was collected, including insecticide
exposure, geographical location, elevation, species and resistant and susceptible strain. A single metric for geographical distance was calculated in two ways; firstly, inputting longitude and latitude into a PCA analysis and taking
component one as the measure or secondly, by producing generalised distances by drawing five equally sized blocks across the African continent. In order to determine the importance of these factors, the variance associated with each was calculated using η2 and ω2. ω2 is an unbiased estimator and was therefore used
𝜂2 = 𝑆𝑆𝑇𝑅𝐸𝐴𝑇𝑀𝐸𝑁𝑇 𝑆𝑆𝑇𝑂𝑇𝐴𝐿
𝜔2 = 𝑆𝑆𝑇𝑅𝐸𝐴𝑇𝑀𝐸𝑁𝑇 − (𝛼 − 1) 𝑀𝑆𝐸𝑅𝑅𝑂𝑅 𝑆𝑇𝑂𝑇𝐴𝐿 + 𝑀𝑆𝐸𝑅𝑅𝑂𝑅
SS= Sum of squares, MS = Mean square, (𝛼 − 1) = degrees of freedom.
Clustering
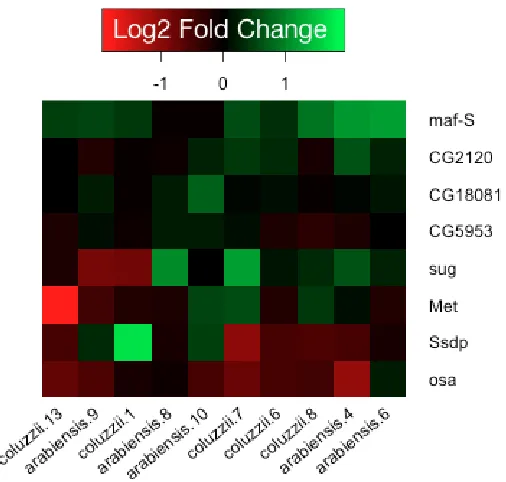
Data to be clustered was split into data subsets, dependent upon the number of arrays (n) each transcript was significant in (p ≤ 0.05). For all available arrays: n > one, n >10 and n > 20. A smaller subset of arrays was also used to reduce the experimental variables; in this instance: An. coluzzii arrays exposed to a
pyrethroid and compared to N'Gousso susceptible reference and An. arabiensis
array exposed to a pyrethroid. In the case of multiple arrays for the same experimental subset, only a unique resistant population was included. For the reduced subset: n > one, n > five and n > eight. Hierarchical clustering and factor analysis were performed on the relative fold changes of the datasets, with
hierarchical clustering using Euclidean distance as the preferred distance metric and following psych guidelines (Revelle, 2015 1.5.6) for factor analysis. To allow visualisation of the correlation or anti-correlation of the arrays, factor analysis was also used. Correlation matrices used in factor analysis and visualisations were performed using default settings in R. The optimal number of clusters for each subset was determined using the nFactor R package, which uses Kaiser rule, Cattell's scree test and Horn's parallel analysis to calculate. (Code available at:
Enrichment
Each cluster was split into up and down regulation across each group of arrays -
An. coluzzii arrays and An. arabiensis arrays. The resultant gene lists were searched for detoxification gene family members (cytochrome p450s, GSTs, UDPs, COE/CCEs and ABCs), GO term, domain, reactome and pathway
enrichments. Enrichments were performed using DAVID and Flymine, which also display publication enrichment. The phyper function in R was used to determine enrichment where stated. Significance was determined using p ≤ 0.05.
GO term attribution
GO terms were assigned using Blast2Go software. Peptide sequences were extracted from BioMart for the significant transcripts (p ≤ 0.001) in each array. These peptides were used to BLASTp, InterPro scan, map, annotate and produce annotation statistics. Annotation statistics were outputted for each of the three GO term categories and concatenated into one file after running GOSlim
(http://geneontology.org/page/go-slim-and-subset-guide).
GaGa analysis
A bespoke GaGa (Rossell, 2009) pipeline was used to assign all transcripts into predefined patterns, using a gamma-gamma distribution model; in this case An. arabiensis and An. coluzzii following either (a) the same pattern (b) a different pattern. As with the limma analysis, the same corrections were performed for array normalisation. (Code available at:
https://github.com/VAI3064/PhD-Code/blob/master/GaGaFunction.R,
https://github.com/VAI3064/PhD-Code/blob/master/MyNormalizeBetweenArrays.R,
https://github.com/VAI3064/PhD-Code/blob/master/MyNormalizeWithinArrays.R,
https://github.com/VAI3064/PhD-Code/blob/master/myMA.RG.R,
https://github.com/VAI3064/PhD-Code/blob/master/GO.R,
https://github.com/VAI3064/PhD-Code/blob/master/GO_test2.R,
https://github.com/VAI3064/PhD-Code/blob/master/all_orthologs_search.R,
https://github.com/VAI3064/PhD-Code/blob/master/anopheles_descriptions2.R,
https://github.com/VAI3064/PhD-Code/blob/master/colouring.R,
https://github.com/VAI3064/PhD-Code/blob/master/colourmatrix.R,
https://github.com/VAI3064/PhD-Code/blob/master/compare_lists.R,
https://github.com/VAI3064/PhD-Code/blob/master/culex_with_anopheles2.R,
https://github.com/VAI3064/PhD-Code/blob/master/fold_changes2.R,
https://github.com/VAI3064/PhD-Code/blob/master/full_descriptions2.R,
https://github.com/VAI3064/PhD-Code/blob/master/gene_means.R,
https://github.com/VAI3064/PhD-Code/blob/master/heatmaps.R,
https://github.com/VAI3064/PhD-Code/blob/master/heatmap_production.R,
https://github.com/VAI3064/PhD-Code/blob/master/match_drosophila2.R,
https://github.com/VAI3064/PhD-Code/blob/master/orthologs2.R,
https://github.com/VAI3064/PhD-Code/blob/master/orthologs_with_anopheles2.R,
https://github.com/VAI3064/PhD-Code/blob/master/pathway_test.R,
https://github.com/VAI3064/PhD-Code/blob/master/pathways2.R,
https://github.com/VAI3064/PhD-Code/blob/master/reactome.R,
https://github.com/VAI3064/PhD-Code/blob/master/reactome_test.R,
https://github.com/VAI3064/PhD-Code/blob/master/split_for_drosophila.R)
Transcription factor identification
A transcription factor database, FlyTF.org, exists for Drosophila, which includes a list of curated putative transcription factors (Adryan & Teichmann, 2006). These data were downloaded and converted to Anopheles homologs using FlyMine (Lyne et al., 2007). These homologs were used to search the transcript list
searched for transcription factors significant in at least eight out of 10 of the arrays.
Study Three: Deltamethrin candidate search
Mosquito rearing conditions
Mosquito rearing conditions for Tiassalé and N'Gousso strains are described in Study One. The strain VK7 is an An. coluzzii population originating from Valle de Kou, Burkina Faso. VK7 is resistant to both DDT and deltamethrin but is
susceptible to bendiocarb, with an LD50 compared to N'Gousso at the time of the
study of 11-fold for permethrin and 13-fold for deltamethrin.
qPCR
qPCR was performed on both whole organism extractions and dissected body parts. The qPCR methodology and primers are described in Study One and Tables 2.1 and 2.2.
Transcript ID Forward Sequence Reverse Sequence
SAP2 (AGAP008052) GCAGCTTGAGAGCGTCTTCT GAAAGCGATGGCGACGAACA
EF-like protein
(AGAP002603)
AAAACCATCCCAGCAAACGTG TCGTAATCATCGTAGACAGCG
CYP6Z3 (AGAP008217) CCACGCAATTGCATTGGTCT TTCTACGCGCATGGGGAAAC
UGT302A1 (1) (AGAP006222)
TGGCTGGGGTATCGGAGTTA GCAGTATAGCTTGGGTCACCG
PT3 (AGAP004262) AAAGGAACTGAAGCCTGCGA TCTTCCAAATGTTTCTTAGTTCCCT
Acyl-CoA Dehydrogenase
(AGAP008769)
TTCTTCGAGGAGGACGGCTAC CATCAGGCCCATCTCCCACA
-Crystallin Chain B
(AGAP007160)
CGGGCATCAGTATCGCTAGG GGGCTTCAACACCGATGGAA
Table 2.2: Primer sequences for qPCR. Sequences of primers used in all qPCR reactions.
RNAi
PCR was performed using Phusion® High-Fidelity DNA Polymerase (Thermo Scientific) following manufacturer’s instructions and primer sets with a T7 promoter sequence at the 5' end of both the sense and antisense primers (Table 2.3). Primers were designed to have an asymmetric product sequence with a length of 300-600bp, a GC content of 20-50% and no more than three
consecutive nucleotides. PCR was performed with the following cycle: three minutes 98oC, 35 cycles of seven seconds at 98oC and 10 seconds at 72oC, with a
final hold at 72oC for seven minutes. PCR products were resolved on 1.5%
agarose gels for 45 minutes and the correct length amplifications identified. The PCR products were purified using a Qiagen QIAquick PCR Purification kit
following manufacturer’s instructions. dsRNA was synthesised using a Megascript® T7 Transcription (Ambion) kit, with a 16 hour 37oC incubation,
following manufacturer's instructions. The dsRNA was then cleaned using a MegaClear® Transcription Clear Up (Ambion) kit, with DEPC water, twice heated at 65oC for 10 minutes, to elute the sample. The resultant dsRNA product
was analysed using a nanodrop spectrometer (Nanodrop Technologies, UK) and subsequently concentrated to 3μg/μl using a vacuum centrifuge at 35oC.
presumed mated, non-blood fed females that were immobilised on a CO2 block.
As a control non-endogenous GFP dsRNA was injected at the same amount and concentration.
Transcript ID Forward Sequence Reverse Sequence
SAP2 (AGAP008052) taatacgactcactataggg TTCTCGTTCCGGTTGCTTCA
taatacgactcactataggg
TAGTAGACCCCATTCCCCACTT
SAP2 (2) (AGAP008052) taatacgactcactataggg
TTCAAGTGCCTGATGGACGA taatacgactcactataggg AGTATCACAAAGCGACCACCAT EF-like protein (AGAP002603) taatacgactcactataggg ATGTCTCGCCACCGAAATGT taatacgactcactataggg AAGCTTCTTCTCCGAGCGTT
CYP6Z3 (AGAP008217) taatacgactcactataggg
GACACTGCAGCGTTTGACTA
taatacgactcactataggg GCAGCTTTGCCATTGCTTCT
UGT302A1 (1) (AGAP006222)
taatacgactcactataggg
TGGGTTCCATGTCAACCGTAA
taatacgactcactataggg CATTCGACGGGAAATCGTCT
UGT302A1 (2) (AGAP006222)
taatacgactcactataggg TCTGCTGAGTTGCACCGAAT
taatacgactcactataggg ATGAGATGCTTTGCGCCATC
Table 2.3: Primer sequences for dsRNA. Sequences of primers used for dsRNA synthesis, each sequence appended to the T7 binding site (shown in lower case).
Localisation of candidate genes
Induction
SAP2 induction assays were carried out on three-five day old, presumed mated, non-blood fed Tiassalé females at three time points post deltamethrin bioassay tube exposure: 24 hours, 48 hours and 72 hours. These time points were compared to an unexposed pool of female mosquitoes after qPCR.
Bioassays
WHO bioassay tube test kits (World Health Organization, 2013) were used under standard conditions for one-hour exposures to 0.05% deltamethrin and 30 minute exposures to 0.01% bendiocarb impregnated papers. Mosquitoes were then left in a control tube, under insectary conditions for 24 hours and mortality recorded.
Survival analysis
72 hours post injection three pools of 25 injected and 25 uninjected adult female mosquitoes were transferred into a cup and fed twice daily with 1:10 glucose solution. Numbers of dead mosquitoes were recorded every 24 hours as a proxy for fitness. Statistical analysis and graphical representation was produced using the survival package (Therneau & Grambsch, 2000) in R.
Localisation Enrichment
MozAtlas (Chintapalli et al., 2007) and data generated in Chapter 1 (Ingham et al., 2014) were used to identify body parts in which chemosensory transcripts were expressed in An gambiae.
Study Four:
Keap1-Maf-S-cnc
pathway
Probability of a transcript being differentially regulated in n arrays by chance
success, in this case significance, was calculated using the average number of all significant transcripts in all arrays. The probability of success, over all arrays was 0.4692 and that of failure, 0.5308.
Enrichment tests
Enrichments were performed using DAVID functional annotation for transcript lists that were longer than 100 transcripts. Smaller transcript lists were assessed for specific enrichments using a hypergeometric test. In both cases, significance was determined as p ≤ 0.05.
Mosquito rearing conditions
See Study One: Mosquito rearing conditions for details.
RNAi
RNAi was performed as in Study Three: RNAi with primers from Table 2.4.
RNAi Transcript Forward Sequence Reverse Sequence
Maf-S (1) (AGAP01405-RA) taatacgactcactatagggAGGT GTGTGCTGTGCAAGAT
taatacgactcactatagggAGGT GTGTGCTGTGCAAGAT
Maf-S (2) (AGAP01405-RA) taatacgactcactatagggACG
ATGAGCTGGTGTCGATT aatacgactcactatagggAGTGAAACATTCGGCACGGT
GFP taatacgactcactatagggAGAAC
GTAAACGGCCACAAGTTC taatacgactcactatagggAGACTTGTACAGCTCGTCCATGCC
Table 2.4: RNAi primers. RNAi primers used in the synthesis of dsRNA, each with a T7 promoter region (shown in lower case).
qPCR
Transcript ID Forward Sequence Reverse Sequence
CYP6M2
(AGAP008212-RA)
TACGATGACAACAAGGGCAAG GCGATCGTGGAAGTACTGG
GSTD3 (AGAP004382-RA) CCGCACATTAAGGGATGGGT CGCTTTGGTAGCTTCCTCCA
CYP4H17
(AGAP008358-RA)
TACTGACCAGTGCCTTGCTG GTGCCATTCATTTCCATGTCCT
[image:55.595.88.559.71.272.2]ABCA3 (AGAP007504-RA) CACGGACATCGTTGGTGGTA TCGGTGGGATCTTCCTCCAT
Table 2.5: Primer sequences for Maf-S knockdown qPCR. Sequences of primers used in all qPCR validation.
Microarrays
A whole-genome microarray approach was used to determine the effect of Maf-S
knockdown on transcriptional profiles. The transcriptional profiles of Maf-S
knockdowns were compared against a GFP injected control. All mosquitoes used in the microarray were adult females from the Tiassalé strain, five to eight days old. RNA was extracted as above 72 hours post injection. The protocol used for the microarray is as in above, Study One: Microarray experiments. Submitted to ArrayExpress, accession E-MTAB-4042.
Microarray analysis
For microarray analysis methods, see Study Two: Microarray analysis.
Pathway analysis
KEGG pathway (Kanehisa & Goto, 2000) was explored using both the colour pathway web interface and the Cytoscape 3.1 plugin, CytoKEGG.
Correlation networks
4]. To identify only arrays with a strong correlation or anti-correlation, only those transcripts with a correlation of ±0.8 were used. These data were extracted and visualised using log2 fold change and array index.
Study Five:
Met
involvement with public health insecticides
Mosquito rearing conditions
See Study One: Mosquito rearing conditions for details.
RNAi
RNAi was performed as in Study Three: RNAi with the primers in Table 2.6.
RNAi Transcript Forward Sequence Reverse Sequence
Met (AGAP006022-RA) taatacgactcactatagggAACGAG AATGGGCTTTAGGAA
taatacgactcactatagggTGGTCCG AAATGGTGTAAGG
Met (AGAP006022-RA) (2) taatacgactcactatagggTTAGC GCGTGTGATGAAGGT
taatacgactcactatagggTGCACC
ACTTTGGTATCGCT
GFP taatacgactcactatagggAGAAC
GTAAACGGCCACAAGTTC
taatacgactcactatagggAGACTT
GTACAGCTCGTCCATGCC
Table 2.6: RNAi Met primers. Primer list used in dsRNA construction for Met.
qPCR
qPCR was performed as in Study One: qPCR using primers listed in Table 2.7, housekeeping controls used were standard EF and S7 (Table 2.1).
Transcript Forward Sequence Reverse Sequence
Met (AGAP006022-RA) TGCGGGTGGACTATGTGTTT ACGTCACCGTGAGCAGAAAT
Table 2.7: Met qPCR primers.
Microarrays
A whole-genome microarray approach was used to determine the effect of Met