Faculty of Science and Technology
A Methodology on Analyzing
Pressurized Lip Seal Geometry
under Misalignment through Glass
Thomas Giorgio B.Sc. Thesis August 2019
Supervisors:
Contents
1 Introduction 1
1.1 Leakage . . . 2
1.1.1 Lip seal Geometry . . . 2
1.1.2 Static Eccentricity . . . 3
1.1.3 Pressure Difference . . . 3
1.2 Previous research . . . 4
1.3 Problem Formulation . . . 4
2 Methodology 6 2.1 test rig . . . 6
2.1.1 Turning table, mirror, and camera placement . . . 6
2.2 Image Processing . . . 7
2.2.1 Boundary Detection Method . . . 8
3 Results and Discussion 14 3.1 Methodology Results . . . 14
3.1.1 Calibration . . . 14
3.1.2 Contact Area Width Measurement . . . 15
3.1.3 Method validity . . . 16
3.2 Lip Seal Deformation Results . . . 17
3.2.1 Deformation under Pressure Differences . . . 17
3.2.2 Deformation under Misalignments . . . 18
3.2.3 FEM results on Deformation under Pressure Difference and Misalignments . . . 20
3.3 Discussion . . . 22
3.3.1 Methodology Discussion . . . 23
3.3.2 Lip Seal Deformation Discussion . . . 25
4 Conclusions 30 4.1 Future Research . . . 30
4.2 Acknowledgement . . . 30
References i
Appendices
A Boundary detection codes iii
Chapter 1
Introduction
Sealing has been used in many engineering applications. Aegir-Marine BV uses
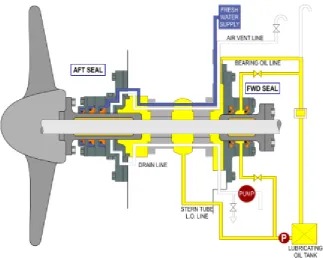
[image:4.595.151.475.462.720.2]sealing on stern-tube. The stern-tube shaft is a part that connects propeller and an engine on a ship where this two parts are separated by a sealing component namely stern-tube seal. It prevents oil leakage from the engine part to the sea and vice versa. The stern-tube seal is built up from radial-shaped elastic material (lip seal) and clamped between two metal disk which are known as the housing. As the ship size increases, the stern-tube depth increases with respect to the sea level resulting on unbalance pressure between the water side and the oil side. Therefore, this research will deal with pressurized seal.
Figure 1.1: Stern tube seal configuration (Source: Marine Insight)
1.1 Leakage
The purpose of sealing is to prevent oil leakage, however, oil leakage still occurs in practice. Oil leakage occurred more often during static condition. [1]. When the contact pressure between the shaft and the lip seal is not high enough, microscopic leakage paths will start to appear in the contact width area and hence allowing the oil to pass through and causes leakage. The oil leakage is also dependent on the seal performance. The seal performance is influenced by the loading and the geometry of the seal [2]. To understand more about the seal performance, variables and parameters are needed to be explained before addressing the problems. The variables and parameters will be explained on the following subsections.
[image:5.595.134.523.345.668.2]1.1.1 Lip seal Geometry
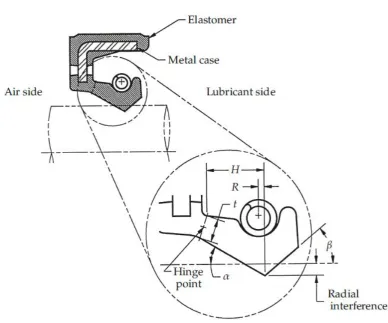
Figure 1.2: Lip seal Geometry (Source: Wennehorst, 2016)
lubri-1.1. LEAKAGE 3
cated conditions. By unbalancing the contact pressure distribution the maximum lies closer to the oil side, thus, the reverse pumping mechanism can be obtained. Due to this condition the pressure distribution is axial-asymmetric. By differentiating the angles size where the angleα(see figure 1.2 must be less thanβ, where the region α is also known as the air side and the β region is the lubricant or oil side. Sec-ond, the axial distance R between the seal lip contact band and the center-line of the spring [3]. It is necessary to define the lip-seal geometry in order to understand more about the deformation of the lip seal contact width and the lip seal deformation where these parameters commonly used to validate simulation model.
1.1.2 Static Eccentricity
Static eccentricity is a condition where a non-uniform clearances occurs in circum-ferential direction at both the oil and the air side of the seal. These clearances contributes to a non-uniform contact pressure distribution and contact width in the circumferential direction. Moreover, the axial position of the lip will vary in the cir-cumferential direction and the boundaries of the contact zone become slanted [4]. The misalignment under static eccentricity can be categorized into two types which will be explained further on the following paragraph.
Misalignment
The static eccentricity can be categorized into two types, which are; Bore eccentric misalignmentandangular misalignment. Bore eccentric misalignment is a condition
where the lip seal center is oftentimes not perfectly aligned with the center of the rotary shaft. This misalignment causes the lip to be pressed on one side and the contact force on another side is reduced, hence, the contact area between the lip seal and the rotary shaft is reduced. While angular misalignment is a state where one side of the lip seal is skewed on the axial direction causing the seal to stretch in a slanting oval shape around the shaft [5].
1.1.3 Pressure Difference
pressure difference applied (positive pressure difference is defined when the abso-lute pressure on the oil side is bigger than the air side) , the lip-seal contact area width increases and the thickness is radially equal along the shaft axis. On the other hand, the contact area width decreases as negative pressure difference is applied [5] [6]. The contact area width is not equal along the shaft axis when the bore-eccentric misalignment is introduced.
1.2 Previous research
As has been stated in subsection 1.1.3 and subsection 1.1.2, the contact area width will increased as the pressure difference increased and the deformed contact lip seal will be nonuniform on the circumferential direction. Therefore, It is necessary to capture this non uniformity deformed lip seal. FEM simulation has been done to predict the lip seal deformation, moreover, the actual measurement of the lip seal deformation has been used to validate the FEM model. Several researches have been done to obtain the lip seal deformation. The lip seal deformation is calculated by using quartz shaft and laser system. however this research focused on dynamic state of rotating shaft seals [7]. Using a similar setup, the static state contact area width measurement has been done by Twente university [6]. The lip seal deforma-tion is measured by using the misaligned distance which calculated by using total internal reflection (TIR) method. By using the difference in refractive indices be-tween the glass and air, the laser bounces back inside the shaft until the laser hit the seal-shaft interface, reflecting the laser. The reflected laser shows illumination of the contact interface and captured by using a camera Dinocapture 2.0. The lip seal
deformation is calculated on prescribed points around the shaft diameter and the result was interpolated between each measurement points. However the method of this measurement requires initial calibration for each picture that is taken. The calibration is required due to the eccentric misalignment between the center of the rotating disk and the center of the shaft. Another measurement that has been done by Stuttgart university is to inject epoxy in between the shaft. Letting the epoxy to so-lidify and removing the solidified epoxy, the lip seal deformation can be measured. However, by using this method, a new lip seal must be replace regularly for each measurement.
1.3 Problem Formulation
1.3. PROBLEMFORMULATION 5
problem due to the non-linearity of the geometrical, physical and boundary condi-tions. Consequently, the analytic solution is too complex to be derived, however, the contact problem still can be predicted and analyzed by using finite element method (FEM) [8]. Therefore, This research focuses on introducing a method to measure the contact area width boundary location and the deformed contact area width along the shaft circumference. To see how the contact area width and the contact area bound-aries deformed, as an illustration, see figure 3.12. However, the discussion over the deformation will be discussed in the corresponding chapter. Furthermore, compar-ing and discusscompar-ing the results with the existcompar-ing research. the boundary condition of this research is that all measurements will be treated in static condition. Therefore the time dependent variables on the lip seal deformation is neglected. In addition, temperature effects on the lip seal will be put aside. There are two independent variables that in this research will be tested on which are; the pressure differences between the air side and the oil side, and bore-eccentricity misalignment. To sum-marize, the problems can be formulated into two questions which are;
1. How to measure the lip seal deformation?
Methodology
The lip seal deformation is measured by using digital image processing tools from
matlabon the camera images obtained. By Using the total internal reflection method
(TIR) the contact area width can be visualized and the contact area width illumination is reflected to a 45 degrees skewed mirror and the image reflection is captured by a camera. The goal of this measurement is to measure the contact area width with respect to the location of the shaft and the lip seal deformation profile. The process of the measurement will be explained thoroughly in the following sections.
2.1 test rig
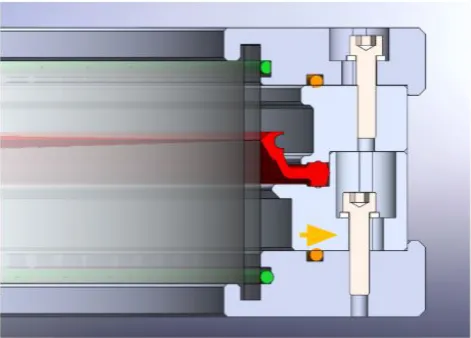
Before discussing further on the measurement of the lip seal deformation, under-standing the test rig is important. To measure the contact area width, a rubber lip seal is clamped between a glass shaft of 200mm diameter with aluminum frame (The red-colored part (see figure 2.1). the lip seal is seated on the bottom housing slot. The bottom housing slot is then screwed to a top housing slot. The misalign-ment can be achieved by sliding the bottom slot with respect to the bottom cover with allowed maximum misalignment of 1.5mm. The radial position ’zero’ is the reference point where the misalignment always applied on. In order to achieve the wanted mis-alignment, the reference point on the bottom slot is then pushed maximally towards the glass shaft and then from the opposing side is pushed slowly until the wanted misalignment is achieved.
2.1.1 Turning table, mirror, and camera placement
A turning table is placed in the center of the hollow cavity of the shaft where a fourty-five degrees skewed mirror is mounted on the turning table. The turning table is a two separated component which are the stator and the motor. The motor rotates
2.2. IMAGEPROCESSING 7
Figure 2.1: Test rig sectional view
[image:10.595.93.270.442.578.2]around the hollow part of the stator where stator makes sure that the eccentricity between the center of the shaft and the center of the motor are aligned. A camera is then placed on top of the mirror hence, the camera rotates simultaneously with the mirror taking images from 24 different points along the circumference. The distance between the camera and the mirror can be varied for as long the camera can capture a clear image. The reason of the placement between the camera and the mirror will be explained in the following section (see figures 2.2 and 2.3).
Figure 2.2: Mounted mirror on top of the rotating disk
Figure 2.3: Installed rotating disk inside the test rig
2.2 Image Processing
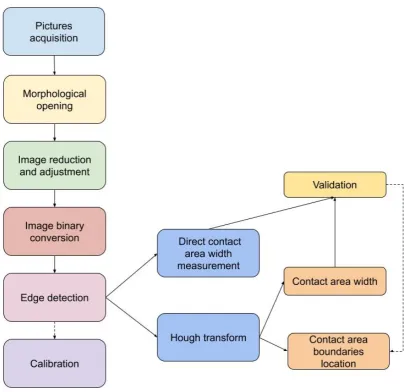
[image:10.595.357.534.448.580.2]technique and secondly, Hough transform approach is used to acquire the lip seal boundary location where from this acquired location, the contact area width can be calculated. Both approaches is required to be done where the reason of this will be discussed on the following chapter. To sum up, the image processing process is described on figure 2.4.
Figure 2.4: Flowchart of image processing
2.2.1 Boundary Detection Method
2.2. IMAGEPROCESSING 9
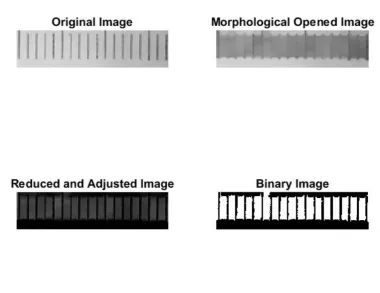
Figure 2.5: Image processing (Start from top left, top right, bottom left, and finally bottom right)
It is also important to note that the size of the image does not change when the image is cropped.
Morphological Opening
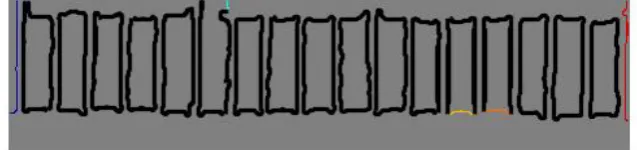
Figure 2.6: detected edge
Edge Line detection
Before the edges of the image can be detected, the reduced and adjusted image has to be converted into binary image. Using a built in Matlab function threshold,
the brighter part region is conserved. The threshold function will average the
gray-scale intensity level from whole picture, hence, the brighter colored region will set as ”1” (which is white) and ”0” (which is black) where this process resulted the binary image version. After the image converted into binary image, the edge detection function can be applied (see figure 2.6). Each boundary positions is stored into groups of vectors where each vector represents the boundary coordinates of each rectangular-shaped detected boundaries.
Contact Area Width
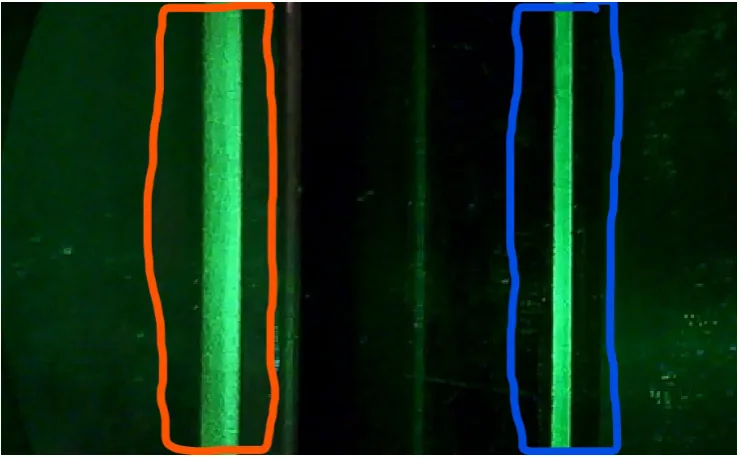
The method of image processing for contact area width is the same as the calibra-tion process. Color filtracalibra-tion can be used to have better image acquisicalibra-tion (Depends on which laser color is used). The contact area width is measured by measuring the absolute distance between two points that located on the same y-coordinate whereas on the calibration process to determined the pixel distance within 1mm. Knowing the separation distances in pixels, the distance is then converted into mil-limeter unit. By using this technique, the distance between the camera and the mirror is not necessary to be defined for as long the image taken is focused.
Lip Seal Deformation Profile
2.2. IMAGEPROCESSING 11
Figure 2.7: Contact area width image processing process
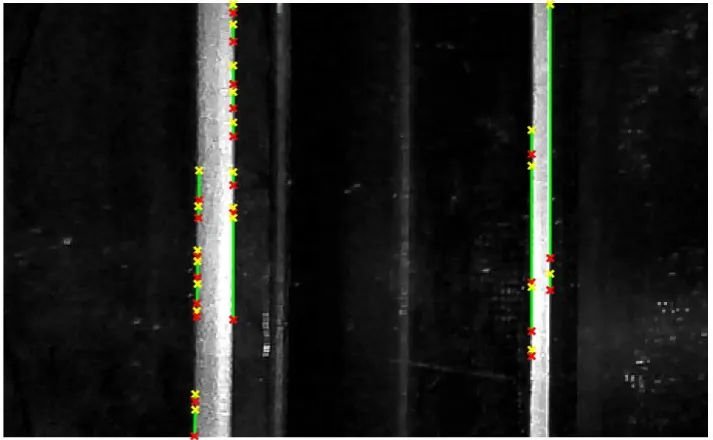
[image:14.595.128.498.473.702.2]Figure 2.9: Detected lines by using hough transform
seal contact area. The absolute distance is then taken from the right side edge of the bottom sealing to the edge of the contact area width boundaries.
The distance can be measured by Hough transform. The function of Hough transform is to detect lines that exist in a specimen. Before transforming the image with Hough transform, the image must be converted to binary image. Using the boundary detection method, the edge of the housing and the illuminating deformed lip seal can be identified. As can be seen on figure 2.10, the distance between x-coordinates between the housing and the lip seal contact area boundaries can be measured which resulted two different distances which are; the inner and outer boundaries positions. Finally by interpolating all the boundary locations, the lip seal deformation profile can be achieved.
Hough Transform
con-2.2. IMAGEPROCESSING 13
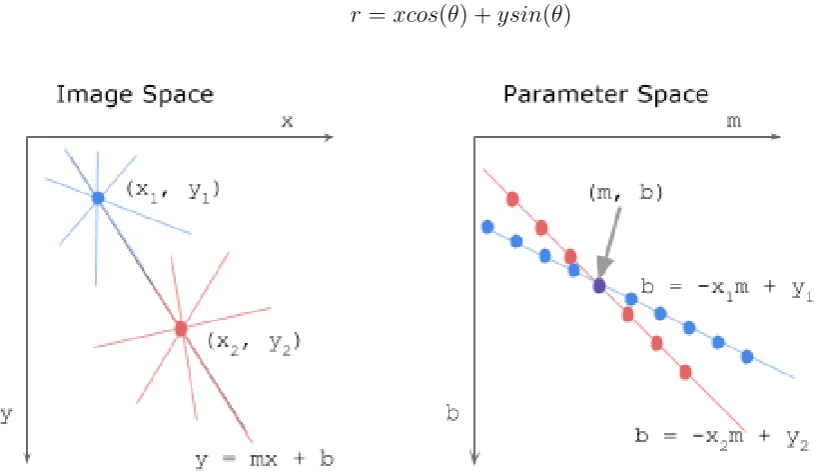
versely, the x coordinate on the XY-plane becomes the gradient on the parameter plane and y coordinate becomes the constant. On the parameter plane, using the x and y coordinates from the XY-plane, multiple values of m and b are run to construct lines based on a single coordinate. This process is repeated to every coordinates that lie on the XY-plane to the parameter plane. As the lines on the parameter plane intersect, the highest coordinate frequency where the lines are intersected, the coordinate is taken and fitted back to the real image plane, resulting in one solid line. However, matlab uses polar coordinates on the parameter plane where the line equation in polar coordinate is stated on equation 2.2
y=mx+b (2.1)
[image:16.595.82.496.302.540.2]r=xcos(θ) +ysin(θ) (2.2)
Results and Discussion
This chapter will discuss the results obtained from the methodology that has been explained in previous chapter. two major points that will be discussed in this chapter. First, the reliability of the methodology. As what has been explained in subsection 2.2.1, the two different approaches will be compared and discussed thoroughly. The second point is the result of the lip seal deformation where the result will be com-pared with FEM model and previous research.
3.1 Methodology Results
The methodology that has been done in this research requires two different ap-proaches (See 2.2.1). However both of the apap-proaches requires initial calibration, hence, the calibration result will be the starting point in this section. Thereafter, the two different approaches will be compared with each other.
3.1.1 Calibration
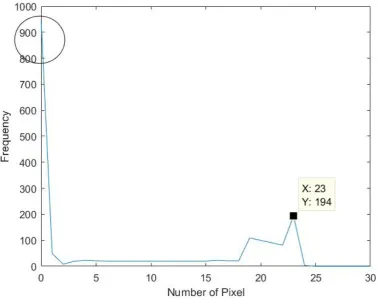
As can be seen on figure 3.1, the result is obtained by running for loop on the
boundary locations, and identifies between two coordinates located on the same y-coordinate. As the for loop identifies two coordinates, the absolute value between
the corresponding x-coordinates is taken. The result shows peak at the distance of 23 which means that the one millimeter distance is separated between 23 pixels. However, the plot also shows relatively high peaks between 18 until 24 pixels. This is caused by the edge detection approach. Looking back at figure 2.7, the boundaries detected also shows some squiggly lines resulting on this high peaks. Since these peaks have lower frequency than the number of frequency of 23 pixels, it can be considered as errors and can be neglected. Another point that need to be explained is the result on 0 pixel.
3.1. METHODOLOGYRESULTS 15
Figure 3.1: Absolute distance value between two x-coordinates (x-axis) of the boundaries and number of frequency (y-axis)
The frequency of 0 pixel is the highest due to thefor loop that runs through all the
boundaries locations that has the same y-coordinate. The result from 0 pixel is not important in this measurement, however, this result need to be clarified by virtue of clarity for the reader.
3.1.2
Contact Area Width Measurement
Figure 3.2: Measurement with various peaks Figure 3.3: Measurement with 1 peak
3.1.3 Method validity
[image:19.595.76.530.88.269.2]3.2. LIPSEAL DEFORMATION RESULTS 17
Figure 3.4: 0.6 Bar pressure difference with various misalignments
3.2 Lip Seal Deformation Results
This section will firstly describe the deformed lip seal profile under pressure differ-ence and various misalignments. Subsequently, the FEM result of the deformed lip seal profile under pressure difference and various misalignment will be described. The comparison between the measurement and the FEM simulation will be dis-cussed on the following section.
3.2.1 Deformation under Pressure Differences
Figure 3.5: Deformed contact area under 0.5mm misalignment with various pres-sure difference
Figure 3.6: Deformed contact area under 0.75mm misalignment with various pres-sure difference
3.2.2 Deformation under Misalignments
On figure 3.8 The 1.5mm misaligned lip seal shows sinusoidal-alike contact area boundaries location deformation profile, where the other two measurements does not show similarities on the sinusoidal alike deformation profile. However, on the air side, the measurements from the 1.5mm and 0.5mm misalignments show a jutted bump on the oil side of the lip seal. On the opposite side of the misaligned point, the 0.5mm and 0.75mm misaligned lip seal profiles shows a small engraved curvature at the π
[image:21.595.104.447.357.552.2]3.2. LIPSEAL DEFORMATION RESULTS 19
Figure 3.7: Deformed contact area under 1.5mm misalignment with various pres-sure difference
As the pressure difference is increased to 1.0 bar (see fig 3.9), the increasing contact area width at misaligned point are shown from all three measurements. In addition, the growth of the contact area width on the air side is longer than the oil side showing the jutted bump more conspicuous than the measurement under 0.6 bar pressure difference. At π
2 radial position of the shaft, the deformed lip seal
profiles of 0.5mm and 1.5mm show the sinusoidal-alike deformation profile, on the other hand, the 0.75mm misaligned lip seal profile does not show the similarity with the other two measurements, however the sinusoidal-alike boundaries profile can be seen on the oil side.
Figure 3.8: Deformed contact area under 0.6 bar pressure difference with various misalignments
Figure 3.9: Deformed contact area under 1.0 bar pressure difference with various misalignments
3.2.3 FEM results on Deformation under Pressure Difference and
Misalignments
[image:23.595.104.448.365.556.2]3.2. LIPSEAL DEFORMATION RESULTS 21
Figure 3.10: Deformed contact area under 1.4 bar pressure difference with various misalignments
contact area to grow. Another deformation is the oil side boundaries shifted towards the bottom housing. It is also necessary to be stated that the FEM simulation are performed using zero friction coefficient between the lip seal and the glass shaft and thus the contact width differ from the actual measurement which is measured on a non-zero friction coefficient.
The FEM simulation result of the deformed lip seal under zero pressure differ-ence and under various misalignments are shown on figure 3.12 where the mis-alignment is applied at radial position zero. Again, the simulation is simulated with zero friction coefficient between the lip seal and the glass shaft. Three observations can be identified from the simulation model. First, the contact area width increases where the misalignment applied at. This occurrence also observed by Bavel [4], in addition, Bavel’s observation also shows that the increase of the contact width on the air side is larger than the oil side. Second, the contact area boundaries around the misaligned point shifted upwards while the opposite of the misaligned point shifted downwards yielding a sinusoidal-shaped lip seal contact boundaries. Third, the contact area width from all measurements on figure 3.12 yield in a rela-tively equal width thickness at radial position of π
2 and 3π
2 making the contact area
Figure 3.11: Seal liner gap profile under various pressure differences (Source: Bor-ras, on going research)
3.3 Discussion
3.3. DISCUSSION 23
Figure 3.12: Lip seal deformation profile under 0 bar pressure difference various misalignment (Source: Borras, on going research)
Figure 3.13: Bavel’s observation when Lip Seal is applied with static eccentricity (Source: Bavel, 1997)
3.3.1 Methodology Discussion
During the execution of the methodology, the research encountered a problem dur-ing the image processdur-ing for the hough transform. As can be seen on figure 2.8 the image has bright color intensity compare to the background and therefore the detection of the boundaries by the program is relatively easy. On figure 3.14, the image acquired has an extreme low intensity level of red color thus the detected deformed boundaries is barely observed. To encounter this problem, red-colored filtration is used, resulting on relatively high intensity level which then converted into gray-scale image. Although the image is filtered with red color, the intensity level of the bottom housing is relatively high enough than the deformed lip seal, thus, the bottom housing is still captured in the gray-scale image.
[image:26.595.156.458.397.472.2]can be converted into binary image for boundary detection, the threshold function
detected only the bottom housing. However, from the function itself, the threshold intensity level is acquired. The measurement process can be separated into two steps. First, the detection of the bottom housing boundaries position which rep-resents the reference point and secondly, the detection of the lip seal boundaries. In order to achieve the first step, the threshold intensity level is inputted manually, where the inputted intensity level must be higher or equal to the intensity level that acquired from thethresholdfunction. Consequently, the inputted intensity level must
be lower than the intensity level that acquired from the threshold function in order
[image:27.595.115.459.388.621.2]to detect the lip seal boundaries position. However the inadequacy of manually in-putting the threshold intensity level comes with 2 drawbacks. Setting the threshold too low will yields of distorted image where the boundaries detected is not the actual boundaries, on the other hand, setting the threshold too high generates a total dark-ness on the image. To assure that the detected boundaries is correct, the detected boundaries is then compared with the gray-scale image as what presented on image 2.10. The manually filtered two steps image processing can be seen on figures 3.15 and 3.16.
3.3. DISCUSSION 25
[image:28.595.334.534.85.262.2]Figure 3.15: Low-filtered threshold binary image
Figure 3.16: High-filtered threshold binary image
3.3.2 Lip Seal Deformation Discussion
As has been explained on this chapter introduction, the FEM calculations will be compared with the actual measurement. To start with, the result from the applied pressure difference will be discussed. As the pressure difference is increased, the FEM simulation shows (see figure 3.11) two distinctions that already stated in sub-section 3.2.3. Both of the distinctions can also be seen on the actual measurement. The contact area boundaries shifted downwards due to the pressure difference that generates tangential force (see figures 3.5 , 3.6 and, 3.7) on the oil side towards the air side. As the pressure difference is increased more, the force acting on the oil side increases, causing the angle β to increase and the angle α to decrease (see figure 1.2) yielding the increase on the contact area width.
As the deformation of the pressure difference has been explained previously, now, the misalignment variable is added to the deformation of the lip seal. As al-ready been stated on previous subsection, there are three major points that can be observed from the FEM simulation. However, all these three major points are only shown by several actual measurements. The sinusoidal shape profile of the contact area boundaries location can be seen directly on figures 3.8 and 3.9 under 1.5mm misalignment. However, the sinusoidal shape profile is not similar as the FEM simu-lation. From the actual measurement, it can be seen that the minimum contact area boundaries is not at π
2 , instead, it is located close to the expected location. So does
the maximum contact area width location, it shifted from the misaligned point where it is expected. The last major point is that the contact area width is not equal at
π
2. From this non-similarities it can be concluded that the misaligned measurement
result is not axially symmetric at π
2, therefore, in subsection 3.2.2, the deformation of
the non-similarity of the contact area boundaries location profile, the deformation of the contact area width is indeed similar to Bavel’s observation, where the increase of the contact area width around air side is bigger than the oil side. This observa-tion can be seen on figure 3.8 under 1.5mm misalignment and figure 3.9 under all misalignment measurements.
Before discussing the sinusoidal contact area boundaries location profile, two types of forces that acts around the contact area must be first defined. Refering to Tasora’s research [9], the radial load Fp has dimensions of a force but it has not a
vectorial nature since it lacks a point of application. On the other hand, Fr is radial
force, having radial direction and applied to the shaft. Per definition, the radial force is the force required to move the shaft radially from the perfectly centered position. The radial force is not null only when the shaft is eccentric.
To understand the sinusoidal-shaped contact area boundaries location profile, assume that no pressure difference is applied and the friction coefficient is largely higher than the friction coefficient that has been used in the FEM simulation. The deformed lip seal contact boundaries will only show enlargement in the contact area width where the misalignment is applied, and the rest of the contact area slightly reduced as shown in figure 3.13. Look back on figure 1.2, around the misaligned point, the bottom housing is pushed towards the glass shaft generating net positive radial force (positive radial force is defined as upward direction) against the tip of the lip seal [9]. Because the hinge point is fixed, this point acts as the rotation axis of the lip seal and combining with the force generated on the tip of the seal, it generates positive moment (positive moment is defined on counterclockwise direction) which makes the tip of the lip seal rotates upwards on the axial direction and followed by the increase of the angleβ. In addition, the angle on the air sideα decreases yield-ing in increase of the contact area width. This occurrence explain the deformation observed by Bavel, however, this is not enough to explain the sinusoidal contact area boundaries. To understand how the sinusoidal contact area boundaries loca-tion profile, assume that the fricloca-tion coefficient between the shaft and the seal is reduced to a great extend. As the lip seal rotates counterclockwise, the tip of the seal slides along the axial direction towards the top housing bringing over the air side at the same time. This explain the elevation on the misaligned point. On the opposite side of the misaligned point, the glass shaft shifted away from the tip of the seal, the garter spring generates negative radial force on the tip of the seal (see fig-ure 1.2) causing a negative moment of the lip seal, generating angle β to decrease and angle αto increase. And again, due to the low friction coefficient, the tip of the lip seal slide downwards.
3.3. DISCUSSION 27
and 1.0 bar pressure differences, the lip seal contact area boundaries shifted down-wards, moreover, the sinusoidal-alike deformation profile is occurred as what has been stated in the first and second paragraphs. As the pressure difference increased to 1.4 bar, the curvature decreased on the air side of the lip seal boundaries caus-ing no bump that jutted out. The pressure difference is now relatively high and the maximum contact area width is almost reached, hence, the gulf-formed boundaries started to disappear except on 0.5mm misalignment. The limitation of the maximum contact area width is shown when the contact area width of 0.75mm misalignment approaches the size of the contact area width of 1.5mm misalignment (see figures 3.9 and 3.10 ). Simultaneously, the sinusoidal-shaped deformation profile of the lip seal slowly vanishes. This is due to the maximum stretching of the contact area width on the air side and the high pressure difference that pushes down the lip seal contact boundaries location resulting back to Bavel’s observation.
Predicting Contact Pressure and contact load
An essential parameter on lip seal application is contact pressure and radial load. To prevent confusion between radial force and radial load, from this section until the end of this report, the radial load is addressed as contact load. It is important to understand these parameters because it is commonly used in practical engineering to predict leakage, durability, expected life, maximum allowed speed and etc. Before discussing deeper about these topics, contact pressure and contact load must be defined beforehand. The total contact load is the combined action of the garter spring and of the lip seal deformation [9], in addition to that, the total contact load can be calculated by integrating the contact pressure along the contact area, hence, It is now clear the definition and relation between the contact pressure and contact load. This can be reformulated as mathematical equation which is expressed in equation 3.1
Fp =
Z
p(θ, z(θ))dA (3.1)
Figure 3.17: Contact pressure distribution under various pressure difference with zero friction coefficient (Source: Borras, On going research)
the shaft, and the material properties of the lip seal. This can be mathematically formulated as been stated by equation 3.2. Since this measurement uses the same material properties, the influence of the material properties can be neglected.
Fp =f[ψ,∆p,material] (3.2)
P = F
A (3.3)
However, this measurement does not give understanding on how the contact pressure nor the contact load change along the radial direction around the shaft. Based on Tasora’s FEM measurement [9](see figure 3.18), the contact load is only marginally affected by the static eccentricity, whereas it depends more heavily on static interference and temperature. The measurement assumed that the friction co-efficient between the lip seal and the shaft is 0.15. Therefore it can be assumed that the contact load to be constant along the radial direction around the shaft assuming that the pressure difference on the lip seal is kept constant.
3.3. DISCUSSION 29
Figure 3.18: Contact load curves for a given set of material parameters, for initial interference of 0.75mm (Source: Tasora,2012)
Conclusions
To summarize, a method to measure a deformed pressurized lip seal has been made. The method uses two different approaches where both approaches resulted on an alike profile of contact area width, hence, it validates the measurement of the lip seal boundaries profile deformation. The observed deformed lip seal bound-aries profile shows several similarities profiles as the FEM models and preceding research, thus, the contact area boundaries profile deformed as the expected defor-mation. In conclusion, this research has answered the two main problems stated on section 1.3.
4.1 Future Research
For future research, determination of the contact pressure would be essential. As what has been stated on subsection 3.3.2, the contact pressure will be dependent on the contact area and the contact load, the contact area itself is dependent on three variables which are; radial position, pressure difference, and the static eccen-tricity. Therefore, a 3D FEM simulation is proposed to understand contact pressure distribution profile. Therefrom, the contact load can be studied further to understand whether the assumption of constant contact load around the shaft is acceptable. Both of the parameters are really important for practical engineering purposes to determine leakage, wear, and other occurrences.
4.2 Acknowledgement
To M.B. de Rooij to give an opportunity for me to be able to contribute on this project, To F.X. Borras for giving insight and discussions, To E. de Vries and R.Meijer for the expertise on measurement and equipment. I would like to acknowledge my parents who have supporting me mentally and financially during the whole of my study.
Bibliography
[1] M. Mokhtar, M. Mohamed, M. El-Giddawy, and S. Yassen, “On the effect of misalignment on the performance of u-type lip seal,” Wear, vol. 223, no. 1-2,
p. 139142, 1998.
[2] X.-G. SONG, L. WANG, and Y.-C. PARK, “Analysis and optimization of nitrile butadiene rubber sealing mechanism of ball valve,”Transactions of Nonferrous Metals Society of China, vol. 19, pp. s220 – s224, 2009.
[3] B. Wennehorst, On Lubrication and Friction in Soft Rough Conformal Sliding Contacts. PhD thesis, universitt Hannover, Dec 2016.
[4] P. Bavel, van,The leakage-free operation of radial lip seals. PhD thesis,
Tech-nische Universiteit Eindhoven, 1997.
[5] J. F. Postmes, “Influence of pressures and misalignment on leakage and tipping point of stern tube seals,” Academic Research Skills, Twente University, Jan
2019.
[6] J. Karsten and Q. M. Palmers, “Determination of the contact area of a rubber lip seal against a shaft with different pressures and misalignments using total internal reflection,” Academic Research Skills, Twente University, pp. 119 –
126, Dec 2018.
[7] C. Hidrovo and D. Palmers, “Development of a dual purpose visualization tech-nique for the study of rotating shaft seals,” Proceedings of the 3rd AMS/JSME Joint Fluids Engineering Confference, 1999.
[8] M. Stakenborg, “On the sealing mechanism of radial lip seals,” Tribology Inter-national, vol. 21, no. 6, p. 335340, 1988.
[9] A. Tasora, E. Prati, and T. Marin, “A method for the characterization of static elastomeric lip seal deformation,” Tribology International, vol. 60, pp. 119 –
126, 2013.
Appendix A
Boundary detection codes
In this chapter, the codes to measure the contact area width will be given, several section is skipped due to repetition, however the essential part will not be skipped. The codes for the calibration is similar to the edge detection approach from which are shown on figure A.1 until figure A.5. The Hough transform codes are shown from figure A.6 until figure A.8
A.1 Boundary Detection Codes
Figure A.1:part I
Figure A.2:part II
Figure A.3: part III
A.2. HOUGHTRANSFORM V
Figure A.4:part IV
Figure A.6: part I
A.2. HOUGHTRANSFORM VII