ISSN Online: 1945-3108 ISSN Print: 1945-3094
DOI: 10.4236/jwarp.2018.103018 Mar. 19, 2018 304 Journal of Water Resource and Protection
Assessing Development Pathway Trends in
Developing Countries over the 1995-2010
Period Using Multivariate Analysis
Céline Dondeynaz, César Carmona Moreno
Water and Marine Resources Unit, Directorate for Sustainable Resources, Joint Research Centre, Ispra, Italy
Abstract
Country development is a complex issue that can be meant from a strict eco-nomic view to a more integrated vision. This study analyses the sustainable development in terms of access to basics services, water resources manage-ment and external support from Donors. 103 countries are analysed according to 22 variables that include the access to basic services, urbanisation process, uses of water resource, freshwater availability, governance and Official De-velopment Assistance. The measure of Human DeDe-velopment has progressed for all countries except one, during 1995-2010 period. Countries are clustered in 5 reference profiles, where profiles 4 and 5 are considered the poorest and mostly include African countries. The mid-term changes concern 16% of the countries, where most of them are related to governance and Development Assistance aspects. 5% shifts are temporary changes due to the country speci-ficity. Changes from or to the profiles 4 and 5 are deeper analysed providing potential explanations.
Keywords
Sustainable Development, Governance, Water Resources, Principal Component Analysis, Official Development Assistance, Water Uses
1. Introduction
In the frame of the Sustainable Development Goals (SDGs), the International Community has renewed its commitment to reach sustainable development by 2030 that encompass multiple aspects of human well-being. 17 goals were de-fined and include the environment, water and sanitation, energy, poverty, health, gender, economic growth among others [1]. This integrated view of
de-How to cite this paper: Dondeynaz, C. and Carmona Moreno, C. (2018) Assessing De-velopment Pathway Trends in Developing Countries over the 1995-2010 Period Using Multivariate Analysis. Journal of Water Re-source and Protection, 10, 304-326. https://doi.org/10.4236/jwarp.2018.103018
Received: December 20, 2017 Accepted: March 16, 2018 Published: March 19, 2018
Copyright © 2018 by authors and Scientific Research Publishing Inc. This work is licensed under the Creative Commons Attribution International License (CC BY 4.0).
DOI: 10.4236/jwarp.2018.103018 305 Journal of Water Resource and Protection
velopment is not new, and has shifted from the assessment of the economic growth [2] to an integration of additional social and environmental dimensions like inequality (e.g. [3]) education/literacy, and the WSS access (e.g. [4] or gen-der [5]. Composite indicators have been also built to provide synthetic measures of several aspects of development at national scale: for instance, the Inequal-ity-adjusted Human Development Index (HDI) [6]), the Multidimensional Pov-erty Index (MPI) [7] or the Employment-adjusted Human Development Index
[8]. (Gain et al., 2016) developed a global water security index associated socio-economic aspects and biophysical indices to better assess the water sector, to contribute to the framework of the SDGs [9]. Holden et al. (2017) assessed and cross-analysed three aspects to measure sustainable development: “the hu-man needs, ensuring social equity, and respecting environmental limits” [10].
Following such trend to understand development through more than one as-pect, this study extends the multi-dimensional approach conducted for year 2004
[11]. It aims at finding patterns and trends in country sustainable development over the period 1995-2010 from the point of view of the water sector. Indeed, considering the 17 sectors of the SDGs together would have been complex. The water and sanitation sector is a transversal sector that interacts with other sec-tors, such as education, health, agriculture, energy, environment/biodiversity and general economy, is estimated as a good entry point-proxy to assess country development. In addition, it has been included the Official Development Assis-tance flows (external financial support) which can be a significant amount de-pending on the recipient country [12]. The main objective is to analyse the country evolution considering several aspects: living conditions such as access to Water and Sanitation services, urbanisation and the housing conditions, the ac-cess to basic health care, the balance and estimation of water uses per main eco-nomic consumers, and the official development flows (general and water sector specific flows). This study focuses on developing countries where development is key to improve the living conditions of a significant part of the population.
The WatSan4dev database, developed by the Joint Research Centre in 2012
[11], has been enhanced by adding and pre-processing the data series from 1995 to 2010 with a 5-year interval [13]. 103 developing countries are selected from Latin America, Africa and South Eastern Asia. These profiles are the framework to observe the country evolution over 1995 to 2010 and are characterised around 5 thematic factors: Human Development and Poverty (HDP), Agriculture pres-sure on water resources (AP), Official Development Assistance (ODA Compos-ite Index), Water Resource (WR) and Governance (GOV).
DOI: 10.4236/jwarp.2018.103018 306 Journal of Water Resource and Protection
of being most complete and robust dataset as well as enabling a coherence vali-dation with [11].
2. Data Description
The variables and data were collected from providers that are internationally mandated institutions (the World Bank, the OECD or the FAO). They delivered worldwide datasets at national scale for which validation and harmonisation processes were carried out. Validation processes performed by each data pro-vider are described in [14]. The selected datasets were processed to set up the WatSan4tDev database, developed by the Joint Research Centre (JRC) of the European Commission (EC). From this database, 22 variables are selected re-lated to the environment, economic and social development, governance and fi-nancial aid flows in developing countries and collected for years 1995, 2000, 2005, and 2010. The list of data gathered, their unit and source are detailed in
Table 1. Note that Total Water Renewable Resources (TWRR), precipitations
(Precipit), and percentage of land under risk of desertification (Desert risk) are considered as constant variables over the 15 years period.
As in [13], no independent territories, developed countries, countries with less than 150,000 inhabitants and the countries with more than 35% missing data for the set of variables selected were not considered in this analysis. Eastern Euro-pean countries and Central Asia are also excluded because focusing on Africa, Latin America and South-East Asia.
There is little information about uncertainty of data, only standards errors for Worldwide Governance Indexes (WGI) (between 4% and 7% in average) are given by observations (WGIs database). The data used take into account updates made by the data providers until May 2015.
Missing data rate is a significant constraint for several data series, therefore, an imputation process is setup to complete datasets with realistic values. Prior, the variables were processed using linear regression to adjust the outlier values. The multi-variate imputation software Amelia II which uses EMB algorithm has been used [15]. Additional and manual verifications were made based on the data available in previous or consecutive years and specific literature. Therefore, this data is to be used only for qualitative analysis, quantitative analysis should be avoided because of the heterogeneity of the data collection and computation methodologies.
3. Methodology
DOI: 10.4236/jwarp.2018.103018 307 Journal of Water Resource and Protection
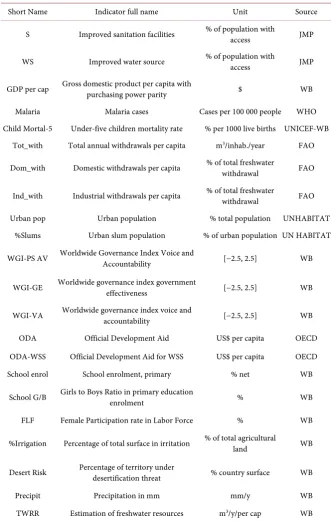
Table 1. Variables used in this study, unit and source. FAO stands for Food and Agricul-ture Organization, WB for the World Bank, OECD for Organisation for Economic Coop-eration and Development, JMP for Joint Monitoring Program, WHO for World Health Organisation, UNICEF and UN HABITAT for the direction related to Children and housing/Urbanisation matters respectively f of the United Nations.
Short Name Indicator full name Unit Source
S Improved sanitation facilities % of population with access JMP
WS Improved water source % of population with access JMP
GDP per cap Gross domestic product per capita with purchasing power parity $ WB
Malaria Malaria cases Cases per 100 000 people WHO
Child Mortal-5 Under-five children mortality rate % per 1000 live births UNICEF-WB Tot_with Total annual withdrawals per capita m3/inhab./year FAO
Dom_with Domestic withdrawals per capita % of total freshwater withdrawal FAO
Ind_with Industrial withdrawals per capita % of total freshwater withdrawal FAO
Urban pop Urban population % total population UNHABITAT
%Slums Urban slum population % of urban population UN HABITAT
WGI-PS AV Worldwide Governance Index Voice and Accountability [−2.5, 2.5] WB
WGI-GE Worldwide governance index government effectiveness [−2.5, 2.5] WB
WGI-VA Worldwide governance index voice and accountability [−2.5, 2.5] WB
ODA Official Development Aid US$ per capita OECD
ODA-WSS Official Development Aid for WSS US$ per capita OECD
School enrol School enrolment, primary % net WB
School G/B Girls to Boys Ratio in primary education enrolment % WB
FLF Female Participation rate in Labor Force % WB
%Irrigation Percentage of total surface in irritation % of total agricultural land WB
Desert Risk Percentage of territory under desertification threat % country surface WB
Precipit Precipitation in mm mm/y WB
TWRR Estimation of freshwater resources m3/y/per cap WB
2005 was chosen as reference year because of being most completed and thus, robust dataset.
DOI: 10.4236/jwarp.2018.103018 308 Journal of Water Resource and Protection
projection as supplementary observations of the datasets for 1995, 2000, 2010 into the multidimensional 2005 space. This ensures the consistency of the com-parison and the clustering of observations across time and makes the change of country profile observable and measurable against 2005. The spearman rank-order correlation is used as the dataset satisfies its two assumptions: 1) it does not re-quired normal distributions; and, 2) the two-by-two variable relationships are monotonic. Varimax rotation is applied to maximize the variance of the loadings (Abdi, 2003). The first 5 main factors selected provide a simple and easy inter-pretable structure that is the data baseline of the clustering next step. The factors are selected because having an eigenvalue above 1 and at least two variables with an above 0.5 factor load [17][18].
The main two clustering methods used are the Agglomerative Hierarchical Clustering (AHC) and the k-means clustering (k-means) [19][20]. The AHC is used in a first step, as a discovery tool to define the number of clusters that suits the dataset. The AHC analysis was enough stable, indicating that the appropriate number of clusters is 5 clusters [13].
The k-means is then applied to 2005 observations setting 5 clusters because it provides more sharped cluster [21]. The observations of 1995, 2000 and 2010 were distributed, in a second step, into the 2005 clusters according to the short-est Euclidian distance with each cluster centroid (Appendix 2). In this way, it is easy to observe the progress of the countries along the period 1995-2010.
4. Results
4.1. Five Thematic Factors
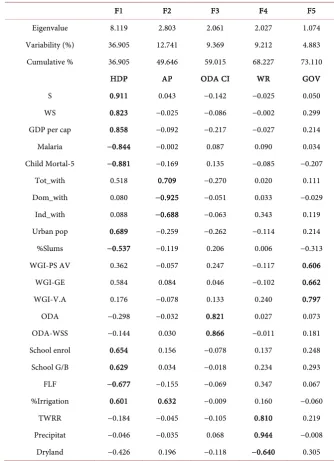
The five first factors represent 73.11% of the whole observed variance and the Bartlett’s sphericity test confirmed the PCA significance with a computed p-value (<0.0001) lower than alpha level of 0.05 (Appendix 1). Next paragraphs summarized the meaning of the main factors defined for 2005 that are the ref-erence values for building country profiles.
Factor 1 Human Development and Poverty (HDP)
The first factor (HDP) gathered the variables that characterize human devel-opment of a country such as access to basic health or education, and the living conditions (income, urbanization, access to water supply or sanitation). HDP is logically organised with the “development variables”, namely Water supply (WS) and Sanitation(S) access, the urbanization level (Urban pop), the education level (School enrol, School G/B), inversely correlated to “poverty variables”, namely Malaria prevalence (Malaria), Children under five years mortality rate (Child Mortal-5), Proportion of the urban population leaving in slums (% Slums) [14]. The higher the value on the HDP factor, the higher the country development.
Factor 2: Agriculture pressure on water resources (AP)
DOI: 10.4236/jwarp.2018.103018 309 Journal of Water Resource and Protection
by agriculture water demand [11]. Therefore, the domestic (Dom_with) and in-dustrial water demands (Ind_with) are negatively correlated with the irrigation practice (% irrigation) and the total withdrawn water (Tot_with). This domi-nance of agricultural water demand remains true for the great majority of coun-tries and for the whole period. The AP indicates the level of this domination of Agriculture as main water consumer. This means that the lower the value in AP, the higher percentage of the water resources is dedicated to Industrial and/or Municipal sectors.
Factor 3: Official Development Assistance Composite Index (ODA CI) The third factor (ODA CI) gathers the variables measuring the Official De-velopment Assistance provided by the donor community to recipient counties. ODA variable is the financial flows invested by donors covering any sectors of cooperation (such as health, education, economic support…) while ODA-WSS considers only flows dedicated to the Water sector. The higher the value on ODA CI, the bigger the external support provided to the country.
Factor 4: Water Resources (WR)
The fourth factor (WR) gathers the variables related to the estimation of Wa-ter Resources available (WR), namely the total waWa-ter renewable resources (TWRR), the average precipitations (Precipit), and the percentage of the terri-tory under desertification threat (Desert risk). The variables TWRR and Precipi-tation are logically negatively correlated to desert risk. Therefore, the more the value on the WR factor, the higher the estimated amount of Water Resources.
Factor 5: Governance (GOV)
The fifth factor (GOV) represents the governance variables (loadings > 0.6), namely Political Stability and Absence of Violence (WGI-PSAV), Government Effectiveness (WGI-GE), and Voice and Accountability (WGI-VA). The higher the value in GOV factor, the better the governance.
4.2. The Country Profiles in 2005 Reference Year
Applying clustering methods, 5 main groups of countries were defined (Section 3). Their respective average behaviour according to the HDP, ODAC CI, GOV, WR and AP thematic factors is shown in Figure 1.
Profile 1: Counting on its own capacities
DOI: 10.4236/jwarp.2018.103018 310 Journal of Water Resource and Protection
Figure 1. Centroid value according to the 5 thematic factors HDP, GOV, ODACI, WR and AP for each country profile. The cen-tral objects are for cluster 1-Peru, cluster 2-Oman, cluster 3-Nicaragua, cluster 4-Zambia, and cluster 5-Burundi.
Profile 2: Governance black spot
These countries present a profile characterized by the highest factor loading on the HDP (1.011 centroid loading) but a very low level of GOV f (−0.717, cen-troid loading). The positive loading on AP (0.257 cencen-troid loading) means that the amount of water dedicated to agriculture is slightly dominant compared to domestic/municipal and industrial uses together. Industrial water use is very limited or marginal (0% to 9%). These countries are situated in dry regions (mainly Maghreb and Middle East), therefore, their negative loadings on the WR (−1.233). The factor loading on ODA CI is close to 0 (−0.041) that indicates a moderate/low external financial input in these countries. The central observa-tion is Oman while Djibouti, Jordan and Sudan are in periphery of this cluster.
Profile 3: Development boosted by external aid and water abundance.
The third profile is characterized by high values on WR (0.998 centroid load-ing) and ODA CI factors (0.879 centroid loadload-ing). The majority of the countries are in South East Asia, Central America and Caribe. They receive a relatively high flow of ODA per capita because of being target countries like Bhutan and Central America or lightly populated countries such as Fiji and Sao Tome & Principe. Their level of governance is significant with a central factor loading closed to 0 (0.055) that may explain the high level of financial support of Donors
[14]. The centroid of AP factor is also positive (0.334) implying the dominance of the agricultural demand (around 60%) versus the domestic and industrial needs. The central observation is Nicaragua while Laos, Bangladesh and Guyana is in the periphery of the cluster.
Profile 4: Good governance and essential external support
This fourth profile is characterised by a poor HDP (−1.007 centroid loading) similar to profile 5 but in a context of water scarcity (−0.637 centroid loading). Despite this state, the governance level is relatively high (0.925 centroid loading)
0.316
1.011 0.524
-1.007 -0.804
0.401 0.257
0.334 0.022
-1.025
-1.151
-0.041
0.879 0.374
-0.198
0.606 -1.233
0.998 -0.647
0.384
0.561 -0.717
0.055
0.925 -0.856
-1.500 -1.000 -0.500 0.000 0.500 1.000 1.500
Profile 1 Profile 2 Profile 3 Profile 4 Profile 5
DOI: 10.4236/jwarp.2018.103018 311 Journal of Water Resource and Protection
corresponding mainly to the most stable, democratic and efficient African coun-tries in 2005 such as Zambia, Namibia, Lesotho, or Senegal. Therefore, the ODA flows is at substantial level with a 0.307 centroid loading. The country closest to this centroid is Zambia while Madagascar, Cape Verde and Botswana are in pe-riphery of this cluster.
Profile 5: Primary material consumption
The fifth profile shows a very low HDP (−0.856 centroid loading) and a very low level of AP (−1.025 centroid loading). The latter means that water for agricul-ture is below 50% of the water withdrawn. Water resources are mainly dedicated to domestic and/or industrial uses. These countries mainly present a weak agri-cultural sector. The water consumption is divided between domestic/municipal use (dominant in Comoros, Equatorial Guinea, and Gabon) and/or a strong natural/primer resources sector (like in Congo, Cong Dem, Sierra Leone, Nige-ria, Guinea). In addition, these countries are subject to very poor governance at various levels: corruption, state weakness or authoritarian government...etc. Therefore, a very low value of GOV (−0.856 centroid loading). Burundi is closest to the centroid of this cluster and no countries are in the periphery.
4.3. Trends over 1995-2010 Period
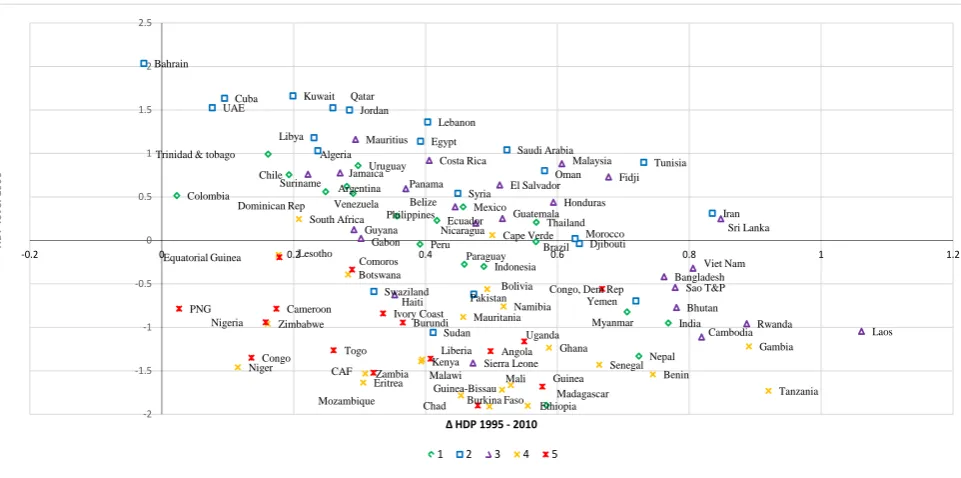
4.3.1. Trends by Thematic FactorsFigures 2-5 describe the change between factor loading in 1995 and 2010 of each
[image:8.595.58.539.454.693.2]thematic factor (except WR which is considered constant) enabled by the fact that all observations are projected in the same space.
Figure 2 shows the HDP changes between 1995 and 2010. HDP globally
pro-gresses for all the countries no matter from which continent. Only Bahrain has a
Figure 2. HDP difference change between 1995 and 2010 per country: All countries, except Barhain, benefited from a positive trend in term of human development between 1995 to 2010, even for the poorest.
Argentina Brazil Chile Colombia Dominican Rep Ecuador India Indonesia Madagascar Mexico Myanmar Nepal Paraguay Peru Philippines Thailand Trinidad & tobago
Uruguay Venezuela Algeria Bahrain Cuba Djibouti Egypt Iran Jordan Kuwait Lebanon Libya Morocco Oman Pakistan Qatar Saudi Arabia Sudan Swaziland Syria Tunisia UAE Yemen Bangladesh Belize Bhutan Cambodia Costa Rica
El Salvador Fidji
Gabon Guatemala Guyana Haiti Honduras Jamaica Laos Malaysia Mauritius Nicaragua Panama Rwanda Sao T&P Sierra Leone Sri Lanka Suriname Viet Nam Benin Bolivia Botswana Burkina Faso Cape Verde Eritrea Ethiopia Gambia Ghana Guinea-Bissau Kenya Lesotho Malawi Mali Mauritania Mozambique Namibia Niger Senegal South Africa Tanzania Zambia Zimbabwe Angola Burundi Cameroon CAF Chad Comoros Congo
Congo, Dem Rep
Ivory Coast Equatorial Guinea Guinea Liberia Nigeria PNG Togo Uganda -2 -1.5 -1 -0.5 0 0.5 1 1.5 2 2.5
-0.2 0 0.2 0.4 0.6 0.8 1 1.2
H D P le ve l 1 99 5
Δ HDP 1995 - 2010
DOI: 10.4236/jwarp.2018.103018 312 Journal of Water Resource and Protection
[image:9.595.65.536.64.360.2]
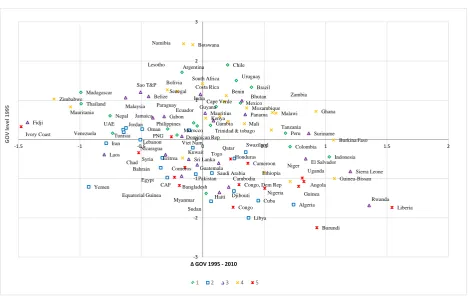
Figure 3. GOV difference change between 1995 and 2010 per country. The pattern of country governance trends covers multiple situations: from a low level of governance that degraded (like Yemen), or on the contrary, that improve a lot (like Rwanda). Countries with relatively good governance in 1995 show a lower magnitude in change (both negatively and positively) like Argen-tina, South Africa Botwana or Namibia.
Figure 4. AP difference change between 1995 and 2010 per country. The cloud of points is more concentred, indicating slower change trend. The countries form profiles 1, 2 and 3 have an AP driven by the Agriculture activity and water demand.
slightly lower level (−0.0272), since it was already in the highest HDP levels. In this methodology, the poverty alleviation is understood as an economic assessment but also includes access to basic health, education for both sexes, decent housing
Argentina Brazil Chile Colombia Dominican Rep Ecuador India Indonesia Madagascar Mexico Myanmar Nepal Paraguay Peru Philippines Thailand
Trinidad & tobago Uruguay Venezuela Algeria Bahrain Cuba Djibouti Egypt Iran Jordan Kuwait Lebanon Libya Morocco Oman Pakistan Qatar Saudi Arabia Sudan Swaziland Syria Tunisia UAE Yemen Bangladesh Belize Bhutan Cambodia Costa Rica El Salvador Fidji Gabon Guatemala Guyana Haiti Honduras Jamaica Laos Malaysia Mauritius Nicaragua Panama Rwanda Sao T&P Sierra Leone Sri Lanka Suriname Viet Nam Benin Bolivia Botswana Burkina Faso Cape Verde Eritrea Ethiopia Gambia Ghana Guinea-Bissau Kenya Lesotho Malawi Mali Mauritania Mozambique Namibia Niger Senegal South Africa Tanzania Zambia Zimbabwe Angola Burundi Cameroon CAF Chad Comoros Congo Congo, Dem Rep Ivory Coast
Equatorial Guinea Guinea
Liberia Nigeria PNG Togo Uganda -3 -2 -1 0 1 2 3
-1.5 -1 -0.5 0 0.5 1 1.5 2
G O V le ve l 1 99 5
Δ GOV 1995 - 2010
1 2 3 4 5
Argentina Brazil Chile Colombia Dominican Rep Ecuador India Indonesia Madagascar Mexico Myanmar Nepal Paraguay Peru Philippines Thailand
Trinidad and Tobago Uruguay Venezuela Algeria Bahrain Cuba Djibouti Egypt Iran Jordan Kuwait Lebanon Libya Morocco Oman Pakistan Qatar Saudi Arabia Sudan Swaziland
Syrian Arab Rep
Tunisia
United Arab Emirates
Yemen Bangladesh Belize Bhutan Cambodia Costa Rica El Salvador Fiji Gabon Guatemala Guyana Haiti Honduras Jamaica
Lao People's Dem Rep
Malaysia
Mauritius Nicaragua
Panama
Rwanda Sao Tome & Principe
Sierra Leone Sri Lanka Suriname Viet Nam Benin Bolivia Botswana Burkina Faso Cape Verde Eritrea Ethiopia Gambia Ghana Guinea-Bissau Kenya Lesotho Malawi Mali Mauritania Mozambique Namibia Niger Senegal South Africa Tanzania Zambia Zimbabwe Angola Burundi Cameroon Central African Rep
Chad
Comoros
Congo
Congo, Dem Rep Côte d'Ivoire Equatorial Guinea Guinea Liberia Nigeria PNG Togo Uganda -3 -2 -1 0 1 2 3
-1.5AP 1 -1 -0.5 0 0.5 1
99
5
Δ AP 1995-2010
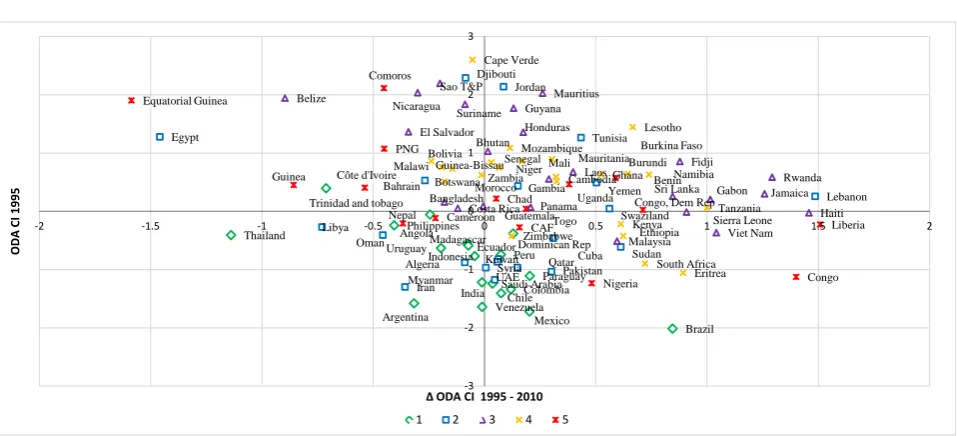
[image:9.595.61.539.427.627.2]DOI: 10.4236/jwarp.2018.103018 313 Journal of Water Resource and Protection
Figure 5. ODA CI difference change between 1995 and 2010 per country. The countries from profiles 1 and 2 mainly received less or stable amount of ODA over the period.
conditions in urban and rural conditions. This global positive trend in terms of poverty alleviation was internationally highlighted in particular by the Millen-nium Development Goals report in 2015 [22]. Laos, Cambodia, Tanzania, Gam-bia and Sri Lanka are the top 5 countries which progressed the most over the 15 years. Note that these good progresses are associated to their low initial HDP level in 1995.
The evolution of GOV factor (Figure 3) ranges between [−1.6, +1.6]. The governance level is volatile in developing countries and subjected to quick changes (government or military coup etc.). The rate of change is also depending on the initial level of governance. A country with a good governance is most probably having a slow or negative evolution rate while a country going out years of civil war is expected to show good rate while recovering from this crisis. Zimbabwe, Fidji and Cote D’Ivoire are the top 3 countries where governance decreased the most. This negative trend is probably due to the Agrarian reform in Zimbabwe in 2000 [23], a military coup in Fiji in 2006 [24] and political/ military crisis in Ivory Coast during 2002-2007 period [25].
The changes in AP (Figure 4) are concentrated around [−0.5, +0.5], and re-flects mid-term/long-term phenomena. The most important positive changes are mainly due to the increment of water dedicated to domestic/municipal uses, a phenomenon that accompany the extension of WSS coverage and urbanization processes. However, agriculture remains in the great majority of countries, in development or developed, the main consumer of water resources. Gambia, Haiti and Dominican rep have seen the very dominant agricultural consumption (>88%) reduced in favour of a significant domestic/municipal demand (between 18% - 45%). In the case of Gambia and Dominican Republic, the tourism activity development may be a reason of this change. The new assessment made by FAO of the water withdrawals by sector in 2015 can complement this analysis.
Argentina Brazil ChileColombia Dominican Rep Ecuador India Indonesia Madagascar Mexico Myanmar Nepal Paraguay Peru Philippines Thailand
Trinidad and tobago
Uruguay Venezuela Algeria Bahrain Cuba Djibouti Egypt Iran Jordan Kuwait Lebanon Libya Morocco Oman Pakistan Qatar Saudi Arabia Sudan Swaziland Syria Tunisia UAE Yemen Bangladesh Belize Bhutan Cambodia Costa Rica El Salvador Fidji Gabon Guatemala Guyana Haiti Honduras Jamaica Laos Malaysia Mauritius Nicaragua Panama Rwanda Sao T&P Sierra Leone Sri Lanka Suriname Viet Nam Benin Bolivia Botswana Burkina Faso Cape Verde Eritrea Ethiopia Gambia Ghana Guinea-Bissau Kenya Lesotho
Malawi Mali Mauritania
Mozambique Namibia Niger Senegal South Africa Tanzania Zambia Zimbabwe Angola Burundi Cameroon CAF Chad Comoros Congo Congo, Dem Rep
Côte d'Ivoire Equatorial Guinea Guinea Liberia Nigeria PNG Togo Uganda -3 -2 -1 0 1 2 3
-2 -1.5 -1 -0.5 0 0.5 1 1.5 2
O
DA
C
I 1995
Δ ODA CI 1995 - 2010
DOI: 10.4236/jwarp.2018.103018 314 Journal of Water Resource and Protection
The ODA CI flow can show fluctuations from year to year and therefore, this factor shows a high range of changes (Figure 5). The top 3 countries are Liberia, Lebanon and Haiti during this period. The reasons of ODA provision are very much linked to donor motivation(s) that is a topic discussed in the literature: e.g. relationships with governance [26], with former colonisation relation [27] or cooperation and geopolitical strategy [28].
4.3.2. Changes of Profile over 1995-2010 Period
Understanding the change of cluster by the selected countries aims at quickly catching what is the medium term evolution of developing countries according to these five key factors. The longer the observation period, the better for the trend analysis.
Before going into the details of profile shifts, an average trend is analysed looking at the centroid country per profile.
The centroid country evolution
As average of profile 1, Peru saw its HDP value progressing steadily (from −0.041 to 0.34) together with the GOV (from 0.161 to 0.830). This development is associated to a decrease of the share of the agricultural water demand, poten-tially due to the development of the domestic demand ongoing with the access to water supply service.
As average of profile 2, Oman is characterised by a degradation of GOV (from 0.263 to −0.228) associated with a decrease of ODA (from −0.407 to −0.863). Despite this, the HDP value globally increased (from 0.802 to 1.38) over 1995-2010 period.
As average of profile 3, Nicaragua appears to follow the same pattern as Peru except on what concerns GOV that was already low and degraded over the pe-riod (from −0.387 to −0.691).
As average of profile 4, Zambia showed a very low level of HDP in 1995(on contrary of Profile 1) that improved significantly (from −1.531 to −1.222) during the 1995-2010 period. Remaining poor countries in 2010, the perception of gov-ernance was initially good and even progressed over the period (from 0.687 to 1.24).
Finally, Burundi, as average of profile 5, is a poor country that improved its HDP value (from −0.944 to −0.578) similarly to profile 4. Its level of GOV re-mains poor despite an improvement (from −2.250 to −1.34). Its specificity is the negative value in AP indicating a less dominant agricultural water demand, de-creasing over the 1995-2010 period.
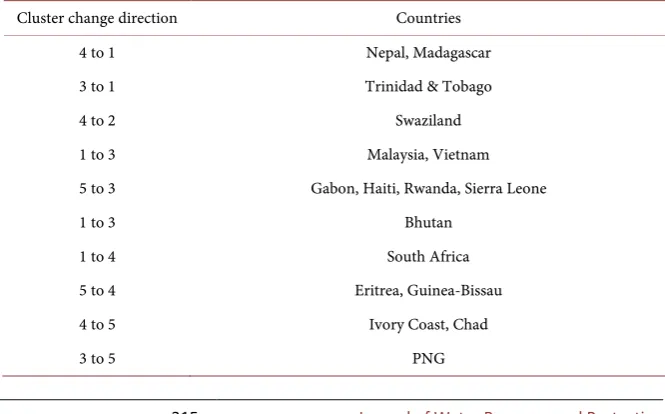
The number of countries changing cluster at least once over the whole period 1995-2010 is 22 out of 103 countries (21%). This small change rate was expected as the factors mainly measure mid-long term phenomena such as access to edu-cation, health, governance framework, level of urbanization, living conditions, etc. In details, 5 are short term changes while the others (16%) are potential medium term changes (Table 2).
DOI: 10.4236/jwarp.2018.103018 315 Journal of Water Resource and Protection
The analysis of country evolution will be focused on changes to or out of pro-file 4 and 5, to limit the length of this paper. These two propro-files are considered most disadvantaged and gather most of the poor countries. The identification of roots of each change would need specific investigation in each specific country. Note that the group of countries in profile 2 remain stable over this 15 years pe-riod.
Changes to or out of profile 5
Several countries moved out of the profile 5 to: 1) profile 3 like Gabon, Haiti, Rwanda and Sierra Leone; 2) profile 4 like Eritrea, Guinea Bissau; 3) Papua New Guinea, Ivory Coast and Chad moved from others profiles to profile 5.
Gabon (profile 3 in 2010) already is in periphery of the profile 5 in 2005 showing a minimum and degrading governance (from 0.586 in 1995 to 0.271 in 2010), and a higher value in HDP than the average (around 0 HDP loading). The reason of this change between 2005 and 2010 is the increment of HDP, com-bined with a significant increase of ODA (less than 7 USD$ per cap in 2005 to in more than 66USD$ in 2010). The better HDP indicates either an increase of in-come per capita, an extension of access to basic services, and/ or a reduction of mortality and disease prevalence.
Haiti (profile 3 in 2010) moved out profile 5 because of a spectacular increase of global ODA (from 45USD per cap in 2005 to 309USD per cap in 2010), cer-tainly in support to Haiti recovery after the earthquake in January 2010. How-ever, this change is to be taken with caution as the distance of Haiti 2010 obser-vation with centroids of both profiles 3 and 5 are similar. Therefore, there is a significant probability that Haiti will move back to profile 5 as soon as the ODA level will drop again to 1995-2005 levels, since GOV values remained close to those ones of profile 5.
[image:12.595.205.538.538.745.2]Rwanda’s shift (profile 3 in 2010) is due to a continuous progress of HDP and GOV factors with the support of increasing ODA flows. In details and for the whole period, values of GOV factor steadily increased from −1.683 to −0.328 and
Table 2.Medium term changes across profiles for the 1995-2010 period.
Cluster change direction Countries
4 to 1 Nepal, Madagascar
3 to 1 Trinidad & Tobago
4 to 2 Swaziland
1 to 3 Malaysia, Vietnam
5 to 3 Gabon, Haiti, Rwanda, Sierra Leone
1 to 3 Bhutan
1 to 4 South Africa
5 to 4 Eritrea, Guinea-Bissau
4 to 5 Ivory Coast, Chad
DOI: 10.4236/jwarp.2018.103018 316 Journal of Water Resource and Protection
from −0.957 and −0.07 on HDP factor and, associated with an increment of ODA CI loading from 1.087 in 2005 to 1.878 in 2010. These trends can illustrate well the recovery of Rwanda from the civil war that ended in 1994.
The case of Sierra Leone (profile 3 in 2010) is similar to Rwanda with a pro-gress of HDP and GOV supported by an increase of ODA flows from 2000. Si-erra Leone started its recovery from a civil war in 2002/2004 as shown, for stance, by the already better value in GOV in 2005. The flow of ODA greatly in-creased from 46USD in 2000 to 81USD per cap in 2010, while ODA dedicated to WSS tripled (from 3.3 million 2007-constant USD in 2004 to 13.5 million).
Papua New Guinea (PNG) belongs to profile 5 since 2000. Note that PNG was already in the periphery of profile 3 in 1995 (with a distance to the centroid of 2.13) showing lower HDP and AP values than the average behaviour of profile 3. The change of cluster is mainly due to a decrease of HDP between 1995 to 2000
[29] and an additional decrement of AP already low value. The degradation of its governance (from positive to negative values) over the whole period keeps the PNG in profile 5 since 2000.
The shift between profile 4 and 5 is due to the evolution of two factors among AP, ODA CI and GOV factors as the countries included in these 2 clusters are the poorest with the lowest HDP values.
Ivory Coast and Chad felt into profile 5 during the 2000 to 2010 period be-cause of a decrement of GOV and, in parallel a decrement of AP value. The de-crease of governance is certainly due to security degradation and political trou-bles (e.g. political crisis/violence in Ivory Coast in 2002 [25] and from 2005 to 2009 in Chad). The reinforcement for municipal and/or industrial sector share may rather highlight a degradation of agriculture activities (to be specifically analysed for these two countries) and thus, water needs during that period.
Since 2000, Guinea-Bissau is in profile 4 because of an increase of GOV ac-companied by a positive external support flows (in average above 0.5 ODA CI loading) being in the periphery of the cluster. Eritrea also moved to profile 4 since 2000 because a decrement of AP toward an increasing share of water used for agriculture activities (AP values becoming positive in 2005 and 2010). Eritrea also benefited of an increasing external support for the period 1995 to 2005 (ODA CI values becoming positive in 2005) reaching a level closer to ODA value of profile 4.
Changes to or out of profile 4
Madagascar and Nepal shifted from profile 4 to profile 1 while South Africa moved in the opposite direction. Bhutan belonged to profile 4 in 1995 before shifting to profile 3 in 2000. Finally, Swaziland belongs to profile 2 since 2005.
DOI: 10.4236/jwarp.2018.103018 317 Journal of Water Resource and Protection
water use is still dominant but no more exclusive. The improvement of govern-ance is mainly related to the civil freedom improvement and the reduction of political instability and violence, in particular initiated with Nelson Mandela’s presidency in 1994.
Madagascar (Profile 1 since 2010) remains in the periphery of profile 1 in 2010 keeping a close distance with profile 4 (2.256 distance with profile 1’s cen-troid against 2.482 with profile 4’s cencen-troid). Madagascar shows a particularity in AP factor with a very high value dedicating almost all the water withdrawn to agricultural purposes; having no industries and few water withdrawn specifically for domestic/municipal demand. The shift from profile 4 to 1 is mainly due to a drastic decrease of GOV from 1.503 to 0.209 since high governance is a strong characteristic of profile 4. The three WGI variables measuring the political sta-bility, the civil freedom, the government effectiveness and accountability show a significant degradation of governance since 2005. This shift implied no big in-crease of human development, with progresses rather slow and steady over the whole period.
Nepal (profile 1 since 2000) dropped in both GOV and ODA CI factors. The GOV value decreased from 1995 to 2005 while ODACI mainly dropped from 1995 to 2000. These decrements are probably due to the internal conflict be-tween the Government of Nepal and the Communist Party of Nepal (Maoist) between 1996 and 2006 [30]. This is associated with a reinforcement of its agri-culture orientation, continuous small improvement of HDP in a context of low ODA flows (24USD per cap in average). These have led to Nepal to be statisti-cally closer to profile 1 average behaviour since 2000, but remaining in the pe-riphery of this profile.
Swaziland has a specificity because in the periphery of both profiles 2 and 4 with similar distance with the two centroids (e.g. 2.069 with profile 2 and 2.083 with profile 4). Its poor level of development and its relative water scarcity fit rather the profile 4 characteristics. The negative governance and an ODA limited value are more suitable to profile 2. The AP average value diverges from the two profiles (fitting better profile 1). Therefore, the position of Swaziland is found original. The shift to profile 2 observed in 2005 is mainly due to slight decre-ments of GOV and ODA CI in 2005-2012.
Bhutan’s shift (profile 3 in 2000) is due to an increment of ODA CI and HDP. The ODA flows to Bhutan increased from 102 USD per cap in 1995 to 182 USD in 2010. This is associated to a concomitant increment of the HDP value. Note that WR level of Bhutan was already diverging from profile 4 average with a relative abundance of water resources. Therefore, a specific country analysis could be interesting to explore the reasons of this specificity.
Short term changes
DOI: 10.4236/jwarp.2018.103018 318 Journal of Water Resource and Protection
Costa Rica and Panama have exactly the same trends over the whole period, belonging first to profile 3 in 1995, moved to profile 1 in 2000 and 2005; and fi-nally, are back to profile 3 in 2010. Dominican Republic shows the exact oppo-site trend, belonging first to profile 1 before moving to profile 3 and be back again to profile 1. These shifts between same two profiles are due to the fluctua-tions of ODA financial flows in these recipient countries and do not represent a structural change in their development. When the ODA CI shows a positive value, these three countries belong to profile 3 characterized by high level of ODA. Negative values in ODA Ci move these three countries to profile 1. Such fluctuations of financial flows question the purpose and the medium-long term strategy of donors in recipient countries [26][27][28].
Zimbabwe belongs to profile 4 in 1995 and 2010 being nearer to its average behaviour (the Euclidian distance being inferior to 1.3). Zimbabwe shifted to profile 1 in 2000-2005 period certainly because Zimbabwe went through trouble time in 2000-2008 period [31]. This implied a drastic drop of 2 factors out of 5: the ODA and GOV making it temporary nearer to profile 1 (still in the periph-ery of profile 1). The initiate of the recovperiph-ery since 2008 can be first observed on ODA value, while GOV remains unchanged at a poor level in 2010.
Bolivia belongs to profile 4 over the whole period except in 2005 where Bolivia moved to profile 3. This temporary classification is due to a drop of governance while the ODA flows slightly decreased; fitting better the profile 3.
In conclusions, these temporary shifts (5%) illustrate the difficulty to cluster in a simple and understanding way, complex behaviours of countries toward their development. Not all countries fit well in one of the 5 profiles however, the number of cases remains minor.
5. Discussion
With regards to the methodology and the datasets several remarks are to be made [13]. First, the quantity and completeness of data constraint the accuracy and interpretation of this multivariate analysis. Therefore, only quantitative in-terpretation is enabled. Since the period is relatively short and introduces uncer-tainty in the duration of the change, the parameters to analyse are ODA CI and GOV factors because being the most responsive to short term events impacts (e.g. civil wars, natural disaster…). Therefore, a minimum of 30/40 years period would already improve the quality of the interpretation of country long term evolution, in particular for HDP and AP factors. The developed countries were excluded in this study. The main reason stands in the very different levels of economic development and access to basic services between developed and de-veloping world. As a consequence, making such a global analysis will make less visible the differences within developing countries and mainly highlight the gap between developed and developing countries. Such approach would be useful in the case of a research aiming at assessing this gap.
DOI: 10.4236/jwarp.2018.103018 319 Journal of Water Resource and Protection
or climate variability trends. In such case, it is expected to strength the relation-ship between country development and availability of water resources necessary to ensure it. This would be more interesting as the climate change affects the spatial and temporal distribution but also the amount of water available in par-ticular in the sub-Sahelian Africa. In developed countries, the quality of fresh-water is already a key issue subject to policy regulation. In the developing world, it is becoming a growing issue due to the lack of treatment in a context of demographic growth and high urbanisation [32].
In addition, the AP is less discriminated across profiles if compared with the pilot study for 2004. In fact, Profiles 1 to 3 show similar behaviours, with a ma-jority of water resources dedicated to Agriculture (>60%) confirming its strong pressure on these resources. This similarity is due to the missing variable “water use intensity in agriculture” that measured for 2004 the water efficiency of agri-culture practices. Such variable allowed. This variable, together with irrigation variable, allowed to refine the analysis of agriculture dominance providing in-sights on the water-efficiency and productivity of the agricultural sector (from intensive agriculture using irrigation to less productive one mainly with rain-fed crops). This is to be noted that the irrigation practices are limited in the devel-oping world and occurs almost exclusively in countries from profiles 1, 2 and 3 (mainly Latin American, MENA and South East Asian countries).
The AP is in this study focused on water resources uses however, a reinforce-ment of this factor could be done opening it toward a better evaluation of the agricultural sector as a whole. In fact agriculture sector is very linked to the wa-ter sector and the development of countries. In particular, it could be explored how to evaluate the intensivity of rainfed agriculture.
This analyse of cluster changes illustrates a key aspect: the diversity of the de-veloping countries according to these 22 variables makes the five profiles fitting well or roughly each country situation. The reduction into 5 factors is a mean to reduce this multi-dimensional space and support the clustering of observations. The multiplicity of status and evolution is reflected by setting of several coun-tries in between of two profiles, or distant from the average behaviour of the profile. This is, for instance, the case of Swaziland, Madagascar, South Africa, mentioned as in periphery or in between two profiles. The advantage of such clustering around few and understanding factors and profiles is to ease the over-view of 103 developing countries, the identification of similar development be-haviours (or on the contrary specific cases) and potential changes. This broad picture is a useful basis to orient the deepening of the analysis or to identify weakest countries according to one or several factors of interest.
6. Conclusions
DOI: 10.4236/jwarp.2018.103018 320 Journal of Water Resource and Protection
development through the following factors: water resources availability and uses, the economic and social conditions, Official Development Assistance and gov-ernance context of the country.
This study performed a cross-cutting analysis on 22 indicators that represent environmental, socio-economic, governance and financial aid flows aspects. It considered a 15-year period with 4 years: 1995, 2000, 2005 and, 2010. Since [13]
detailed the methodology applied to analyse this multi-variate dataset, this paper focused and analysed the trends according to 4 out of the 5 thematic axes: Hu-man Development and Poverty (HDP), Agriculture pressure on water resources (AP), Official Development Assistance (ODA CI), a measure of Governance (GOV). Water Resources (WR) is estimated constant over this 15 years period, climate change impacts on Water Resources are generally observable on a longer period (minimum 30 years). Applying clustering methodologies, five reference profiles were identified and based on 2005 dataset which is the most complete dataset. The observations for 1995, 2000 and 2010 were in second step distrib-uted among these profiles. Profile 4 and 5 are the poorest country profiles and profile 5 the less advantaged one.
In summary, this paper aimed at analysing the evolution of countries toward sustainable development and better water resources management. Over the 1995-2010 period, the HDP has progressed in all countries (expect Bahrain). GOV and ODACI trends show more diversity with positive and negative evolu-tions. AP remains globally driven by agriculture water use for the large majority of countries. AP decrement is generally due to the increase of the water dedi-cated to domestic-municipal sector. 16% of countries moved out a reference profile and are considered mid-term changes, while short term changes (5 cases) are due to the specific position of these countries between two profiles.
The main output of this 15-year analysis is that 22 countries changed cluster on this period and, 17 of these changes can be considered as mid-term changes. This is in line with the nature of the processes and reforms required for a coun-try to improve its development, which correspond to long term efforts. A short majority of these changes (10 out of 17 countries) moved out of the most disad-vantaged profiles to reach profile 1, 2 or 3. Out of these changes, 6 were due to the fact that the country of was already in the cluster periphery, showing diver-gences with its central behaviour. This highlights the diversity of country situa-tion and therefore, the difficulty to define profiles that would fit well all coun-tries. Most of the other observed shifts (11 countries) were due to an evolution of ODA CI and GOV factors. In fact, these factors are responsive to short term changes, such as political crisis or natural disaster that makes observable trends on this relative short period. This current limitation in the assessment of devel-opment will be overcome with an extended period (>30 years) as soon as the data will become available. The Official Development Assistance flow per re-cipient country fluctuates, in general, over the observation period. Note that a drop of governance is often associated to a drop of ODA [14].
DOI: 10.4236/jwarp.2018.103018 321 Journal of Water Resource and Protection
with variables to better assess the agricultural pressure and domestic water im-pact on the environment (water quality, resources efficiency of agriculture, etc.…) which will support the assessment of the sustainability of the country de-velopment. Additional variables measuring the climate variability will also rein-force the WR factor and enable the analysis of its impact on HDP. Inequality as-pects and remittance flows can also be analysed to catch the quality and en-dogenous part of the ongoing development through, the enhancement of the measure of HDP and the complement of ODA, respectively.
Acknowledgements
The authors acknowledge that this paper is following up the methodological work done with Ms María del Rocío Rivas López, cited in reference (Rivas et al, 2016). This research benefited from the financial support of the Joint research Centre and European Commission through the project Mékrou.
References
[1] UN General Assembly (2015) Resolution Adopted by the General Assembly on 25 September 2015. Transforming Our World: The 2030 Agenda for Sustainable De-velopment.
http://www.un.org/ga/search/view_doc.asp?symbol=A/RES/70/1&Lang=E
[2] Glewwe, P. and van der Graag, J. (1988) Confronting Poverty in Developing Coun-tries: Definitions, Information and Policies. Living Standards Measurement Study. Working Paper, The World Bank, Washington DC.
[3] Temkin, L.S. (1993) Inequality. Oxford University Press, New York.
[4] Gillespie, B. (2005) Financing Urban Water Supply and Sanitation. International Review for Environmental Strategies, 5, 449-471.
[5] Meulders, D., Rycx, F. and Plasman, R.A. (2004) Earnings Inequality: Gender, Race and Sexual Orientation. International Journal of Manpower, 25, 244-250.
https://doi.org/10.1108/01437720410541371
[6] Foster, J.E., Lopez-Calva, L.F. and Szekely, M. (2005) Measuring the Distribution of Human Development: Methodology and an Application to Mexico. Journal of Hu-man Development, 6, 5-25. https://doi.org/10.1080/1464988052000342220
[7] Alkire, S. and Santos, M.E. (2010) Acute Multidimensional Poverty: A New Index for Developing Countries. OPHI Working Paper, 139.
https://doi.org/10.2139/ssrn.1815243
[8] Mihci, H., Tolga Taner, M. and Sezen, B. (2012) Employment-Adjusted Human Development Index. South East European Journal of Economics and Business, 7, 115-137.https://doi.org/10.2478/v10033-012-0020-8
[9] Gain, A.K., Giupponi, C. and Wada, Y. (2016) Measuring Global Water Security toward Sustainable Development Goals. Environmental Research Letters, 11, Article ID: 124015.https://doi.org/10.1088/1748-9326/11/12/124015
[10] Holden, E., Kristin Linnerud, K. and Banister, D. (2017) The Imperatives of Sus-tainable Development. Sustainable Development, 25, 213-226.
http://onlinelibrary.wiley.com/doi/10.1002/sd.1647/epdf
DOI: 10.4236/jwarp.2018.103018 322 Journal of Water Resource and Protection
Developing Countries. Hydrology and Earth System Sciences, 16, 3791-3816.
https://doi.org/10.5194/hess-16-3791-2012
[12] OECD (2017) Development Aid Rises Again in 2016: 2016 Preliminary ODA Fig-ures.
https://www.oecd.org/dac/financing-sustainable-development/development-finance
-data/ODA-2016-detailed-summary.pdf
[13] Rivas López, M.R., Dondeynaz, C. and Carmona-Moreno, C. (2016) Temporal Analysis of Human Development, Water Resource Management, Governance, and Official, Development Assistance Variables in Developing Countries (1995-2010). Proceedings ITISE 2016, Granada, 27-29 June 2016, 20-33.
[14] Dondeynaz, C. (2014) Water, Governance and Human Development Variables in Developing Countries: Multivariate Inter-Relationships Analysis and Statistical Modelling using Bayesian Networks. PhD Thesis, University of Liverpool, Liver-pool.
[15] Honaker, J., King, G. and Blackwell, M. (2012) Amelia II: A Program for Missing Data. https://gking.harvard.edu/amelia
[16] Jolliffe, I.T. (2002) Principal Component Analysis. Springer, New York.
[17] Fabrigar, L.R., Wegener, D.T., MacCallum, R.C. and Strahan, E.J. (1999) Evaluating the Use of Exploratory Factor Analysis in Psychological Research. Psychological Methods, 4, 272-299.https://doi.org/10.1037/1082-989X.4.3.272
[18] Velicer, W.F. and Fava, J.L. (1988) Effects of Variable and Subject Sampling on Factor Pattern Recovery. Psychological Methods, 3, 231-251.
https://doi.org/10.1037/1082-989X.3.2.231
[19] Johnson, S.C. (1967) Hierarchical Clustering Schemes. Psychometrika, 2, 241-254. [20] MacQueen, J.B. (1967) Some Methods for Classification and Analysis of
Multivari-ate Observations. In: Proceedings of the 5th Berkeley Symposium on Mathematical Statistics and Probability, Volume 1: Statistics, University of California Press, Berkeley, 281-297. http://projecteuclid.org/euclid.bsmsp/1200512992
[21] Murtagh, F. (1983) A Survey of Recent Advances in Hierarchical Clustering Algo-rithms. The Computer Journal, 26, 354-359.
https://doi.org/10.1093/comjnl/26.4.354
[22] UN Statistics Division (2015) The Millennium Development Goals Report 2015.
http://www.un.org/millenniumgoals/2015_MDG_Report/pdf/MDG%202015%20rev
%20(July%201).pdf
[23] Nancy, A. and Wilbert, S. (2006) Zimbabwe: La soif de terres aux origines du mouvement des anciens combattants. Critique Internationale, No. 31, 125-144. [24] Hume, T. (2014) Fiji’s First Election in Eight Years: Why So Many Coups in
Para-dise. http://edition.cnn.com/2014/09/17/world/asia/fiji-elections-explainer/ [25] Banégas, R. and Marshall-Fratani, R. (2003) Côte d’Ivoire, un conflit régional?
Politique Africaine, 89, 5-11.https://doi.org/10.3917/polaf.089.0005
[26] Bandyopadbyay, S. and Wall, H. (2006) The Determinants of Aid in the Post-Cold War Era. Federal Reserve Bank of St Louis Review, 89, 533-548.
http://citeseerx.ist.psu.edu/viewdoc/download?doi=10.1.1.204.1931&rep=rep1&type =pdf
[27] Alesina, A. and Dollar, D. (2000) Who Gives Foreign Aid to Whom and Why? Journal of Economic Growth, 5, 33-63.https://doi.org/10.1023/A:1009874203400
DOI: 10.4236/jwarp.2018.103018 323 Journal of Water Resource and Protection
Critics. Revue Internationale de Politique de Developpement, 1, 137-142.
https://doi.org/10.4000/poldev.141
[29] Faal, E. (2006) Growth and Productivity in Papua New Guinea, IMF Working Pa-per, Asia and Pacific Department.
https://www.imf.org/external/pubs/ft/wp/2006/wp06113.pdf
[30] OHCHR (2012) Nepal Conflict Report 2012: An Analysis of Conflict-Related Viola-tions of International Human Rights Law and International Humanitarian Law be-tween February 1996 and 21 November 2006. United Nations Office, Geneva.
http://www.ohchr.org/Documents/Countries/NP/OHCHR_ExecSumm_Nepal_Con
flict_report2012.pdf
[31] Coltart, D. (2008) Executive Summary: A Decade of Suffering in Zimbabwe Eco-nomic Collapse and Political Repression under Robert Mugabe. The Cato Institute, Washington DC.
[32] Nyenje, P.M., Foppen, J.W., Uhlenbrook, S., Kulabako, R. and Muwanga, A. (2010) Eutrophication and Nutrient Release in Urban Areas of Sub-Saharan Africa. A Re-view. Science of the Total Environment, 408, 447-455.
DOI: 10.4236/jwarp.2018.103018 324 Journal of Water Resource and Protection
[image:21.595.202.537.120.582.2]Appendix 1 Main Five Factors Loading (PCA)
Table A1.Eigenvalues and factors loadings of the first five factors after varimax rotation and kaiser normalisation.
F1 F2 F3 F4 F5
Eigenvalue 8.119 2.803 2.061 2.027 1.074
Variability (%) 36.905 12.741 9.369 9.212 4.883
Cumulative % 36.905 49.646 59.015 68.227 73.110
HDP AP ODA CI WR GOV
S 0.911 0.043 −0.142 −0.025 0.050
WS 0.823 −0.025 −0.086 −0.002 0.299
GDP per cap 0.858 −0.092 −0.217 −0.027 0.214
Malaria −0.844 −0.002 0.087 0.090 0.034
Child Mortal-5 −0.881 −0.169 0.135 −0.085 −0.207
Tot_with 0.518 0.709 −0.270 0.020 0.111
Dom_with 0.080 −0.925 −0.051 0.033 −0.029
Ind_with 0.088 −0.688 −0.063 0.343 0.119
Urban pop 0.689 −0.259 −0.262 −0.114 0.214
%Slums −0.537 −0.119 0.206 0.006 −0.313
WGI-PS AV 0.362 −0.057 0.247 −0.117 0.606
WGI-GE 0.584 0.084 0.046 −0.102 0.662
WGI-V.A 0.176 −0.078 0.133 0.240 0.797
ODA −0.298 −0.032 0.821 0.027 0.073
ODA-WSS −0.144 0.030 0.866 −0.011 0.181
School enrol 0.654 0.156 −0.078 0.137 0.248
School G/B 0.629 0.034 −0.018 0.234 0.293
FLF −0.677 −0.155 −0.069 0.347 0.067
%Irrigation 0.601 0.632 −0.009 0.160 −0.060
TWRR −0.184 −0.045 −0.105 0.810 0.219
Precipitat −0.046 −0.035 0.068 0.944 −0.008
DOI: 10.4236/jwarp.2018.103018 325 Journal of Water Resource and Protection
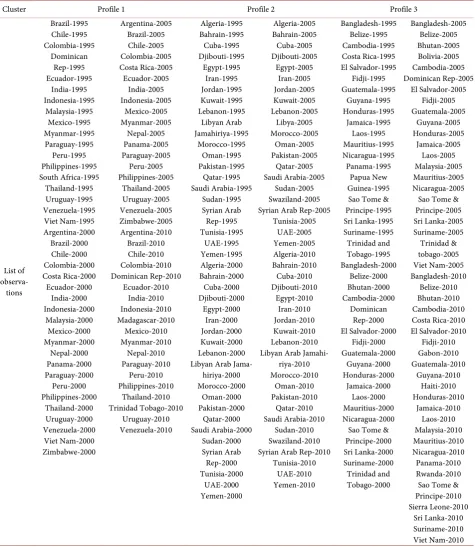
[image:22.595.64.540.109.657.2]Appendix 2 Distribution of the Country Observation by Profile
Table A2.Clustering of country observations for 1995, 2000, 2005 and 2010 across the 5 defined profiles.
Cluster Profile 1 Profile 2 Profile 3
List of observa-tions Brazil-1995 Chile-1995 Colombia-1995 Dominican Rep-1995 Ecuador-1995 India-1995 Indonesia-1995 Malaysia-1995 Mexico-1995 Myanmar-1995 Paraguay-1995 Peru-1995 Philippines-1995 South Africa-1995 Thailand-1995 Uruguay-1995 Venezuela-1995 Viet Nam-1995 Argentina-2000 Brazil-2000 Chile-2000 Colombia-2000 Costa Rica-2000 Ecuador-2000 India-2000 Indonesia-2000 Malaysia-2000 Mexico-2000 Myanmar-2000 Nepal-2000 Panama-2000 Paraguay-2000 Peru-2000 Philippines-2000 Thailand-2000 Uruguay-2000 Venezuela-2000 Viet Nam-2000 Zimbabwe-2000 Argentina-2005 Brazil-2005 Chile-2005 Colombia-2005 Costa Rica-2005 Ecuador-2005 India-2005 Indonesia-2005 Mexico-2005 Myanmar-2005 Nepal-2005 Panama-2005 Paraguay-2005 Peru-2005 Philippines-2005 Thailand-2005 Uruguay-2005 Venezuela-2005 Zimbabwe-2005 Argentina-2010 Brazil-2010 Chile-2010 Colombia-2010 Dominican Rep-2010 Ecuador-2010 India-2010 Indonesia-2010 Madagascar-2010 Mexico-2010 Myanmar-2010 Nepal-2010 Paraguay-2010 Peru-2010 Philippines-2010 Thailand-2010 Trinidad Tobago-2010 Uruguay-2010 Venezuela-2010 Algeria-1995 Bahrain-1995 Cuba-1995 Djibouti-1995 Egypt-1995 Iran-1995 Jordan-1995 Kuwait-1995 Lebanon-1995 Libyan Arab Jamahiriya-1995 Morocco-1995 Oman-1995 Pakistan-1995 Qatar-1995 Saudi Arabia-1995 Sudan-1995 Syrian Arab Rep-1995 Tunisia-1995 UAE-1995 Yemen-1995 Algeria-2000 Bahrain-2000 Cuba-2000 Djibouti-2000 Egypt-2000 Iran-2000 Jordan-2000 Kuwait-2000 Lebanon-2000 Libyan Arab
Jama-hiriya-2000 Morocco-2000 Oman-2000 Pakistan-2000 Qatar-2000 Saudi Arabia-2000 Sudan-2000 Syrian Arab Rep-2000 Tunisia-2000 UAE-2000 Yemen-2000 Algeria-2005 Bahrain-2005 Cuba-2005 Djibouti-2005 Egypt-2005 Iran-2005 Jordan-2005 Kuwait-2005 Lebanon-2005 Libya-2005 Morocco-2005 Oman-2005 Pakistan-2005 Qatar-2005 Saudi Arabia-2005 Sudan-2005 Swaziland-2005 Syrian Arab Rep-2005
Tunisia-2005 UAE-2005 Yemen-2005 Algeria-2010 Bahrain-2010 Cuba-2010 Djibouti-2010 Egypt-2010 Iran-2010 Jordan-2010 Kuwait-2010 Lebanon-2010 Libyan Arab
Jamahi-riya-2010 Morocco-2010 Oman-2010 Pakistan-2010 Qatar-2010 Saudi Arabia-2010 Sudan-2010 Swaziland-2010 Syrian Arab Rep-2010
Tunisia-2010 UAE-2010 Yemen-2010 Bangladesh-1995 Belize-1995 Cambodia-1995 Costa Rica-1995 El Salvador-1995 Fidji-1995 Guatemala-1995 Guyana-1995 Honduras-1995 Jamaica-1995 Laos-1995 Mauritius-1995 Nicaragua-1995 Panama-1995 Papua New Guinea-1995 Sao Tome & Principe-1995 Sri Lanka-1995 Suriname-1995 Trinidad and Tobago-1995 Bangladesh-2000 Belize-2000 Bhutan-2000 Cambodia-2000 Dominican Rep-2000 El Salvador-2000 Fidji-2000 Guatemala-2000 Guyana-2000 Honduras-2000 Jamaica-2000 Laos-2000 Mauritius-2000 Nicaragua-2000 Sao Tome & Principe-2000 Sri Lanka-2000 Suriname-2000 Trinidad and Tobago-2000 Bangladesh-2005 Belize-2005 Bhutan-2005 Bolivia-2005 Cambodia-2005 Dominican Rep-2005 El Salvador-2005 Fidji-2005 Guatemala-2005 Guyana-2005 Honduras-2005 Jamaica-2005 Laos-2005 Malaysia-2005 Mauritius-2005 Nicaragua-2005 Sao Tome & Principe-2005 Sri Lanka-2005 Suriname-2005 Trinidad & tobago-2005 Viet Nam-2005 Bangladesh-2010 Belize-2010 Bhutan-2010 Cambodia-2010 Costa Rica-2010 El Salvador-2010 Fidji-2010 Gabon-2010 Guatemala-2010 Guyana-2010 Haiti-2010 Honduras-2010 Jamaica-2010 Laos-2010 Malaysia-2010 Mauritius-2010 Nicaragua-2010 Panama-2010 Rwanda-2010 Sao Tome & Principe-2010 Sierra Leone-2010
DOI: 10.4236/jwarp.2018.103018 326 Journal of Water Resource and Protection
Cluster Profile 4 Profile 5
List of observations
Benin-1995 Bhutan-1995 Bolivia-1995 Botswana-1995 Burkina Faso-1995 Cape Verde-1995 Chad-1995 Côte d’Ivoire-1995 Ethiopia-1995 Gambia-1995 Ghana-1995 Kenya-1995 Lesotho-1995 Madagascar-1995 Malawi-1995 Mali-1995 Mauritania-1995 Mozambique-1995 Namibia-1995 Nepal-1995 Niger-1995 Senegal-1995 Swaziland-1995 Tanzania-1995 Zambia-1995 Zimbabwe-1995 Benin-2000 Bolivia-2000 Botswana-2000 Burkina Faso-2000 Cape Verde-2000 Eritrea-2000 Ethiopia-2000 Gambia-2000 Ghana-2000 Guinea-Bissau-2000 Kenya-2000 Lesotho-2000 Madagascar-2000 Malawi-2000 Mali-2000 Mauritania-2000 Mozambique-2000 Namibia-2000 Niger-2000 Senegal-2000 South Africa-2000 Swaziland-2000 Tanzania-2000 Zambia-2000 Benin-2005 Botswana-2005 Burkina Faso-2005 Cape Verde-2005 Eritrea-2005 Ethiopia-2005 Gambia-2005 Ghana-2005 Guinea-Bissau-2005 Kenya-2005 Lesotho-2005 Madagascar-2005 Malawi-2005 Mali-2005 Mauritania-2005 Mozambique-2005 Benin-2010 Bolivia-2010 Botswana-2010 Burkina Faso-2010 Cape Verde-2010 Eritrea-2010 Ethiopia-2010 Gambia-2010 Ghana-2010 Guinea-Bissau-2010 Kenya-2010 Lesotho-2010 Malawi-2010 Mali-2010 Mauritania-2010 Mozambique-2010 Namibia-2010 Niger-2010 Senegal-2010 South Africa-2010 Tanzania-2010 Zambia-2010 Zimbabwe-2010 Namibia-2005 Niger-2005 Senegal-2005 South Africa-2005 Tanzania-2005 Zambia-2005 Angola-1995 Burundi-1995 Cameroon-1995 Central African Rep-1995
Comoros-1995 Congo-1995 Congo, Dem Rep-1995 Equatorial Guinea-1995 Eritrea-1995 Gabon-1995 Guinea-1995 Guinea-Bissau-1995 Haiti-1995 Liberia-1995 Nigeria-1995 Rwanda-1995 Sierra Leone-1995 Togo-1995 Uganda-1995 Angola-2000 Burundi-2000 Cameroon-2000 Central African Rep-2000
Chad-2000 Comoros-2000
Congo-2000 Congo, Dem Rep-2000
Côte d’Ivoire-2000 Equatorial Guinea-2000 Gabon-2000 Guinea-2000 Haiti-2000 Liberia-2000 Nigeria-2000 Papua New Guinea-2000
Rwanda-2000 Sierra Leone-2000 Togo-2000 Uganda-2000 Angola-2005 Burundi-2005 Cameroon-2005 Central African Rep-2005
Chad-2005 Comoros-2005
Congo-2005 Congo, Dem Rep-2005
Côte d’Ivoire-2005 Equatorial Guinea-2005 Gabon-2005 Guinea-2005 Haiti-2005 Liberia-2005 Nigeria-2005 Papua New Guinea-2005
Rwanda-2005 Sierra Leone-2005 Togo-2005 Uganda-2005 Angola-2010 Burundi-2010 Cameroon-2010 Central African Rep-2010
Chad-2010 Comoros-2010
Congo-2010 Congo, Dem Rep-2010
Côte d’Ivoire-2010 Equatorial Guinea-2010
Guinea-2010 Liberia-2010 Nigeria-2010 Papua New Guinea-2010