i::r'~~O~~PIJERIC O~ONE
~ thesis nres8nt~a for the deerGs of
by
'fhe development of a I)]:.!.;y:.::ic£uly compact, light, robust ':met rel l,ti vel~y cheap f11 ter ozonometer for me;J8uring the ;;llilOllnt of ozone in t (Le atmosphere is discuf; sed.
Jzone uu.t::t fr'.);-n the filter instrument and a Dobson np8ctro,;>hotometer were found to 8}~~re~~ both in term:_ of relative change and 8oso1ute l1IDOunt. i t CLm '~le concluded from this close correlation bet~een ta for the complete ranGe 01' airmasl;j avai lable, th".t the filter instr'Jment con-~?tructed in this proj ect gives ozone values wi tb a.n
c:iccurhc,y cOillYdrableto that of the Dobson spc:ctrophotometer.
1), good correlation,\lCi3 found, in the limited ;3a~ple of dll t,3 available, between the daily mea:l 0 one values from the fil tE:r instrument and meteorolotr,ical upper air par::lmeters.
11..Il. .?utoir,,<1tic mo(~;e of oj)erution for the filter instrument
vzonc C:1U 1:;8 c.')IlSi ered a COl) serv~ti ve c~JDsti tu(~nt in the lo':!nr stritospherE; becau~')e of the consid.er ble r;hotochem-ieal shielding bJ the air ab0~e i t . ~ ll'-reforf", vD,rL::tions in UL;Olle act as a usefuli,r!;1.c8r of a tITlO E;pheric motion in this rb',;i)H ( ) f tlw .tmo<?here.
~his thesis describes the develoument of D filt~r ozone epectro hotoIDeter that ~as successfully use~ to measure at-mospheric ozone concentr tions and includes on account of the 1ni ti9.l d:-;!,ta ootclined fro::;] this instl'uwent.
~hc f i l t0 r ozone specTrophotometer Rnd itA associated
electronics were C0nstructed by the author with the exception
) f the equ'Jtorial mount and :::;Ull follower teleseo-~)e, '"hieh
'i. ere constructed in the ,Iilechanical orkf"\ho;J of the ,h;ysics
L;epClrt.~Jentt and the !)hasine; pulse ::;ener,;'.tor whieh Vv8,!:, c::evelop-eel by
i.:,.
~~orrish in the i~lee tronici, ;,orkshop.i':"nis Drorjt~ct \lve',i:,: the su;,';e tion of my ~::-,n')crvisor, :Jr
ih,rin this l:;roj0ct, '!.lsefL'l
c.is-CussiOIla ~'Je, e held '.vi th mClny peo,)le C:Jnci I would;~articularly.
L::.ckn:):,;l(;d;1;(~ tYe time ;'0 '~;e()8rou:.:ly f~lven by ;.:"U tic -_;'~:9.rltEls,LJr
I am Bob',;,en:1ett, "i.eic Ba.~,ller , Olive .o,-;e anG l>,n,~orrish.
J. hysics Uepartment of the ~ni versi ty of Canterbury for
finan-d_31 suplJort in tl~e fDrrn Df .:3 !lleaching i;'e~ lowship. lv;y thanks also to i,irs Marf;aret 3el:ell for typing ttis nanuscript ane. .. lr L3urie f:unter for photo raphic services.
I am indebted to the [';ew ,~ealand ;!eteorolopical iService for providing tbe facilities at invercargill that m:~deposs ible comparison measurements wit~ the Dobson spectrophoto-meter, f ')r the rGQucti on of additional ozone datil and for
;::-rovidinF; U;iper air and urfg.,ce pressure d;:l.ta. l'inancial a:: foistance for er-lui pment 1;'m,;3 received from the [; ew ,jei.lland
CliAl<l:hH. 1: Introduction
1.1 history
1.2 ·.l!heory
1 • .3 Jiim of lroject
2.1 introduction
~.2 er
2.~ ~hotomultiplier
3.1
Introtuction3.2
Jilters3.3
Losarit~nic HDplifier3.4
~pectral ~ensitivityUlul1.l'I:ER 4; Instrument 0011stants and lJata h(;duction
), ? '"1".1.:..
4.4
IntroQuction
.~bsorption '-'oeff'icients
x:';xtra ierrestl'ial Constant
13. t~ l':eauction
1 .1 1.3 1 .11
2.1
2.11
4.1 4.1
C .. l;.PT.EII.
5:
Comparison vd th Doi)son ~ipectrophotoli.leter5.1
Introduction5.2
Dobson ~~ectropbot0meter5.3
tesign Differen~es5.
4Sxperimental r~esul ts5.5
Effect of CloudC:.lAF": t::H 6: llelation bet1.ciieen '..Lotal Ozone and ,iieteoro-logical ~arameters
6.1 Introduction
6.2 l'ressure Corlel';-tion
6. L~ Upper Air li
e:ilperntures
6.5
Longer rCerm V:}rLltions 6.6 Short Term VariationsClllUlTER 7: Conclusion
J~PPt:NDIX.it: Cnlculation of Airmass
F'il ter ,)pectroohotometer
B.2 iilters
~ic~el ~ulphete Uexahydr~te 1ilter 13.4
" 5
.u. ,I ew Interference fil tars
5.7
6.1
6
7-• .,1
G.8
6.10 6.13 6.16
B.1
b.9
.~lect.r()riics
r lhotomultiplier C.1
C.3
Ihasin~ fulse G or C.6C.4- ,;un Follower .cr:vo ve
e.G
uJ L'.t::rlDIX D: Automatic Lata rroce!"sing
"'ieure
=ro~.011er ~1965)
2.3
~8rcent~~e tr~nsmi8sion o~ iaterference filter2.4 Cross-section of simrle interfer3ncc filter, ~rom
Croes-section of ;Jltilayer interfere~ce £ilter,
2.12 2.6 ,,:Jl,£,r 2pec tru'l e t ths o;roullCi
2.7 2.14
violet into ozo~e ata 2.16
j\iount 2.20
Gairs of interference ~ilter2
:.;. b
C 1.1i br tiou curve .t"() r lOt,::r:ri tlli:lic am.;;lif ier 3.8
..Figure
;~hot')lneteI' ant: f ~l teI' ozonorne1JeI' at .i.nvercare;ill,
f'ronI :·""t'·'n=':IS (l'li nr.=.c.s")
.L. ' d l~ t) _ L'C; .11 . _ !~. ... '-'
.5
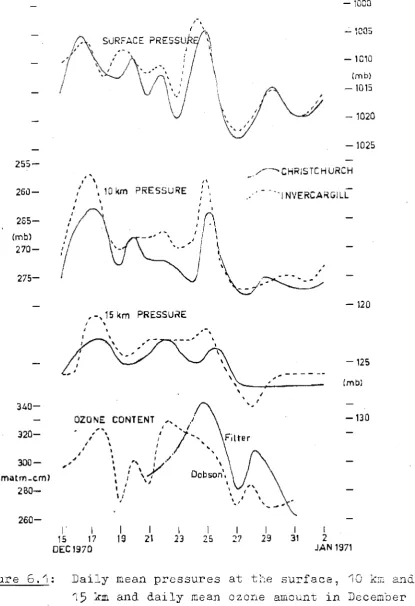
.10.1 T)aily me '.1.0. p::L'esE.ures at tne 3urface, 1() ~CL:l and
15
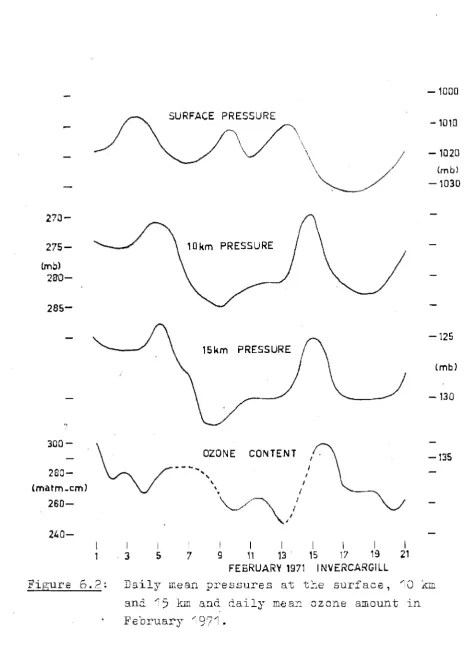
kn and I,'aily ~llea:n OZOlle amount in l.lecember 1970 6.4 (-).2 ])::iily ll18au p:::.'e"sures at the nuri':Jce, 10 Yilll and
15
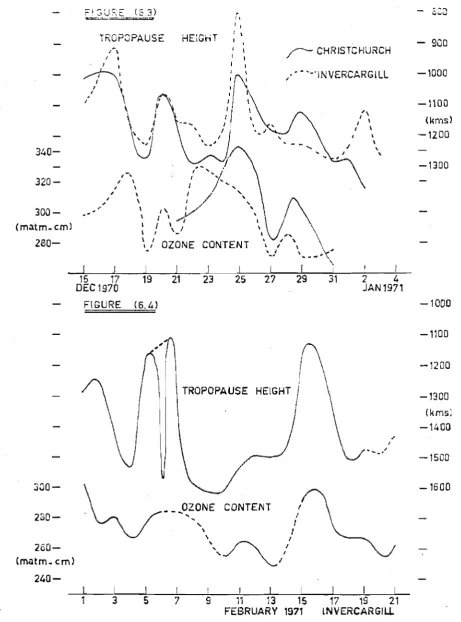
~;:n; 811(} daily mean ozone amount in 2ebruary 1971 5.5 6.:3 Compurison D:' ·jaily iJe&.n t rOj)opauB8 height and
drlily i:16Em oJ,one GJJlount in lJecembeI' 1970
6.9
(;. il Compari son of ('Jl.ily llle~in tropopau~:e height anddaily me"lll OZ,Jne 3J.i10unt in ii'ebru3.r;y 1971
6.5 })3ily mean 100 iiloteorer tu.x-e,:; ".G:1d daily uean
6.12
ozone amount i~l ~:ebru,J.I'y 1971
6.7 .. _IllOottJeC_ v~o.11.1e2 of prer: :.;ure, te:uper" -cure, tro
po-G.C) "hart ter;, V:lrl2.tlOn[~ i:J oz;one over ChriEctchurch
in December 1970 6.12
.1.1
3-D
geometry for airmass calculations .H.,.2~;ip;ure
D.1 Insi(e vie: 81' ~~-,;)Cct:::'Orj:lOtollieter unit n ,
.
.:.... ?0.1 . Lotomul tipli er ;:. 'J.:. supply C ~
.c::
.wOi:;nri -cI,(!Jic aJ',plifi er
\...j ,\ .a:,ang ;::mlE8 ~::;ener:.:1tor
1.1
C HAP T E R 1
INTRODUCTION
1.1 History
~he presence of ozone in the earth's atmosphere was
postulated about the turn of this century: firstly to explain
the very abrupt cut-off in the solar spectrum, observed at
the ground, at approximately
3000i,
and secondly to accountfor the~rming of the atmosphere at an altitude of approxim-ately 50 kms, Lindemann and Dobson (1923). It had been shown in the laboratory thRt ozone has a very strong aL)sorption
band in the ultraviolet region, Hartley (1881), in the region
2000 to 3000~, now called the Hartley bands, and by huggins
(1890), in the interval between 3200 and
,600~,
the Hugginsbands. ~'he ozone absorption coefficients in the Hartley bands were first measured by }I'abry and BuisBon (1913), who
o .
extended. their measurements to 3340A in the Huggins band.
Fabry and .Buisson (1921) showed, by measurinr~ the solar
spectrum in the range 3000 to 3340i, for various solar zenith
3llgles, and. therefore various transmission path lengths
through the earth's atmosphere. that the major absorbing
sub-stance was in the earth's atmosphere, and that its absorption
spectrum coincided with that measured for ozone.
Later observern confirmed F":;. ry and Buisson' B conclusion that ozone existed in the earth's atmosphere and was the
1.2
depletion of ultra-violet radiation from the sun, at the
sur-face of the earth. fllhe method used by Fabry and Buis50n, and
developed further by Dobson and Harrison (1926), to estimate
the amount of ozone in the atmosphere, relied on measuring
the reduction in intensity of a band of radiation, absorbed
by ozone, for which absorption coefficients had been obtained,
wi th changing path length through the atliiosphere.
The region of the solar spectrum within the absorption
bands of ozone, chosen for such analysis; needs to be free
from the absorption of other atmospheric gases so that
changes in their concentration will not affect the estimate
of ozone concentrations. The chosen bands also need to be
free from strong absorption bands of constituents in the
sunts chromosphere, so that the total irradiated energy in
these bands can be considered essentially constant. ouch
bands must therefore be free from Fraunhofer lines in the
solar spectrum and consequently need to be situated in what
are called Fraunhofer transmission spaces.
Many bands in the ultra-violet have been used
success-fully for estimating ozone contents. Ten bands in particular
have been used in pairs, various pairs being better suited to
different atmospheric conditions. Of these ten bands, the
International Ozone Commission (IOC)
(1956),
a commissionformed under the auspices of the International Association of
these bands, namely those witb centre wave-length at 3254 and
3055~,
and3398
and3176~,
commonly designated the "A" and"D" wave-length pairs, as the standard bands for Uf3e in ozone computations. 'rheae bands had been found to give the most
consistent results. the
IOC
therefore proposed th~t anyother wave-length bands used, should be compared with the
standard bands, and the results accordingly modified, so as
to agree with ozone values obtained from computations using
the "A" and "D" wave-length pairs. l!'or this reason, the "A" and liD" wave-length bands themselves were selected for this
project.
1.2 1heory
The "Fabry Buisson. method of ozone measurement, using
the relative reduction in intensity of two wave length bands
with path length, where the absorption coefficients are
mown, yields in f;eneral, the integrated amount of ozone in
this path. In particular, this path is usually taken as the
vertical distance between the surface of the earth and the
top of the atmosphere. Therefore, this method gives the
tot-al content of ozone in a unit vertictot-al colum .. L above the
observer. This quality is customarily called the "total
amount" of ozone, and is by far the most common ozone
para-meter .easured. 'llhe total amou.nt of ozone is usually
1.4
at ;3.T.P. ':rhis equivalent thickness has the units (10-3 cm
at ~~.T.P.) or (n atm.-em) and is given the symbol Q, after
Godson (1963).
Let
lA
represent the integrated solar flux in a narrowspectral band with centre wavelength A. If the effective
ozone absorption coefficient for this band is (lA then the
fractional reduction in solar flux in this spectral interval,
due to ozone absorption in the distance between x and x+dx,
is given by the relation
...
(1.1)where
Px
is the d.ensity of ozone at the height x and Xx isthe solar zenith angle :'Jt the height x which is, in general,
not independent of height. The reduction in intensity
however, does not capend solely on the amount of ozone in the
atmosphere. ;-cattering of radi[~tion by molecules and larger particles, reduces the intensity still further.
Juchmatter-ing can be characterised by the qU<ffitities ~A and Ox where ~A molecular scattering coefficient for wavelength
A
andOx
=
fraction of radiation scattered, per unit path length,by particulate matter at a height x. To a first approximation
Ox is assumed independent of wavelength. Thus, including the scattering coefficient as well as ozone absorption coefficient, equation (1.1) becomes
dl A
p a~ sec X dx + ~~ P sec X dx +
°
where p
=
air density at height x.Integrating equation (1.2) over the total path between the earth's surface and the outer edGe o~ the atmospbere gives:
=
• log
• •
aArS:
px sec Xxdx +SAS:
P sec Xxdx+
s:
Ox sec XxdxIA
ro
Xx
dx - I3AS:P
sec lOA;:;a
-aAJOpx sec Xxdx
-[0
o
x sec XxdX ( 1.4)\Jhere IA now represents the intensity of radiation in the narrow spectral band of centre wavelength A at the,~round,
and lOA represents the integr.'3.ted in tensi ty in this band
outside the atmosphere. ~o simplify the integrals on the R.H.S. of equation (1.4), the following assumptions are made:
Because there is a ID::lximum concentration of ozone at
some height, thnt is. ozone is not evenly distributed with
heitSht in the :ltmosphere, it is more appropriate to replace
sec Xx in the first integral with a con~3t:·.lnt sec Xh , where h is the zenith angle at the height of the maximum concentration,
assumed for standardisation purposes to be constant and equal
to 22 kIn for all sites. l'he second inte:'~;ral is replaced by
~Am where ~A' the molecular scattering coefficient, is
cal-culated from Iiayleigh's theory of 1::101ecular scattering and m
1.6
angle at the point of observltion, taken in practice to be
given by Bemporad's Function
(1907).
This function takesinto account both the sphericity of the earth and refraction
by the atmosphere. 'I':.lbulated values of this function are
gLven by List (1958). ~ince most particulate matter exists in the troposphere, the third integral may be approximated by
assuming that sec ~ has a constant value sec
z.,
where ~ is the solar zenith angle at the point of observation.'l'here-fore equ3tion
(1.4)
becomes:I log --L
lOA
where & m ,
coefficient.
&
dx, the eff9ctive particulate scatteringx
Because it is easier to measure the relative reduction
in intensity due to absorption and scatterIng of two
wave-lengths, rather than the absolute reduction of one, in
practice, two wavelength bands are used. This pair of bands
is chosen so that the effective ozone absorption coefficients
of the bands are as different as possible, while the
wave-length interval between the bands is as small as possible.
This makes the intensity of the irradiated flux in each band,
outside the atmosphere, comparable. At the edge of the
liartley band system, absorption coefficients are changing
rapidly with wavelength, and narrow bands are therefore chosen
J:,lor a second narrow band with central wavelength X',
equation
(1.5)
becomesIX'
log •
...;,.;..-lOA'
=
(1.6)assuming the spectral intervals are sufficiently close to
allow 5 to be independent of wavelengt:l.. '.rherefore subtract-ing equation
(1.6)
froID equdtion(1.5)
and rewriting in terms of 0, getI 10
log ~
r;:;
- log ~ - (~ ,-~ )m~ X X
Q ...
l'he total ozone amount lllay be calculated from equat.Lon
(1.7)
IX loX
if the quantities aX' aXI, t.1X' ~AI' log ~ , log ~ , ill and Xh are known. Of these qUl:-ulti ties, aX and
ax
I way beobtained from laboratory experiments, j3 and 13'\1 from IA f\.
L{ayleigh I s scattering theory, and log ~ is measured
.1. A. 1
directly with an ozone spectrophotometer, such a device
providing the basis of discussion in subsequent chapters.
The quantities sec X
h .3.::J.d ill, which are functions of
solar zenith angle, depend on the time of observation and
known way ..
the location of the site in a
loX
The quantity log ~o may be evaluated from a series of I
- ..L XI
direct sun measurements of log
IX
versus airmass, on a dayX'
when condi tiona remain uniform throughout the period of
1.8
The evaluation involves extrapolating a graph of log
IA
S -
(~A'-~A)m versus sec Xh back to where sec Xh :; O. bucha procedure necessarily requires that Q and h remain constant 10
over the observing period. necause log ----I A represents the
°A'
log ratio of the incident intensity outside the atmosphere,
which is 9.ssumed to rema.in constant, such 9.n evaluation needs
only be done once and for all. In practice, several dqys of
uniform conditions are chosen so that a better value of 10
log ~ may be obtained. ~,;i th all the quanti ties on the
A'
R.I-1.f;. of equation (1.7) determined, a value for the total amount of ozone may be calculated.
The assumption that
&
is independent of wavelength,(i.e. the scattering particles are. large compared with the
wavelength), is not true in all conditions. This assumption
can thus introduce sizable errors. However, these can be
minimised using two pairs of wavelenp;tLl bands. This is
because the separation of the centre w~'j.velength in each pair of bands is approximately 200~, and over a small wavelength
interval the ::?cattering coefficients are changing almost
linearly, the absolute value of the difference in scattering
coefficients for each pair is almost equal. Consequently,
8ubsti tution of scattel'ing coefficients in the two pair
formula almost completely removes the dependence on
scatter-ing from the ozone calcul~tions.
in section
(1.1),
equation(1.7)
becomes:where
and
f., log I AD - II lo@; lOAD - 6t3ADm
llaAD sec !h
-~ log rOAD :::
b. (I'D A
(1.8)
'rhe laboratory calcul::1tion of ozone absorption
coefficients has received very active scientific interest,
since the tLne of Fabry and Buisson
(1913),
with notablework by NJ' Tai Z.e and Choong ~hin Fiaw
(1932),
Inn and Tanaka(1959) and Vigroux
(1953,1967).
The values accepted by the IOC at its meeting in
Lucerne in
196'1,
IOC(1968),
retain the 6cxAD value calculatedby ~;ir Charles l~ormand, from th~? results of Vi~roux (1953).
and published in the "Observer's Handbook" (Dobson
1957)
foruse in the International Geophysica.l Yec:tr. The value
1.388
had been maintained for uniformity by the
roc
since the mostrecent wor.k by Vigroux (-1')67), g~ve B. value of
1.396
for1.10
differences for each wavelen:'th pair, now accepted by the lOC, eTe given as 1.74-8 for (0:
3055 - 0:3254) and 0.360 for (0:3176 -0:
3398), thus maintaining the 1.388 value for LlClA.D.
'l'he values of Hayleigh scattering coefficient, tabulated
by 'Dobson (,'1957), are ~Jhown in 'l'able 1 below:
J-'air Centre ~avelen~th :'~olecular lesignation in band in .1 Scattering Coeff.13
~' ~. S'-S
3055 0.491
A 0.116
3254 0.375
3176 0.416
D
0.104-3398 0.312
from Te,ble 1, 6~f~D ::; 0.012.
Using these experimental values and making the aSS1 rnp-tion that m ... sec 'Xh, which is accurate to within :3 percent, provided ~ is less than 74°, that is sec 'Xh is less than
3.5,
equation (1.8) becomes:Q ==
Ll log lAD - 6 log lO kD
1.388
sec 'Xh-
0.009 (1.9)where ~2 is in the standard units (m atm-cm).
fl1he amount of ozone in a unit column between the
by m.ea;;:3urint~ -the value of b.
lAD'
with an ozone spectro-,:-l::..0tometer, at Borne value of sec 'Xh, when b. log lOAD has been determined.
1.3
Aim of :Pro;jectIn the Heport by the Panel on Ozone to the Committee on
Atmosph€'ric ;3ciences, l'lational Academy of ~.~cience - National
Hesearch Council
(1965),
with regard to the Internationalobservation programme, it is suggested "that considerable
effort be Diade to increase its (the Dobson ozone
spectro-photometer) reliability and sensitivity, make it an automatic
recording instrument and reduce its size and pricell •
'1'he suggestions of this report provicied the aim for this
project. It war:; immediately obvious that the physical
cimensions of a double ':lu',rtz monochDomator could not be
reduced significantly without IOf;s of resolution and because
this resolution also depends on precision engineering, the
possibili ty of lowerinl'S the cost on. this conventional
instru-ment seemed unlikely_
i~ new type of spectrophotometer was required, that could in fact be smaller, as relL~ble,and cheaper than the conven-tional system.
In Chapter 2, the design of such a spectrophotometer is
1.12
Chapter ) compares its .performance with that of the standard
Dobson ozone spectropho1;ometer, a:ld in Chs..pter 6 the correl-ation between the limited filter O~OD.e data available and
2.1
IN S'l'RlTMEN'r AT I ON
2.1 Introduction
'l'he method for measuring ozone has been described in
Chapter 1. l.t has been shmvn tlwt the values for the logar-ithm of the intensity ratio of two wavelength Lands in the
ultraviolet for different values of airmass, must be obtained
in ord.er to estimate the amount of ozone in a column
extend-ing vertically from the observer, to the outer edge of the
atmosphere. fl'llis is called the total anl01lnt of ozone.
2.2 Spectrometer
A spectrometer-is therefore required to select these
ultraviolet bands from the solar spectrum, and to enable the
measurement of their intensities. A serious problem is
immediately introduce~ as only E'Jbout
5
percent of the sun'sirradiated energy re~ching the earth is in the ultraviolet. Ii'his means thclt any device used for the selection of these
ultraviolet bands must be very selective indeed and. ideally
"blindrt
, that is, not :'.ensi ti ve, to radiation on the long wavelen~th side of the required band.
'rhe problem is further complicated by the fact that
') ' ) L_ 1'-_
belo',v
:;300~
a'.':ld c',)!1,9p.qll.8ntl;r <l'1Y transmission optics in thes~)ectrophotometer Must be qU'3.rtz, or more r;enerally, made of
so.rne ultraviolet transmitting material. (ligure 2.1 shows the trailsmission spectrum of ordinary window glass from Koller
(1965)).
2.3
Filters:in interference filter, first conceived by Geffcken (1942) is i;; efect, a specialised form of the Fnbry J'erot etalon. In this latter device, shown schematically in figure
(2.2),
after Andrews(1960),
circular interference fringesare observed on the scree~l
:P,
for monochro'J1lltic radiation from source ;~~, due to the superposition of rays produced by the rnultir;le reflectious froID the artially silvered glass plates that bound an air gap of width d. Since the series of rays )roduced through multi()le reflections are parallel, a lens .L is required to ma..1(e the seri as superi'.npose, so that interference may be oo;:;erveo.~ssuming n:::1 for the refractive index of air in the gap, reinforcement occurs for wav~len~th ~ when
2 d cos
e
=
m" (2.1)100r, ---c---~
c : )
80
~ 60
E
", c
m
~
3500
Wavelength In angstroms
4000
Transmission for two thicknesses of window glass. (Data supplied
courtesy of Pittsburgh Plate Glass Co.)
2.#-A _ 2d
m (2.2)
where .m is any inte£l;er. For a white light source with d ==
5
mm, 12,000 frinBes would be produced in the ranp:e cf the vi::;ible spectrum. However, if d is very small, only one or two narrow wavelength bands would be transmitted in the visible spectrumana.
the rest would be reflected.The pair of semi-transparent metallic films therefore act as a filter, passing nearly monochromatic light. .i.'he transmitted energy, as a function of wavelength. is shown in
/
figure (2.3), after Va~iC:ek (1960), .for v;,riOllS reflectivit-ies R. If' the transmitted maxims. are to be widely separated, a small value of m is required.. cl'hi.s can be obtained only if the reflecting surfaces are very close together. ~'or the maximum m=2 at wavelenp:;th ~, by 8Qu0tion (2.2), the metal
films would need to be separated b,' a distance~. ·.the maximum ill==1 will then appear at 2~. I:,>mall separations of the order of a wavelength are now possible using sophisticateu. vacuum deposition techniques.
~o make a simple single layer filter, a semi-transparent metal film is evaporated on to a substrate. A tbin lo.yer of some dielectric rnateri al, such as cryolite (3NaF .1I.1F 3)' is evaporated over thi s £il,n, which in turn is coated. with :1I1O-ther layer of metal film. Usuall;t another glass plate is placed against this second film to provide mechanical
Figl:!.re 2.3: rc ssion of I~terfererice
F'il ter various Film Reflections, from
Vas{c ('1 )
GLASS
GLASS
EVAPORATED
METAL FILM
2.6
in figure (2.4), af'tel' Xndrevs (1<)60). :':"he thicknesE of the dielect;rlc fi 1m is greatly eXEgrjerated in this figure.
If the dielectric m9terial has refr2ctive index n, equation (2.2) becomes:
i\. :0:
-
2nd m'i'i"here this is the condition for maximum transmi ssioc of wave-length A at norma.l incicetlce. If more than one band is tranf~-mitted in the region of interest, this can be removed by
using a sui table ~{bsorbing filter, in series wi tl1 the inter-ference filter.
Figure (2.3) shows that as the thickness ()j~ the metal film is increased, (tbat L:>, 9.h the reflectivity is increas-Ed) the ha.lf width of the filter oecreases, but simultaneous-ly the greatest transmission of the filter also d.ecreases. A compromise must therefore be ree-lched betweer half wiclth and transmission. Also, since the abeorbing filter used t:J block out some unwanted maximum. will not be 100 percent trans.itt-ing in the wavelength blmd of interest, this 1A"ill further reduce the nett transmission of the filter.
The great advantage of interference filters, over the older absorption type, is that they are not heated. by the passage of intensive radiation. I~eally, all radiation not tr&nsmitted, is reflected. Yhere is a small amcunt of
than in the older filters.
Any absorbin[~ fil ters used in conjunction ""'i th an inter-ference filter, to remove side lHUlds, are placed on the
transmitting side of the interference filter so that tbey are subject to a much lower tota.l flux and consequently experience less heating.
This considerably reduces the problem of shi£tin~ band-passes with changing light intensities. ~rhig problem could have produced sizable errors in this particular application when the sun i~ the Rource of the radiation being weasured.
Interference filters, 8.8 well as absorption filters, have
a finite tempAr?ture coefficient for shifting bendpB8s. A tempernture coefficient of between. 0.1 and
0.3
~/oO was found by Blifford when testing a series of comruercial filters - Blifford (196r»). The increase iT'. e.entre w3vEllength was reported to be linear with increasing temperature over the range -60°C to +600C. 'rhe maximum values of the temper-ature coefficients of bandwidth and transmission fou.nd. in the( 0 )-1 sample tested, were less than 0.01 C •
The peak w:.ivelength of the transmission band t 9.6 can be
seen in equation
(2.3),
depend.s linearly on both the refract-ive index and the thickness of the layers of material used in the filter.of refractive inil.ex fo:, .substances sL:nilar to those usually used in interference filter2, i t may be assumed that the tem-ner>-1tUI'e chanfr,es ar;;) due to v,Clriations in refractive index,
(~Jolfe, :"I~llard 3Ild 1,]cCarth:r, 1963). Blifford also reports
:'i ndinl' little chan[~e in the trLiIlsmission characteristics when tiltinf5 the filter relative to the incident rAdiation, ')rovidec1 the t i l t is less than 5 degrees.
Using the aver'c~e tomperature coefficient obtf:.ined from the series of ril ttirU tested by Blifford ~ 1966) and the
absorption coefficients of Vilr,roux (1953, 1967) and Inn and rranaka (1959), a chance of 10°C in the a.mbient temperature '\\'0'.110. ;,roduce a 2?~ cr ::=,.:2ge in th~· 2.bsor;,tion coe:'::ficient of t~e
3055Y.
1:'ancl filter Emi~ a COrlsecment 31' c.he.nge in tne estim-sted vslue of c~one cont9nt.'itL tt:.C ~icld of view oI t:tG in.strurr.ent set c:.t 1;)
d€f;recc, t i l tine th,c.: 1'il te:!:'E eVer teis r;~.Lge produces no Et~~'preci!O,ble ('.:C;-m~e in transmissioL chare,cteristics.
If A is a substance of high refractive index and B of
low refractive index, figure
(2.5)
shows a typicalcross-.r
section of a multilayer interference filter, after Vasicek
(1960) •
'.l:he centre film is made of substance B and has thickness
d
=
~ t:::n,
which determines the wavelength for which theB
transmission will be a maximum. On either side of the cen-tral filter are films ~ thick which have alternately high
and low refractive index in the order (A,B,A,B, ••• I~,A).
'l'he optical thickness of one quarter wave1eniJ:th is chosen
since the reflected waves tr'lve1 an optical path of ';2
wave-length and also undergo a phase reverse! on reflection. 'l.'he
physical
....L
dA "" 4nA The
thickness of the A films is therefore given by .".
and of the B film by dB
=
4nn
•
(A,B,A,B, "', B,A)
series provide reflectionscom-narable with those obtained using metal films, but with much
less absorption. The multilayer interference filters have a
central layer and a reflective set 6n either side just as in
the classical B'abry-Perot type.
lnterference filters of this type have been available
in the visible part of the electromagnetic spectrum since
Geffcken (1942). Imwever, the availability of film forming dielectrics with the required high ultraviolet transmitting
properties has been the limitation in the development of
2.10
Osherovich
A.L.
et ale (1969) report using27
layerinterference filters, with alternate layers of cryolite and
lead fluoride, to obtain narrow band filters for the
ultra-violet.
Narrow band pass interference filters with transnl.ission
peaks at preselected wavelengths in the ultraviolet became
available commercially only in the late 1960's.
In September 1968, the first pair of narrow band
ultra-violet interference filters with transmission peaks specified
at 3254- and 3055~, correspondin!'; to the ItAII wavelength pair,
was oraered.
Detail of these filters, others subsequently purchased,
calibration procedures, the need for further blocking to
eliminate transmission leaks, and the manufacture of such
blocking filters by the author, is given in Appendix B.
It is sufficient to say that two pairs of narrow band
filters (half power band width of approximately 30~) were
eventually obtained. iJ.lhese pairs had centre peak wavelengths
corresponding to the "All and liD" wavelength pairs. After
testing and combining these filters with selective absorption
filters to increase the signal to noise ratio, a system was
available to enable the wavelength bands used in the
calcul-ation of "total oz:·ne" toL,e separated from the solar
2.11
2.4 l~hotomul tiplier
Jrbe integrated intensity of solar radiation in the selected ultraviolet bands, passed by the interference filters, has to be measured. A photomultiplier with an
ultraviolet sensitive photocathode was chosen to convert this ul traviolet radiation into an electric current signal. ,I. gain , this particular region of the spectrum, between 3000 and
3400~, shows itself as an awkward region i'rom which to obtain data. f.ilost photomultipliers, sensi t i ve to radiation in this region, the near ultraviolet, are produced simply by encap-sulating the photocathodes and dynodes in a quartz envelope rather than the normal silica glass envelope. This means that rather than the photomultiplier being sensitive just in the near ultraviolet, the response function is an extension of some larGe visible response. Consequently, a
photo-multiplier of this type, shows a spectral preference for
radiation outside the near ultraviolet, and any noise in this region is consequently preferentially amplified.
lihotomul tipliers usually used in ul t;raviolet work are of the ",solar Blind" type, having a cutoff at approximately
o
3000A, to make them IIblindll to solar radiation and of course useless for ozone applic3tions. ~ecause of the rapidly
decreasing intensity with decreasing wavelength. in the solar ultraviolet reacbing the ground, i t is only radiation wi th wavelengths greater than the signal band that cause
r-'-"
t. .. ) ""
I- f',
\ . J
" ,'-., .-'"
v:J
4:".~0=
i"I 'I I· t'\ I:, r
"~;;"~-"'J '
"'~-'-'
c ... r:::-'-'" , W ... ,
'-'
-<, ''''
'--:J
~ ~
l"J
.
,J!'i
; i :i
, ;
2.5: - Cross-sec filter D A B A B A B A 8 A B A B A
e
A Don of multilayer int
Vasicek (1960).
~; ~,-:-,I~.~r"
<F:: ,:,;..~ !:-.;:::. [j<;;\,
c, -. i.":!1 L d ?
~<;;J;U
ar spectrum at the
erence
-:::::::;;-\ )
2.13
Therefore the ideal photomultiplier for ozone measure-ment is one that has a high wBvelen;;-;th cutoff at about
'500~.
To the author's knov,ledge, no tubes of this type arecommercially available to the Western .(orld at this time. Osherovich A.L. et ale
(1969),
report using a tellurium-potassium-rubidium photocatilode th;o.t does not respond to radiation ',bove5000~. ~'lon-production
line developmental tubes using rubidium-telluride photocathodes are now becoming available, and the advent ~f such tubes on the commercial market can do nothing but improve the signal to noise ratioof the system.
rl'he photomultiplier chosen for the spectrophotometer, built by the author, was a nine s'tage, side-on type, 11-28
photomultiplier ~ manufactured by rWA. r:L'he tube uses a cesium bismuth opaque photocathode and cesium-antimony dynodes in an ultraviolet transmi ttint-~ envelope. 'l'he nominal peak spectral response is at 3400 ± 500R. This ture is cl&ssified as
baving an C5 type response and the resi,onse function is shown in figure
(2.7).
'llhe high wavelem::;th cutoff at 6500A o can be seen in this figure. ':;:the stabili sed hi~~h voltage supply for the photomultiplier is detailed in Appendix C. Modifications to the standard bleeder chain configuration for the photomultiplier are discussed in Ehapter 3.2.01
2~
•S
t
2.15
The current produced by the photomultiplier, proportion-al to the incident light intensity, was passed through a
log-arithmic amplifier to convert this signal into a voltage
propol,tional to the logari thIn of this input current. 'II hi
system allows the meaGurement of intensity differences over a
d;y-namic x'ange of four decades, that is, an intensity
differ-ence of 10. 000 to 1, on a single scale. A d;Y"11.amic range of
this magnitude, although theoretically possible, is not in
practice Observable. ;.)uch an intensity difference would lJe
measured when ;:J was approximr:.<tely equal to 860 t by which time
the incid.ent light intensities would h·Jve dropped to such a
degree that the signal levels would be buried in the clark
current of the system.
lrhe output voltage, which was directly measurable on a
chart recorder, or could be digitised and recorded on paper
tape. was directly proportional to the logarithm of the
intensity input. which is the basic parameter used in ozone
calculations. 'llhe transformation from solar ultraviolet
radiation, reaching the earth, to recorded signal is shown
in block diagram form in figure
(2.8).
The details ofcircuitry and design of the logaritbmic amplifier used in
this project are included in Appendix C.
The transfer of ozone intensity data on to punched tape
I .
I
SOLj~\R
I
UL TRAVIOLE
T
i
Ii 1
::l,7_'
_ d .FJLTERS
PHOTOMULI PLIER
LOGARITHMiC AivtP
LJ NEAR AMP
I
CHART
IRECORDER
I
CONVERTER
l\~
TAPE
PUNCH
, POPS
.4 .I
Block diagram of
ultraviolet into ozone
, from solar
2.17
signal from the logarithmic amplifier consists of a four
level step function which is repeated with every revr:,lution
of the filter chopper in [rout of the photomultiplier. The
interference filters are mounted, as is shown in figure (B.1)
in Aj::.pendix B, on an assembly that rotates in front of the
photomultiplier and thus the photomultiplier views
sequential-ly, radiation in each of the four w,I.velengtrJ bands.
'110 identify each particular band, a phasing pulse is
generated by a reed rela.y switch, activated by a magnet
attached to the rotating filter assembly. This phasing pulse
is shortened in duration and s.l'iaped by means of a Bchmi tt
trigger, monostable multivibrator and differentiator. The
details of the electronic circuitry to perform this function
are given in AI)pendix C. 11
118 phasing pulse is used to trigger "interrupts" on the l'D1.18 and cause the analog-to-digital
converter, into which the output of the log amplifier is
being fed, to be read and the log intensity value to be
recorded.
~he computer programme used to effect this data collect-ion operatcollect-ion and its subseauent output on to paper tape, is
given in Appendix D.
The .PDP8 system, in the IJhysics Department at
Christ-church is equipped with a real time clock. It was therefore
2.18
time intervals, and al{~o store the real time value at which this data was recorded. On command, this data was punched on
paper tape and listed on a teleprinter.
In the automatic mode of operation, it was of course
necessary for the ozone photometer to maintain aligrun.ent on
the sun automatically. ~his was acl:ieved by bolting the l.mit containing the filters and photoml.lltiplier on to a
mount, free to rotate in the equ!'!.torial plane and !}djustable
in declination. A three inch Newtonian telescope \"a9 Illounted
beside this unit with an ORP61 cadmium sulphide photocell,
used as a light dependent resistor (LDR) at the focus of the obj 8cti ve. 'rhe LDH was in the load arm of the power supply to the motor drive on the equ8torial mount. Uonsequently,
changes in resiEltance due to changing incident light levels
on the LDH, changed the vol tat~e, supplied. to the drive motor. This servo mechanism therefore adjusted the drive speed so as
to maintain the alignment of the telescope, and consequently
the filter spectrophotometer, on the sun.
fl'he spectrophotometer was designed to have a viewing
angle of 1~ degrees. A viewing cone with this angle was
recommended by Osherovich and hodionov (1961). '.rhe tracking telescope, tracking the leadinl; edge of ·the sun, could
main-tain alignment to within two seconds of arc with clear skies.
2.19
speed was provided, slightly less than the optitlU;Il drive, and
t;he LDR provided perturbations to this speed. rbis allowed
complete clouu cover to persist for twenty minutes before
trackillg was lost. If the cloud cleared within this tima,
the trac.r.:iog device would. drive the sys't:;em back into correct
alignment. If however the cloud did persist for longer than
this period, the sy,£!tem would have drifted out of range of the
sun and thus have lost the power to drive it back. Data
recorded when cloud obstructed a direct view of the SUll could
easily be detected by the drop in light levels.
'1he apparent diameter of the sun is 32 minutes of arc
at the earth. and with the cllanges of declination of 12
min-utes of arc in twelve {.lours in the equinoctial period,
radiation frow the whole solur disc can be viewed throughout
the day without chan!3'ing the day's initial declination
setting.
1'0 ensure an unimpeded view of the sun, from sunrise to sunset, throughout 'the yei..r, the equatorial mount was fixed
on the roof of the eight storey ,Physics Department bullding.
The equatorial mount, tr':!.cking telescope
and
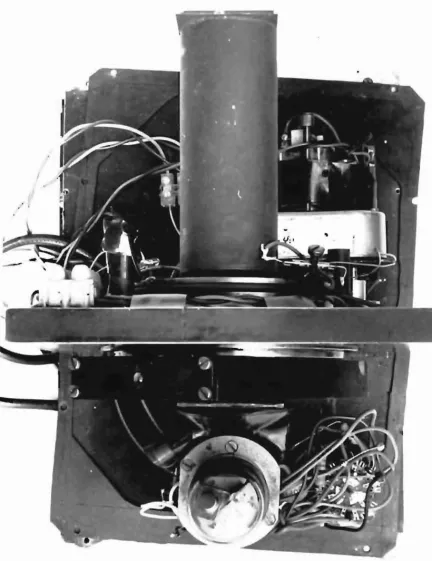
the smallozone spectrometer mounted beside it are shown in figure
2.2()
~ - ~ - -
--
-r;
...
,...4~ -.... _
' [image:42.554.40.485.51.570.2], "" ... "
Figure 2.9: lfilter Ozone p _ctropllOtometer on E~ll[\tori::tl
2.21
In the instrument testing stage, the teleprinter
list-ings were used to produce ozone values manually. .ti.outine
ozone measurements are now being made by :'!lr ii.. Basher, and values obtained usinp;j the paper tape and a data processing
system on the IB1\i] 360/44 computer.
II'he way in which the ozone values were obtained from
3.1
C HAP T E R 3
CALIBRATION
3.1
IntroductionTo transform the ozone data obtained from the instrument
described in the previous chapter to real ozone
concentrat-ions in the atmosphere, it is necessary to perform tests to
calibrate the vRrious instrument parameters affecting the
data recorded.
In Section 2, the calibration of the interference
filters to obtain the centre wavelengths is described. The
calibration of the logaritttlIlic amplifier, to enable recorded
signals to be converted into standard logarithms to the base
10, is contained in Section
3,
while dection 4 deals with thespectral sensitivity of the photomultiplier.
3.2
FiltersThe composite filters are described in Appendix B. For
calibration, each interference filter was placed in a Cary 14
Hecording Spectrophotometer (qliartz optics). In this
instru-ment the spectrum is automatically scanned and the optical
transmissivity recorded simultaneously. :rhe \rmvelength
marker on this photometer was calibrated using blown
was found to be
5~
too low on the forward drive and6~
too loV{ I)n the reverse drive. I-~he 1~ difi'erence was attributed to backlash in the drive system. Consequently, all wave-length markers on the recorded curves were adjusted by these amounts. The transmission slide wire was used in the photo-meter. This allowed a full scale deflection of either 0 to 100 percent transmission or 0 to 10 percent transmission.'l',ith no filters in the sample cavitJT , the comparison
beam in the spectrophotometer was balanced ~tith the sample beam to p;ive a tr~,nsmission scale reading of 100 percent. This balance was found to be constant over the range 3000 to
3500~
and consequently no separate adjustment was required for each filter.A spectral transmission curve foI' each filter was then obtained and. thl")se are shown in figure
(3.1).
In this proto-type ozone spectrophotometer, two additional blocking filters were used. These were a Corning CS7-54 filter and a nickel sulphate hexahydrate crystal filter.%
(2
(j)~fl
:?: (f)
z
«
n::
r
w
<:)
<.{
.-Z
w
r:
" " 0IX
LlJ
a..
0
10-r
2'c22GO
"305S"
B.W.
,d.
"3254"
______________
B_~_~
__ . ________________ _,1.
30[\1
'PrGf1:3:oi ~)ion npoctra of I I'> I
tnt erOTIce filters
"33sa-B.w.231
3.4
!J.lherefore, a bloci.(ing- fil ter wit h good transmission in
the ultraviolet between 3000 and 3400~ is required, but with a very sharp cut-off between 3400 and 3800~. In his paper on ultraviolet filtering tec;miques, Kasha (1948) showed the
transmission char~cteri8tics of nickel sulphate hexahydrate.
'r.his substance has the required spectral characteristic to block these unwanted sidebands.
In spectroscopy, filters are usually made by placing a
solution of the required substance in a quartz vessel.
however, in this ar\,Jlication, the author decided to use a
crystal filter of nickel sulphate hexahyd.rate. rJ:he proposed
long period of operation, the inconvenience of using a liquid
filter ·jnd. the possibility of evaporation producing a change
in transmission, because of increased concentr&tion, were the
reasons for this choice.~jowever, manufacture of such a
filter proved rather more difficult than was expected because
of the preferential formation of nickel sulphate
hepta-bydrate, a crystal form that dehydrates readily in air. The
anhyclrouG salt does not transmit the ultraviolet. A descrip-tion of the manufacture of nickel sulphate hexahydrate
crystals is given in A;.pendix B. r:ehe transmission curve for
a polished nickel sul"phate hexahydrate crystal filter is
given in figure
(3.2).
The other blocking filter used was a Corning
CS7-54
spectro.scoplS t~:; for ul tra.v-.i.olet wor~{:. It has a tmiform
transmL:'Eion of SUiv 'oet'Neen 2900 and 3500~, and good blocking '»-.l.' d b-r ... · ,0' 0-'j(.
cliar8.cteristics bet~'leen (~'3UO a...i ___.n. It does bowever have
o
Cl sizable red leaK, starting'lt 6600.11 and exte,ldin.(;; into the near infrared. l'h~) transmission curve for trlis filter,
obtained from the Gary ·V~·, is given in figure l3.3).
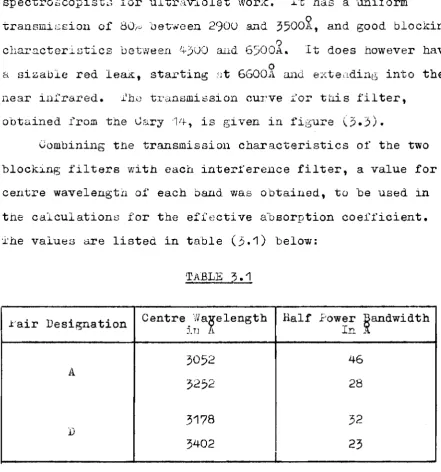
Combining the transmission characteristics of the two
blocking filters witb each interference filter, a value for
centre wavelengtil of each band was obtained, to be used in the cai.culation8 for the effE)cti ve a-bsorption coefficient •
. 'j:he value8 are listed in table (.3.1) below:
TABLE 3.1
l:'air Designation centre.WBlelength Half .Fow~r ~andwidth
J.T) ~ In _
3052 46
A
3252 28
3178
32
D
3402
23
The nett transmission through each of the combined
filters was between 1 and
3%.
However, the important qualityis not the absolute trAnsmission, since there is plenty of
energy available from the sun, but rather the signal to noise
[image:48.553.65.507.83.556.2]i
WI.
t- '
Z
WI
,...,
, - ¥
._ I c,:· I
,,;:.
L1
3Joo
Ir
ran ss ctru;r.0:
NiS crystal filter
o
A
7000
F" 3 "\
tg. '') :.
ssion ectrum offilter Corninp; C
3.7
outside the passband had a transmission greater than 10-
5
of the peak signal transmission. This was extremely importantas the photomultiplier views the integrated energy through
the filters. Because the intensity of solar radiation is
increasing rapidly outside the signal passband, a small
trans-mission leak may pass a large total energy flux: and
consic!er-ably reduce the signal to noise ratio. ~'his problem is dis-cussed in more detail in Appendix B.
3.3 Logarithmic Amplifier
rrhe almost infinite input impedance of tbe lor::;ari thmic
amplifier, designed to match the almost infinite output
imped-ance of the photomultiplier, neceGsitatecl t:he use of a
con-stant current source to drive the amplifier for calibration
purposes. 'rhe constant current generator used in these
cali-brations provided a supply of current, in preset decade
steps, between 1 nano amp and 100 micro amps, to an accuracy
of better than three percent. ;.rhe';enerator itself was
calibrated ngainst a l'hiJ,.lips 1:;M2435 micro-voltmeter.
'Iihe resulting output for this range of input current is
plotted in the form of a calibration curve in .figure
C:'.4).
It can be seen from this fi~;ure that the res;-:onse is logar-ithmic to within one percent over the range25n
amps to7.5
t -Z W Q:: 0::
=>
u
l}'A (O·1na) l-=>
n...
z
3.3
i ~ I I-l
iJ
....,-1
-; !!
I
II ~ I -; --{ I - ; ... J l -i
j
IJ
I
I
10na~--~2--~~4----~6---8~--~10~---Output Vol ts
becoming non-lo:~ari thmic ::-~.t both the top and bottom end.s of the range shown.
Tille line through this line:3r portion was taken as the characteristic respons~ function for the amplifier. This assumed. charhcteristic response m,eans that all losari thmic ratios experimentally measured, are t) the base
5.5
and con-sequently need to be multiplied by the factor 0.7143 to con-vert them to standard base 10.All data recorded outside this linear re~ion was corrected for its deviation from the assumed lORarithmic
function. 1'he metrlOd, for applyin,,; this correction to the raw data is detailed i1'l ;3ection 4 of this chapter. In real
terms, this means a difference in intensity levels measured as 1.4 volts, when the individu.:.l.l intensity levels have been corrected" corres'conds to a f"ctor of 10 difference in light 18vels.
3.~ Spectral Sensitivity
It is particularly im:"lOrtfmt that 3. £pectrometer used
3.10
parameter. In bstimati.ng the dependence of measured intensity differences on instrument parameters, care !!lust be takan to i"wla te Flach par;-:.meter. i: or instance, increasi np; the photo-Tn'll tiplier supply vol bige rr,~.q cause some cb ansa in spectral sensi tivi ty. hut bGcausf~ of the associated increase in signal level t an observed chanfjO may he due to the latter effect. Therefore, care must be taken in such calihJ:'!:ltion procedures to change only one vilriablp. t a timA and observe the effect of such a change.
It was established not long after tl].e introduction of photOIllul tipliers tlFlt most ~Jhotomul tipliers res'pond differ-ently to different wavelenGths when the ap)lied voltage is changed; that iSt the spectt'8J. 88nsitivity is voltage depend-ent. A theoretical explanation of this ?~enomenon is th~"lt
chfin?:;int~; the dynode vol t::l',;el'3 produces a Chan!?;6 in the contour
pattern of the 'potential field within the photomultiplier. }juch ::t ch3..n;:;e means th;~.t the optimum tr~1.j ectori ~s of the e13ct;r.::m8 between the )hotocathooe and fi.rst ely ~lode and bet-ween the fir8t and second 'l~ode8 are cl1anged. Electrons
thf1t reach thA first liynone t:J.erefore orir;inp.te from a
Because the photosensitive coating on the photocathode is not absolutely uniform, the spectral response of tfie hihotocathode is not uniform, and thus a chan?~e in spectral sensitivity is observed with changing dynode volt~tges. Iro eliminate this effect, the trajectories of the photoelectrons from the photocathode and first dynode need to be fixed with respect to changes in applied volta~e. Dynodes two to eight do not enter into the spectral response cbanges since most of their ser.si t i ve surface is being bombarded anyway, owing to the increased numoer of photoelectrons and the distribution of their trajectories. This means the spectral response for the rest of the tube is 'flat I to changes in voltage. Iro fix the trajectoriest the potential differences acro[s the first two stages need to be fixed and this can be accomplish-ed by using zener diodes between the photocathode and the first dynode and between the first and second dynodes, rather than the standard bleeder chain ~esistors.
Changing the applied voltage across such a bleeder chain configuration changes only the potentials between dynodes two and eight and the trajectories of the photoelectr:Jns OVer the first two staf2~es are fixed. Consequently, the spectral res-ponse of the photomultiplier is not dependent on applied voltage changes.
practice in prBcision spectrophotometers and in recommended by some photomultir,lier manufn.cturflrs (E.rr.I., 1970).
Ghan~e3 in flpcct'Hl sRnflitivity could also be introduced through changing ah301ute .sii;nr;.1... lGvel~. ev'?rRJ. s<:lries of tp.sts werA pe:;:'formed in which the ef:""ect of chauc;ing the ap;;li8rl photor:,ul t i pli er 1J. T. for constn.nt si;';nal levels, and changing t;h"~ signp,l level '1t R ccnsi:;:71nt su;"ply voltage, for a range of photomnlti;llier nUr,lply voltages, was r(~corded. Of courRB, nIl these tests needed. to be performed with a source
source ill which the inte~r:::i tAd flux Q'J,tput in each waveleng·th in terval iA const nt '~li th tim;~. G1c 7--1rly the sun cannot
ea,<=;ily 'r:>e used as A. source of r:ldiation :ar theso tests since
the ctJangin~:; relative int'3nsi t~l levaL, in the 301ar radiation at the ground iG the very eff'3ct thn t the ~~t,')ctroD:1.otometer ."i 11 Tile:18Ure w"len cali b-;-:"lted. _i'or t hi oS re8.~')on t R ,1euterium
'j:his ;:,;ource -;:;as left running for twenty minutes to :~ar"r, :lP, (double the r:l'.1nUf'l~turers·
specif-the output :;:-eILainad con.st ~:nt t::-JIO';J.3hout tbe .3GI'ics of te::-ts,
dt d ;)hotoraul tl:ylL~-;:, suppl.; va 1 t:l ~e o~ (:~,y; volts, 'llld at a
3.13
However, to check that the measurements made in this
calibration procedure were Dot a function of the source used,
all the tests were repeated using a 100 watt quartz-iodine
lamp. The approximate spectral output from the deuterium source and the quartz-iodine lamp are shown in figure
(3.5).
i.s this figure shows, the spectral content of the 'luartz-iodine lamp is similar to that of the sun, shown in figure
(2.6), and very different from that of deuterium.
II'he difference in spectral composition of the deuterium
l3Jllp tha~'efore provides a check on the source dependence of the system. 'The greater luminosity of the quartz-icdine lamp in the ultraviolet enabled calibration at high signal levels, comparable with those measured in direct sunlight.
\:'/hen the apparent lu.minosi ty was reduced 1 a region of
overlap with the deuterium lamp was o[)tained allowi..ng the
source comparisons to be made. rerfect agreem.ent W':H~ found in the region of overlap showing the system was independent of
the source used. 'rhis test justifies the assumption that calibrations performed using tJle deuterium and quartz-iodine
lamps will be valid for data colJ.ected using the sun as a
source. Walshaw et
ale (1971),
discussing the results of apreviou3 absorption coefficient experiment (Dobson
1963),
alsoreport finding no difference in the relative reduction in
intensity of various wavelength bands when either skylight
or radiation from a tungsten ribbon lamp was passed through a
I
>-1
J - '- I
01
z
W
J-Z
o
w
...
<.
_ Io
<t
a=
3000
DEUTERIUM
3500
4000
QUARTZ - 1001 NE
LAMP
5000
7000
3.15
output from each lamp was kept constant throughout the meas-urin~ period.
However. apparent chans-';es in luminosity. observed by the filter system. were obtained by reducing the source output with c;,librated neutral density filters. Neutral density filters for the ultraviolet are more difficult to obtain, especially in New Zealand, than those for the visible region, since the normal silica glasl'l substrates are ul traviolet
absorbing.
The partial silvering of ouartz plates to make effective optically "greyll filters was considered, but very fine stain-less steel e:auze was finally used. lJ..'he particular gauze chosen, 100/100 mesh, is a square mesh with 152 micron ~ole size and 102 micron wire (42 gauge) which has a theoretical transmission of approxj .. mately 36 peDcent. The wavelength transmission characteristic of filters made by usin~ this gauze sheet were measured in a Csry 14 Recording ~pectro photometer. A single thickness of gauze was found to have a transmission of 32.0 percent. fhe transmission, as expected, proved to be the same for all wavelengths (that is, the
spectral response was 'flat').
,.16
in this orientation produced neutral density filters with a
density of 1.0, where density is defined as the logarithm, to the base 10, of the f:) ctor by which the inteDsi ty is reduced. Therefore, a reduction b;,' a factor of 10 in the transmi tted radiation means the filter must have a c;ensity of 1.0. When two of these filters were superimposed, Moir: fringes were
observed if the distance between the filters was less than
0.1 m. ~he nett transmission with a spacing of less than 0.1
m was found to be depenjent on the relative orientation of
the filters. However, with 8 spacing of 0.15 m, or greater,
one filter could >e rotated relative to the other, without
fringes being observed. or the nett transmission changing.
'l'his procedure was checked during the calibration tests and
no chanf;e in the absolute level waf. observed.
By using a stack of three filters with inter-filter
spacingsof 0.15 m, it wa~, possible to reduce the intensity of the source, as seen by the p:Cotomultirlier in the filter instrument, by a factor of 1000 since each neutral density filter was 10 percent transmitting. In this way, the radiant flux seen by the filter f:;ystem could be reduced by knovm
steps without fear of changing the spectral con.tent of the
source.
11.educing the arc current would o.lfjo reduce the radiated
source energy but would produce a change in the colour
temper-ature indicative of a change in spectral output. It was
3.17
It cen
tbere-ltiSll enc.rEeJ·, liLl:t leve::"F', tte rmoeie current became comparable
effecti ve dJrLode vol tc-ge on th.e 1 af:~t stHC€ ancy consequently d.roppeG_ the aEIJIL~·icLtic·n ()f' the photorillJ.l tiplier. AS a
rc,ul"t the tunr] ificc~ticn f ct.:.)r of the ptotOPil •. lt;iplier becaJIie
cr€D.sint; the bleeder CUlrer:.t b~T 9. f:;;.c-vcr of
15.
IJ~his changebl.eeder cur::.'(::nt ::l.ud '::;he [;;CJ,::-:irmL eX;'Gc-::;ed clUOe' e current,
U~cI:o:l1;:eren 19?O). 'Ii th ~;uch R r:-ltio, the 8B)lification
,.18
been collected. Thus all data collected before this bleeder
current fault was corrected, needed to be corrected for this
systematic error, introduced by the changing amplification
factor. 'ro calibrate the old system, with the corrected
system that gives a constant amplification even at high light
levels, the new set of dynode resistors was connected in the
chain so that it was possible to switch between the old and
the new bleeder currents.
~J.io obtain a calibration relationship, data was recorded at many different light levels. 3ince the spectral
sensitiv-ity did not change with changing H.T., or with changing
absolute light levels, data from each of the four
interfer-ence filters could be used in this calibration. At anyone
setting of
H.'r.,
and for BIly particular neutral densitycon-figuration, the old and new system could be compared at four
different light levels because of the intrinsic difference in
transmission of the interferonce filters, due to their
diff-erent bandwidths and transmission characteristics, and
because of the non-uniform spectral content of the source.
The results obtained from this procedure at
555
volts H.T.(after the logarithmic amplifier corrections to intensity had
been applied) are presented in figure
0.6}
The figuredemonstrates the ;,:,pectral insensi ti vi ty to change by the
way in which the data from each w':lvelength bana lie on the