Abstract—Gravity models have been widely applied to analyze the various cross border flows and economic activities between cities or countries. To estimate a gravity model, (parametric) linear regression techniques have been commonly employed to develop the relationship between passenger flows and factors that can significantly influence the flows. However, parametric regression models have their own model assumptions and pre-defined underlying relationship between dependent and independent variables. If these assumptions are violated, the model could lead to erroneous estimation of the flows between countries. Classification and Regression Tree (CART), one of widely applied data mining techniques, has been commonly applied in business administration, industry, and engineering. CART does not require any pre-defined underlying relationship between target (dependent) variable and predictors (independent variables) and have been shown to be powerful tools particularly in dealing with prediction and classification problems. This study collected data of 2006 and 2007 international air passenger flows between countries in the APEC region. A parametric linear regression and a non-parametric regression tree models were developed to establish the empirical relationship between air passenger flows and multiple factors, including distance, population, GPD, average income, unemployed rate, and many other economy-related variables. The estimation results from the linear regression model and the CART model are similar in general. Both models show that GDP, unemployment rate, import/export, distance and many other factors are the key determinants of international air passenger flows between two countries. By comparing the empirical findings between the linear regression and regression tree models, this study demonstrates that non-parametric regression tree models are good alternative methods for analyzing cross-country air passenger flows.
Index Terms—Airlines; Passenger flows; Gravity model;
Linear regression model; Classification and regression trees (CART)
Manuscript received December 8, 2009
Li-Yen Chang is with the Institute of Transportation and Logistics, National Chia-Yi University, Chia-Yi, 600, Taiwan, (phone:
886-5-2732933; fax: 886-5-2732932; e-mail: [email protected]) Da-Jie Lin is with the Department of Transportation Technology and Management, Feng-Chia University, Taichung, Taiwan, (phone: e-mail:
I. INTRODUCTION
Airlines, economists, and air transportation authorities have been serious to know the determinants of the demand of air transportation between two counties for many years. For the airlines, the ability to accurately predict the demand of air transportation between two counties and understand how each potential factor can influence this demand are critical to their profits. Gravity models have long been served as a framework for analyzing the bilateral flows, trade or many other activities (e.g., telephone traffic). This present study adopts the gravity model as the framework and employs two estimation techniques, parametric linear regression and non-parametric regression tree techniques, to explore the determinants of demand of cross-country air transportation.
In the field of transportation, gravity models have been used in the sequential transportation planning process describing trip distribution between zones. The gravity model hypothesizes that the trip interchange between two zones is directly proportional to the relative attraction of the zones and inversely proportional to some function of the spatial separation (e.g., distance or travel time) between the zones. The gravity model has also commonly applied to analyze the cross-border passenger or cargo flows between two cities and countries [1-3]. For example, Khadaroo and Seetanah [3] employed a gravity model framework to evaluate the importance of transport infrastructure in determining the tourism attractiveness of destination. In the filed of economic analysis, the gravity model has been used to analyze the international trade (e.g., import and export) or other economic activities (e.g., telephone traffic) between two counties [4].
To estimate a gravity model, parametric linear regression techniques have been the most commonly employed to explore the determinants and their extent that can influence the bilateral flows or activities. However, linear regression models have their own model assumptions and pre-defined underlying relationships between dependent and independent variables. If these assumptions are violated, the model could lead to erroneous estimation of the bilateral flows or activities. Classification and regression tree (CART), one of the most commonly applied data mining techniques, has been widely employed in business administration, agriculture, industry, and engineering. CART is a non-parametric model which does not require any pre-defined underlying relationship between the target (dependent) variable and predictors (independent variables);
Analysis of International Air Passenger Flows between Two Countries in the APEC Region Using Non-parametric Regression Tree Models
Li-Yen Chang* and Da-Jie Lin
and it has been shown to be a powerful tool, particularly for dealing with prediction and classification problems.
However, the applications of CART to analyze bilateral flow problems have been relatively few. Therefore, this study examines whether the CART model can be employed to analyze the determinants for the international air passenger flows between countries in the APEC (Asia-Pacific Economic Cooperation) region. The paper begins with a brief review of gravity models and their applications, followed by a description of the available data and an assessment of the model estimation results. The paper concludes with a summary and directions for future research.
II. THEGRAVITY MODEL
The gravity model originates from the Newtonian physics notion. Newton’s gravity law in mechanics states that two bodies attract each other proportionally to the product of each body’s mass (in kilograms) divided by the square of the distance between their respective centers of gravity (in meters). Latter, this law was transferred to analyze the spatial interactions (e.g., cross-border activities and bilateral trade) in the fields of transportation, economics and other social sciences. The gravity model, in one form or another, has been in existence for over decades. The general form of the gravity model for analyzing the cross-country passenger flows then can be expressed,
) (
ijj i
ij
f d
A
T = CP
(1)where
Tij represents the number of trips produced in country i (origin) and attracted to country j (destination),
C is a constant,
Pi is the production factors of country i, Aj is the attraction factors of country j, and dij is the distance between country i and country j.
To arrive at a statistically estimable probabilistic model, the linear (or nature logarithm) form of the gravity model equation has been commonly applied. The linear form of gravity then can be expressed as follows.
ε β
β β
β
+ + − += log( ) log( ) log( )
)
log(Tij 0 1 Pi 2 Aj 3 dij (2)
where ε is an error term and β’s are statistically estimable coefficients.
Simple gravity models considering only population and distance variables were adopted in the early studies of cross-border passenger flows. These were later modified by considering more variables that can produce or attract air passengers such as income, education level, the accumulation level of enterprises, and measures of city characteristics such as location advantages and climate. It should be noted that this present study focuses on the bilateral air passenger flows between two countries. The aggregate data at a national level will be used. The economic characteristic and cultural variables of a country are the good indication to describe how a country can produce or attract
international air passengers. Therefore, economic indexes describing a country economic force such as population, GDP (gross domestic product), import/export, national income per capita, economic growth rate, unemployment rate and other factors, are selected to describe the Pi and Aj in this study. The cultural variable is then described if the two counties have the same language.
III. THE DATA
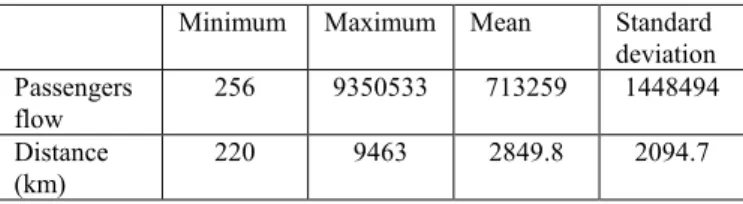
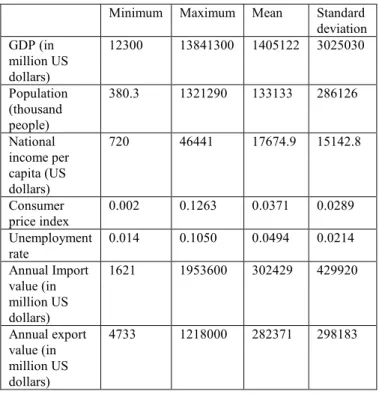
To investigate the effects of population and economical characteristics on international passenger flows traveling between countries, data from a number of resources were collected. The passenger flow data were taken from ICAOData.com which is maintained by the International Civil Aviation Organization (ICAO). The database contains detailed financial, traffic, personnel and fleet information for commercial air carriers as well as Traffic by Flight Stage (TFS) information and On-flight Origin/Destination statistics for air carriers. Information regarding the passenger flows occurred during 2006–2007 was extracted for this study. The information of economical characteristics of each country was taken from the annual report of the Taiwan External Trade Development Council. This report records detailed information of economical characteristics for each country in the world including population, GDP, national income, CPI (consumer price index), economic growth rate, unemployment rate, language and many other economic characteristics. Currently, APCE consists of 21 member economies. Because the passenger flow information of Papua New Guinea is not available in the ICAOData.com database, this analysis will focus on the rest of 20 counties in the region. It should be noted that each country is treated as an origin as well as a destination (i.e., each line produces two observations). A database of 383 observations was constructed for further analysis. Tables 1 and 2 provide summarized statistics of the passenger flows and economic indexes for the APEC member economies. For example, the average passenger flow during the 2-year period is 713,259.
The observed largest passenger flow is 9,350,533 which occurred from Hong-Kong to China in 2007. As for the economic indexes, the average GDP for the 20 APEC member economies during the 2-year period is 1,405,122 million US dollars. USA had the greatest GDP (roughly 13,841,300 million US dollars in 2007), while Brunei Darussalam had the lowest GDP (roughly 12,300 million US dollars in 2007). China had the largest population (over 1.3 billion in 2007), while Brunei Darussalam had the smallest population (about 380,300 in 2006).
Table 1 Descriptive statistics of passenger flows Minimum Maximum Mean Standard
deviation Passengers
flow
256 9350533 713259 1448494 Distance
(km)
220 9463 2849.8 2094.7
Table 2 Descriptive statistics of economic indexes Minimum Maximum Mean Standard
deviation GDP (in
million US dollars)
12300 13841300 1405122 3025030
Population (thousand people)
380.3 1321290 133133 286126
National income per capita (US dollars)
720 46441 17674.9 15142.8
Consumer price index
0.002 0.1263 0.0371 0.0289 Unemployment
rate
0.014 0.1050 0.0494 0.0214 Annual Import
value (in million US dollars)
1621 1953600 302429 429920
Annual export value (in million US dollars)
4733 1218000 282371 298183
IV. METHODOLOGY
There are two types of non-parametric tree-based methods, classification tree and regression tree, which have been widely employed in many scientific fields. When the value of the target variable is categorical, a classification tree is developed, whereas a regression tree is developed for the numerical target variable. The present study aims to explore the factors that can affect the bilateral passenger flows between two countries and the passenger flows are numerical.
Therefore, a regression tree is developed.
Regression tree adopts a repeated binary splitting procedure. The process starts from the root node, which contains all the objects in the data set. The root node is split into two nodes, called child nodes. Each split is made by a pre-defined rule which is generally to make the resulting child nodes as homogeneous as possible. The process is then repeated by treating each child node as a parent node. The splitting process is terminated when no further split can be made, i.e., all child nodes are homogenous (or by a user-defined rule). At the end of splitting process, a maximal tree is obtained. Theoretically, the maximal tree could have as many terminal nodes as there are observations. This maximal tree usually contains a great number of terminal nodes and results in poor classification and predictive abilities for new samples. Therefore, the optimal tree can be determined by a compromise between the tree size and the predictive properties. This can be done through “tree pruning”. At the end of tree pruning process, the series of sub-trees can be derived. An optimal-tree then can be selected when the misclassification costs reach a minimum for both the learning and testing data. An extensive review of regression tree and their applications can be found in Breiman et al. [5].
V. ANALYSIS RESULTS 5.1THE RESULTS OF LINEAR REGRESSION MODEL
As discussed in the previous section, parametric linear regression method is a natural choice for estimating the gravity model. The results of the linear regression estimation of the gravity model are presented in Table 3. The signs of all model coefficients are plausible and the model has a reasonable overall statistical fit as indicated by R2 statistic.
Ten variables are found statistically significant in determining passenger flows between two counties. As shown in Table 3, the negative sign of distance variable indicates that the longer distance between two countries the lower air passenger flows will be. As expected, when the distance between two counties increases, the travel time and travel costs will increase. Therefore, the desire of travel will also decrease. Language is another important element that can significantly influence people’s desire to travel cross the border. The estimated result shows that there are increased air passenger flows between two counties if they have the same language. No language barrier will make doing business and leisure traveling much easier. As expected, common language can increase the people’s desire to travel.
Table 3 Estimation results of linear regression model
Variable Estimated
coefficient
t-statistics
Constant -15.36 -8.25
Distance -0.96 -9.27
Language indicator (1 if two countries have same language; 0 otherwise)
0.50 2.38
Characteristics of Origin country
GDP 0.29 3.52
National income per capita
0.18 3.54
Unemployment rate
-0.84 -3.19 Annual Export value
0.24 2.37
Characteristics of Destination country
GDP 0.25 3.08
Consumer price index -0.15 -2.18
Unemployment rate -0.73 -4.38
Annual Import value 0.27 3.06
Number of observations 383
R2 0.48
Adjusted R2 0.46
A number of economic variables including GPD, national income (per capita), consumer price index, unemployment rate and annual import/export were identified to have significantly influences the passenger flows traveling between countries. The positive signs of the GDP variables for both origin and destination countries indicate that the increase in GDP will also increase passenger flows. GDP is a basic measure of a country overall economic performance.
As expected, when the GDP of a country increases, the economic activities as well as the demand of travel will increase. In addition, the national income (per capita) variable has positive effect on cross-country air passenger flows for the origin country. As expected, higher income often allow people to make cross-country travel easier for a variety of purposes such as tourism and doing business. The export value of the origin country and import value of destination country are also found to have positive effects on the cross-country air passenger flows. Higher import and export values indicate the economic activities between two counties prosper and the demand of air travel will increase.
Unemployment rate, on the other hand, has negative impacts on air passenger flows for both origin and destination countries. High unemployment rate indicates that the poor economic situation of a country, and also implies more people are looking for a job. Without a secure income, people will be more cautious on their spending and the demand of travel to other counties by air is expected to reduce. In addition, CPI variable also has a negative impact on air passenger flows for the destination country. High CPI represents relatively high prices for most of the merchandises at the destination country which is difficult to attract more tourists to the county. As a result, the demand of travel between two counties will reduce if the destination countries have a high CPI. Overall, the findings by the linear regression analysis are consistent with general observations and past findings.
5.2THE RESULTS OF REGRESSION TREE
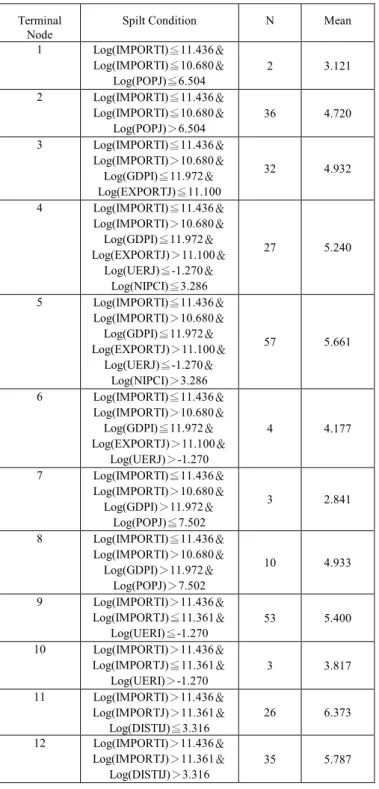
Sixteen predictor variables were used with the numerical target variable of logarithm of passenger flows in attempt to identify the important patterns that air transportation authorities and airlines wish to understand. Table 4 gives the definition of the predictor variables. The least square deviation splitting criterion, the CART’s default, is used in this study. Table 5 gives the splitting rules reproduced by the regression tree model. The tree has twelve terminal nodes and can be easily distinguished that import/export, GDP, unemployment rate national income and distance are the primary splitters in the regression tree. This implies these variables are critical in determining air passenger flow between counties. The interpretation of results is straightforward. The initial split in node 1 is based on the export value of 92,596 million US dollars (i.e., log(IMPORTi)=11.436) of the origin country. When the export value of origin country of is less than or equal to 92,596 million US dollars, CART sends the passenger flows to the left forming node 2; and directs the rest of passenger flows to the right, forming node 9. This indicates that the single best variable to classify air passenger flow between
counties is the import value of the original country.
Table 4 Description of variables
Variable Symbol Type Description
Passenger flow PAXS Continuous The target variable
GDP GDP Continuous in million US
dollars Population POP Continuous
Language LANG Qualitative 1: both countries have the same language; 0 otherwise National
income (per capita)
NIPC Continuous in US dollars
Consumer price index
CPI Continuous in percent Unemployment
rate
UER Continuous in percent Annual Import
value
IMPORT Continuous in million US dollars Annual export
value
EXPORT Continuous in million US dollars Distance DIST Continuous The distance
between two counties, in kilometers Conditioned on the import value of origin country less than or equal to 92,596 million US dollars, CART further splits node 2 based on the variable of import value of origin country. When the import value of origin county is less than or equal to 43,478 million US dollars (i.e., log(IMPORTi)=10.680), CART directs the passenger flows to the right, forming node 3; and directs the rest of passenger flows to the left, forming node 4. CART further splits node 3 based on the variable of population of destination country.
When the population of destination county is less than 667,800 (i.e., log(POPj)=6.504), CART directs the passenger flows to the right, forming terminal node 1; and directs the rest of passenger flows to the left, forming terminal node 2. As indicated by terminal node 1, when the import value of origin country of is less than or equal to 43,478 million US dollars and the population of destination county is less than or equal to 667,800, the tree predicts that the average passenger flow is 22,669 (i.e., log (PAX)=3.121).
In terminal node 2, the tree predicts that the average passenger flow is 112,168 (i.e., log (PAX)=4.720) when import value of origin country of is between 43,478 and 92,596 million US dollars and the population of destination county is greater than 667,800. With this splitting rule, the prediction of passenger flows can be obtained by continuing down the tree branches until a terminal node is reached. It is interesting to note that the language variable found significantly in determining cross-country air passenger flows in parametric linear regression model is not identified to be important in splitting the nodes in regression tree analysis.
Table 5 Description of splitting rules of regression tree Terminal
Node
Spilt Condition N Mean
1 Log(IMPORTI)≦11.436&
Log(IMPORTI)≦10.680&
Log(POPJ)≦6.504
2 3.121
2 Log(IMPORTI)≦11.436&
Log(IMPORTI)≦10.680&
Log(POPJ)>6.504
36 4.720
3 Log(IMPORTI)≦11.436&
Log(IMPORTI)>10.680&
Log(GDPI)≦11.972&
Log(EXPORTJ)≦11.100
32 4.932
4 Log(IMPORTI)≦11.436&
Log(IMPORTI)>10.680&
Log(GDPI)≦11.972&
Log(EXPORTJ)>11.100&
Log(UERJ)≦-1.270&
Log(NIPCI)≦3.286
27 5.240
5 Log(IMPORTI)≦11.436&
Log(IMPORTI)>10.680&
Log(GDPI)≦11.972&
Log(EXPORTJ)>11.100&
Log(UERJ)≦-1.270&
Log(NIPCI)>3.286
57 5.661
6 Log(IMPORTI)≦11.436&
Log(IMPORTI)>10.680&
Log(GDPI)≦11.972&
Log(EXPORTJ)>11.100&
Log(UERJ)>-1.270
4 4.177
7 Log(IMPORTI)≦11.436&
Log(IMPORTI)>10.680&
Log(GDPI)>11.972&
Log(POPJ)≦7.502
3 2.841
8 Log(IMPORTI)≦11.436&
Log(IMPORTI)>10.680&
Log(GDPI)>11.972&
Log(POPJ)>7.502
10 4.933
9 Log(IMPORTI)>11.436&
Log(IMPORTJ)≦11.361&
Log(UERI)≦-1.270
53 5.400
10 Log(IMPORTI)>11.436&
Log(IMPORTJ)≦11.361& Log(UERI)>-1.270
3 3.817
11 Log(IMPORTI)>11.436&
Log(IMPORTJ)>11.361&
Log(DISTIJ)≦3.316
26 6.373
12 Log(IMPORTI)>11.436&
Log(IMPORTJ)>11.361&
Log(DISTIJ)>3.316
35 5.787
VI. COMPARISONS AND DISCUSSION
In this analysis, economic characteristic variables along with distance were selected to estimate a gravity model to predict the bilateral passenger flows between two countries in the APEC region. Although many factors that can significantly affect the passenger flows between two countries were identified, there are two limitations worth noting. The first limitation is that the effect of hub on attracting passengers is not specifically accounted for. Hong Kong and Singapore are two small countries but the major air transportation hub in the region. For example, Hong Kong serves as the most import hub for the passengers traveling between Taiwan and China. The second limitation is the effect of fare is missing in the model. Travel costs and time (accounted by distance in this study) are two major factors
that affect the passenger’s willingness to travel. Because the fare structure is very complicated for the air passenger transportation, this study was unable to collect the reliable fare data and incorporated them in the model. Future applications using the results derived by this study deserve more attention.
As for the comparisons between these estimation techniques, although the linear regression approach identified more factors that can affect the bilateral passenger flows between countries than the regression tree. In general, the effects of factors found by these two approaches are consistent. As for the future application of CRAT techniques to analyze other transportation problems, there are some aspects that might be of great interest. For one, CART analysis provides some advantages relative to regression models (or other parametric models). From the theoretical perspective, the primary advantage of the CART analysis is that it does not need to specify a functional form. In the parametric linear regression analysis, if the model is mis-specified, the estimated relationship between dependent variable and independent variables as well as model predictions will be erroneous. Another advantage is that CART analysis can effectively handle multi-collinearity problems because it handles them automatically within the tree construction process. In this application, economic characteristic variables likely have a serious correlation among them (e.g., GDP, import/export, and population).
When the regression analysis is applied and serious correlations between independent variables exist, not only will the variability of estimated coefficients be inflated, but also the interpretation of relationship between independent variables and dependent variable will become difficult. In addition, outliers always present a serious problem for regression analysis and other parametric models, because they can adversely affect the coefficient estimates. In the CART model, outliers are isolated into a node and result in no effect on splitting (and might eventually be pruned away).
From a practical perspective, the first advantage of the CART model is the graphic display of the analysis results.
This will make the results more easily understood across disciplines, and also by non-statisticians. The regression tree is structured as a sequence of “if-then” questions which can be further incorporated into an expert system. By answering these questions and tracing a path down the tree to a terminal node, the average passenger flows can be easily predicted.
Interactions between independent variables can also be easily handled by the regression tree model. To account for synergistic effects by two or more independent variables, the functional form of interaction needs to be specified first and then tested one by one during the model building process for estimating a linear regression model. This is not necessary in estimating a regression tree model, because interactions are handled automatically. In addition, CART effectively deals with large data sets containing a large number of explanatory variables and can produce useful results by using only a few important variables. For situations where there are many possible explanatory variables including all possible interactions, variable selection for the regression analysis would be an issue. Although automated selection methods such as “best” subsets algorithms and stepwise selection techniques are available, they lead to the identification of one particular subset of variables. Another advantage of CART model is that CART can automatically search the best
cut-point to split the nodes. Compared to the regression analysis, if an indicator variable is applied instead of continuous variable, the cut-point value of the indicator variable is generally determined through experimentation or based on the findings of past studies. Therefore, past studies suggested that CART model could be used as a precursor to a parametric model (Kuhnert et al., 2000).
Despite the above advantages, the CART model also has its disadvantages. Firstly, CART analysis does not provide a probability level or confidence interval for the explanatory variables (splitters) and predictions. The lack of formal statistical inference procedures is a critical problem when the CART model is applied to analyze a new data set. In addition, the CART method has difficulty in conducting elasticity analysis or sensitivity analysis. Elasticity analysis (or sensitivity analysis) allows examining the marginal effects of the variables on passenger flows and provides valuable information for airlines and administration authorities to promote their operation efficiency.
VII. CONCLUSION AND RECOMMENDATIONS Linear regression and non-parametric regression tree methods were proposed to establish the empirical relationship between bilateral air passenger flows between countries and economic characteristics and distances. The results obtained here, by exploring a broad range of variables, provide valuable insight into the underlying relationship between economic factors and international air passenger flows. The results of this study can eventually be employed to predict demand for the airlines, particularly for planning to operate a new line. In addition, this study demonstrates that non-parametric regression tree modeling technique is a good alternative for estimating a gravity model by comparing the analysis results from the linear regression model. This represents an important methodological step. In terms of future work, studies should explore more variables that can influence the air passenger flows. As discussed in the previous section, the effect of hub, fare and many other factors such as climate are the potential factors that can determine air passenger flows between two counties. Further exploration by more variables might be able to identify more critical factors that can affect international air passenger flows. In addition, an application of the methodological approach used in this study to analyze other transportation problems, such as trip generation, energy use, population growth and traffic safety (e.g., accident rate prediction) would be interesting. It would also be interesting to employ different non-parametric techniques such as artificial neural network or association rules to explore the determinants that affect bilateral air passenger flows and to see if more potential determinants can be uncovered and the prediction results can be improved.
REFERENCES
[1] Wei, W., Hansen, M., 2006. An aggregate demand for air passenger traffic in the hub-and-spoke network. Transportation Research A 40, 841-851.
[2] Endo, N., 2007. International trade in air transport services:
penetration of foreign airlines into Japan under the bilateral aviation policies of the US and Japan. Journal of Air Transport Management 13, 285-292.
[3] Khadaroo, J. Seetanah, K. 2008. The role of transport infrastructure in potential tourism development: a gravity model approach.
Tourism Management 29, 831-840.
[4] Karemera, D. et al 1999. ‘A gravity model analysis of the benefits of economic integration in the Pacific Rim’, Journal of Economic Integration 14(3), 347-367.
[5] Breiman, L., Friedman, J. H., Olshen, R. A., Stone, C. J., 1998.
Classification and regression trees. Chapman & Hall/CRC.