Review Article
Hydrologic Impacts of Climate Change: Quantification of Uncertainties
R CHANDRA RUPA1 and P P MUJUMDAR1,2,3
1Department of Civil Engineering, Indian Institute of Science, Bangalore, Karnataka 560 012, India
2Interdisciplinary Centre for Water Research (ICWaR), Indian Institute of Science, Bangalore, India
3Divecha Center for Climate Change, Indian Institute of Science, Bangalore, India
(Received on 28 May 2018; Revised on 30 August 2018; Accepted on 13 September 2018)
The three visible signals of climate change, viz., increase in global average temperature, change in precipitation patterns and rise in sea levels, are known to cause a significant impact on regional hydrology, at different spatial and time scales. Processes such as stream flow and evapotranspiration, magnitudes and frequencies of hydrologic extremes of floods and droughts are likely to be affected by climate change. A commonly adopted procedure for assessing the climate change impact on hydrology is to use the projections provided by the global scale General Circulation Models (GCMs) and downscale the hydrometeorological variables to regional scales, and consequently execute the distributed hydrologic models to obtain hydrologic projections. Significant uncertainties are imparted due to the use of several models at different spatial and time scales. Quantification of such uncertainties at all levels – from the choice of climate models and emission scenarios to downscaling and hydrologic models – is a current area of research. This paper summarises the recent work carried out by the second author’s team on quantification and reduction of uncertainties in assessing hydrologic impacts of climate change. Both aleatory (irreducible) uncertainties that arise from the inherent uncertainties due to randomness, and the epistemic (reducible) uncertainties that are characterised by lack of knowledge are addressed. Applications to impact on streamflow, evapotranspiration, pluvial and fluvial floods and droughts are discussed. A brief discussion on the changing frequencies of concurrent extremes of droughts and heatwaves in India is also provided.
Keywords: Climate Change; Uncertainty; Quantification; Risk Assessment; Detection and Attribution; Concurrent Extremes
*Author for Correspondence: E-mail: pradeep@iisc.ac.in
Proc Indian Natn Sci Acad85 No. 1 March 2019 pp. 77-94
Printed in India. DOI: 10.16943/ptinsa/2018/49506
Introduction
Adequate scientific evidence exists confirming that the global climate is changing, with prominent signals of climate change such as increase in global average temperature, change in regional circulation patterns that affect precipitation, and rise in sea levels. The impacts of climate change and climate variability will be felt mainly through water related issues, such as water scarcity, increase in demands and increase in frequencies of floods and droughts (Mujumdar, 2013). According to Inter-governmental Panel on Climate Change (IPCC, 2007), climate variability refers to “variations in the mean state and other statistics (such as standard deviations, the occurrence of extremes, etc.) of the climate on all temporal and spatial scales”, whereas climate change refers to “any change in climate over time, whether due to natural variability
or as a result of human activity”. The signals of climate change convert into signals of regional scale hydrologic change in terms of modifications in water availability, frequent hydrologic extremes like floods and droughts, changes in water quality, changes in agricultural water demand, and other related phenomena. For example, increase in atmospheric temperature is likely to have a direct impact on the run-off in snow-fed rivers and on the evaporative demands of crops. In India, there is an evidence of climate change with increase in temperature (Kothawale and Rupa Kumar, 2005), changes in the extreme precipitation (Rajeevan et al., 2008) and changes in sea levels over the Indian coast (Church
et al., 2006; Unnikrishnan et al., 2006; Unnikrishnan
India has shown an increasing trend over the past century and follows the global warming trend (Basha
et al., 2017). Also, the magnitude and frequency of
extreme precipitation have been changing over India (Goswami et al. 2006; Ghosh et al., 2016). There is a need for research to understand how the hydrological projections and their variations can be effectively presented to hydrologists and how they can be used in combination with hydrological models to provide indications of future water management. Such projections can be obtained from the General Circulation Models (GCMs), which are important tools in the assessment of climate change (Fowler, et al., 2007). The high resolution GCMs are excellent simulators of the large-scale circulation patterns, but unfortunately, hydrologic variables such as precipitation, run-off and evapotranspiration cannot be well modelled by GCMs. Also, the spatial scale on which a GCM operates is coarse compared to that of hydrological process. Therefore, downscaling is required to obtain the hydrological variables at a smaller scale based on the large scale GCM simulations. The quality of projections will, in general, depend on the quality of downscaling model and/or method and the historical data used for building the model.
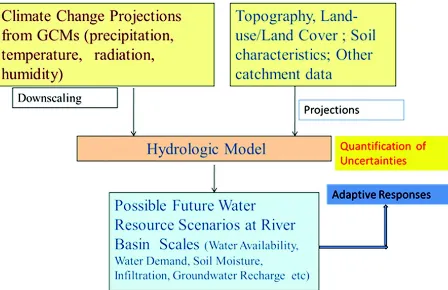
On the other hand, projecting climate impact on hydrological processes is often burdened with considerable uncertainties (e.g., from climate models, greenhouse gas emission scenarios, downscaling techniques/models, bias correction methods, hydrological models and their parameterization, and quality and quantity of historical data available), which could inevitably propagate through the entire modelling process (Refsgaard et al., 2010). These uncertainties can propagate across time and space in a very complex way, which could lead to disingenuous policy decisions. An increasing interest in modelling the hydrologic variables therefore is to quantify the contribution from different sources of uncertainty and reduce them where possible (Poulin et al. 2011; Teutschbein and Seibert 2012). Fig. 1 shows a common procedure adopted for projecting climate change impact on hydrology. The downscaled climate change projections and the projections of hydrological data (landuse/ landcover, soil etc.) are used in a hydrological model to obtain the future possible scenarios of water resources, which are used in obtaining the adaptive responses of the basin. Underlying uncertainties are inherent at each stage of the modelling. Uncertainties
in regional climate responses are assessed by Betts
et al. (2018), examining the ranges of outcomes in
the impact to inform risk assessments. They reported that the projections for weather extremes indices and biophysical impacts quantities support that the magnitude of temperature changeis in general large for 2°C global warming than 1.5°C. They concluded that the hot extremes become even hotter, with the increase being more intense than seen in CMIP5 (Coupled Model Inter-comparison Project Phase 5) projections and precipitation-related extremes show high geographical variation with some increases and some decreases in both extremes (floods and droughts). Therefore, it is important to understand the climate change impacts on hydrological variables (like precipitation, stream flow), and assess the uncertainties arising due to various factors. In India, climate change impact assessment on hydrology (Gosain et al., 2006) and quantification of uncertainties at each stage of the modelling, using variety of methods (Ghosh and Mujumdar, 2009; Ghosh et al., 2010; Ghosh and Katkar, 2012; Sengupta and Rajeevan, 2013; Kannan et al., 2014) have been carried out. Several novel methods have been developed, including from the second author, for quantifying the uncertainties and assessing the climate change. All such works from the author are summarized and conclusions drawn from the developed approaches for a better management of water resources are consolidated.
Climate Change Impact Assessment
[image:2.612.322.546.580.725.2]GCMs suggest that increase in greenhouse gases will have considerable implications on global and regional climate (Wilby et al., 2002). Global climate change influences regional hydrology, through changes in
intensities and frequencies of precipitation, stream flow and other hydrologic variables (Mujumdar and Ghosh, 2007). Therefore, it is important to assess the possible impact on water resources for future with several plausible climate change scenarios. This involves obtaining projections of hydrologic variables and computation of hydrologic risk for the use in water resources planning and management.
Though GCMs are currently the most credible tools available for simulating the response of the global climate system to increasing greenhouse gas concentrations, unfortunately, GCMs are restricted in their usefulness for local impact studies by their coarse spatial resolution (typically of the order 50,000 km2) and the inability to resolve important sub-grid scale features such as clouds and topography. This inability has led to the development of down-scaling and disaggregation methods.
Down-scaling is a method to predict the hydrologic variables at a local scale based on large scale climatological variables simulated by a GCM. The downscaling methods are broadly classified into dynamic downscaling and statistical downscaling. Dynamic downscaling develops Limited Area Models (LAMs)/Regional Climate Models (RCMs) in which a fine computational grid over a limited domain is nested within the coarse grid of a GCM (Jones et al., 1995). The statistical downscaling methodologies can be broadly classified into weather generators, weather typing, and transfer functions. Weather generators are statistical models of observed sequences of weather variables. Weather-typing approaches involve grouping of local, meteorological variables in relation to different classes of atmospheric circulation. Transfer function is a regression based downscaling method that relies on direct quantitative relationship between the predict and predictors through some form of regression.
Alinear regression model developed by Ghosh and Mujumdar (2006), for estimation of rainfall using GCM outputs of mean sea-level pressure and geopotential height as explanatory variables/ regressors, is one of the first studies on statistical down-scaling in India. A blend of novel down-scaling methods considering different statistical downscaling approaches along with fuzzy clustering and machine learning techniques were developed by Ghosh and Mujumdar (2006, 2008) and Raje and Mujumdar
(2009). The methodology developed for downscaling is based on linear regression and fuzzy clustering and therefore is a combination of weather typing and transfer function. The study observed that a heuristic classification of GCM outputs based on fuzzy clustering, prior to regression, improves the model performance. A novel statistical downscaling approach is developed by Ghosh and Mujumdar (2008) using fuzzy clustering and Relevance Vector Machine (RVM) to predict stream flow at Hirakud reservoir, Mahanadi basin, from GCM output of MSLP (Mean Sea Level Pressure), surface air temperature at 2m, specific humidity, and geopotential height at 500 hPa. Mujumdar and Ghosh (2008) introduced possibility theory for modelling uncertainty due to the use of multiple GCMs and Scenarios. A new downscaling method using the Conditional Random Field (CRF) downscaling method, is developed by Raje and Mujumdar (2009), where the conditional distribution of the daily precipitation sequence at a site, given the sequence of daily atmospheric predictors, is represented as alinear-chain conditional random field.
variable at every year. Probabilities for different categories of future drought are computed from the estimated pdf (Fig. 2). An increasing trend of the probability of extreme drought and a decreasing trend of the probability of near normal condition is observed in Orissa meteorological sub-division.
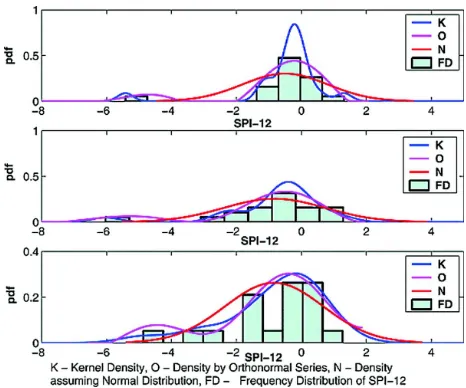
[image:4.612.64.297.81.275.2]Simulations for all scenarios are not available for all the GCMs, leading to different distribution functions. Also, the set of all scenarios may not fully compose the universal sample space, and therefore, the precise single valued probability distribution may not be representative enough for applications. An imprecise probability model is developed by Ghosh and Mujumdar (2009) to model GCM and scenario uncertainty along with the uncertainty due to partial ignorance resulting from limited scenarios and/or limited climate experiments. Leastsqu are interval regression with the objective of minimization of grey degree of the imprecise CDFs (Cumulative Distribution Functions) is performed to fit an imprecise normal distribution to the sample of SPI-12, considering both mean and standard deviation as interval grey numbers. A possibilistic approach is developed for modeling GCM and scenario uncertainty in the projections of monsoon stream flow of Mahanadi river. Based on system performance measure in predicting the stream flow during years 1991-2005, possibilities are assigned to GCMs and scenarios. The possibilities are used as weights for deriving the possibilistic mean CDF for the three standard time slices, 2020s, 2050s and 2080s.
Fig. 3A presents the upper and lower bounds, possibilistic mean CDF and the most possible CDF for years 1991-2005, 2020s, 2050s and 2080s. It can be concluded from the figure that the probability of occurrence of extreme high flow events in future is reduced as the value of stream flow at which the possibilistic mean CDF reaches the value of 1 for years 2020s, 2050s and2080s are lower than that of the baseline period 1961-1990 and therefore there is likely to be a decreasing trend in the monthly peak flow. Also, the effects of the possible changes in predictor variables (MSLP, geopotential height at 500hPa, surface specific humidity and surface temperature) on the stream flow are analysed individually. Fig 3B shows the effect of predictor variables on streamflow and the variation of predictor variables over time, which indicates the importance of the choice of predictor variables in downscaling.
Using the Dempster-Shafer (D-S) evidence theory, a new uncertainty modeling frame work combining GCM, scenario and downscaling uncertainty is developed by Raje and Mujumdar (2009). The developed framework is applied for future projections of hydrologic drought from streamflow projections in the Mahanadi river at Hirakud, considering three GCMs for three scenarios each. The results from this work indicate that there is an increase in probability of extreme, severe and moderate drought and decrease in probability of normal to wet conditions due to a decrease in monsoon streamflow in the Mahanadi river (Fig. 4). In most studies the nature of the downscaling relationship (DSR) used for predictions is assumed to remain unchanged for future. However, variation in climate change frequencies of occurrence of the leading modes of variability, and hence, stationarity of DSRs is not a valid assumption in climate impact assessment. Raje and Mujumdar (2010a) presented an uncertainty modelling framework, considering GCM uncertainty, scenario uncertainty and uncertainty in the nature of the DSR, linking downscaling with changes in frequencies of such modes of natural variability. A trained CRF model on each natural cluster are combined using the weighted D-S theory to obtain the future projections of the regional hydrologic variable. The spatial patterns of the clusters, which are identified using k-means clustering, show that the Indian Ocean appears to have a large impact on climate variability. Fig. 5A shows the spatial patterns
Fig. 3A: Upper bound, lower bound and possibilistic mean Cumulative Distribution Function (Source: Mujumdar and Ghosh, 2008)
[image:5.612.91.529.425.723.2]of 500 hPa geopotential height anomaly for the considered clusters identified as modes of natural variability. Such variations are important to consider in the downscaling relationship. The methodology developed by Raje and Mujumdar (2010a) incorporates non-stationarity in DSR and is used to understand the changing probability of extreme, severe, and moderate droughts due to climate change at Hirakud Reservoir in Orissa, India. Fig. 5B shows the range of CDFs for projected stream flow classifications, for current (1960-2000) and future (2045-2065) time periods. The unclustered training in Fig. 5C shows the projection uncertainty reflected in the spread due to GCM, scenario, and downscaling uncertainty, and the Fig. 5D shows the uncertainty for all cluster, scenario, and GCM combinations. The uncertainty is increased due to non-stationarity in the downscaling relationship captured in the uncertainty envelope.
In addition to the D-S theory, a Bayesian approach is also presented by Raje and Mujumdar (2010b) for the case study of Hirakud Reservoir, which models the uncertainty in projected frequencies of SSFI-4 (Standardized StreamFlowIndex) classifications by deriving a posterior distribution for the frequency of each classification, using an ensemble
of GCMs and scenarios. Results from the D-S and Bayesian approaches show an increasing probability of extreme, severe and moderate droughts and decreasing probability of normal and wet conditions in the case study because of climate change. Relative merits of each approach are discussed further. Fig. 6 shows the comparison of both the approaches used in predicting SSFI-4.
[image:6.612.72.544.84.335.2]Different hydrological models are considered for understanding the impact of climate change on the major river basins and/or reservoirs in India. Linear regression based Statistical DownScaling Model (SDSM) is used by Meenu et al. (2012) to downscale the daily maximum and minimum temperature, and daily precipitation in the four sub-basins of the Tunga-Bhadra River. Results of the water balance study suggest increasing precipitation and runoff and decreasing actual evapotranspiration losses over the sub-basins in the study area. The impact of climate change on Hirakud multipurpose reservoir performance is quantified by Raje and Mujumdar (2010c), using annual hydropower and RRV (Reliability-Resiliency-Vulnerability) criteria, under GCM and scenario uncertainty. Adaptive Stochastic Dynamic Programming (SDP) policies are subsequently derived for a range of future hydrologic
scenarios, with the objective of maximizing reliabilities with respect to multiple reservoir purposes of hydropower, irrigation and flood control. It is shown that the hydrologic impact of climate change is likely to result in the decrease in performance criteria and annual hydropower generation for Hirakud reservoir.
The semi-distributed Variable Infiltration Capacity (VIC) model is set-up over the Upper Ganga Basin (UGB) by Chawla and Mujumdar (2018) to segregate the contribution from GCMs, emission scenarios, land use scenarios, stationarity assumption of the hydrologic model, and internal variability of the processes. Fig. 7 shows the UGB along with the different factors to uncertainty of annual streamflow projections (i.e., change in mean, 5th quantile, 50th quantile and 95th quantile) for upstream, midstream and downstream regions of the UGB under both stationary and non-stationary model conditions.
[image:7.612.63.301.78.360.2]In addition to the climate change, other impacts like land use/land cover changes do affect the streamflow and isolating such impacts due to different causes is important towards water resources planning and management. Chawla and Mujumdar (2015) used
[image:7.612.71.539.401.684.2]Fig. 5A: Spatial patterns of 500 hPa geopotential height anomaly for the five clusters identified as modes of natural variability. (Source: Raje and Mujumdar, 2010a)
Fig. 5B: Range of monsoon four monthly standardized streamflow index (SSFI-4) classifications for current and future years (a) across three GCMs for years 1960-2000, (b) across three GCMs and five clusters for years 1960-2000, (c) across three GCMs and three scenarios (unclustered) for years2045-2065 and (d) across three GCMs, three scenarios, and five clusters for years 2045-2065. (Source: Raje and Mujumdar, 2010a)
Ext drought Sev drought Mod drought Normal Mod wet Very Wet Ext et SSFI-4 Classification
0 0.2 0.4 0.6 0.8 1
(A) Predicted SSFI-4 classifications for years 1960-2000 (across 3 CCMs) (B) Predicted SSFI-4 classifications for years 1960-2000 (across 3 CCMs, 5 clusbers)
0 0.2 0.4 0.6 0.8 1
Ext drought Sev drought Mod drought Normal Mod wet Very Wet Ext et SSFI-4 Classification
P
ro
b
a
b
il
it
y
P
ro
b
a
b
ili
ty
Ext drought Sev drought Mod drought Normal Mod wet Very Wet Ext et Ext drought Sev drought Mod drought Normal Mod wet Very Wet Ext et
SSFI-4 Classification SSFI-4 Classification
0 0
0.2 0.2
0.4 0.4
0.6 0.6
0.8 0.8
1 1
(D)
P
ro
b
a
b
il
ity
P
ro
b
a
b
ili
ty
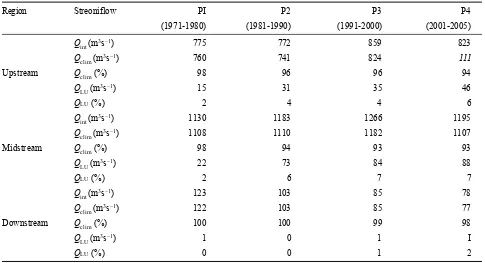
a hydrologicmodeling-based approach (VIC model) to segregate the impacts of land use and climate change on the streamflow of Upper Ganga Basin (UGB) in India. They concluded that the combined effect of land use and climate on streamflow is observed to be more distinct compared to their individual impacts, and the isolated effects of climate has a more dominant impact on streamflow, when compared to the land use. Table 1 gives the results corresponding to the streamflow simulations under simultaneous change in LU (Land Use) and climate conditions (Qint), and for individual impacts for
upstream, midstream and downstream regions of UGB.
Detection and Attribution
[image:8.612.67.289.83.228.2]In the varying climates, it is important to understand how the climatic variables and associated natural resources and anthropogenic systems are being affected by external forcings and understand if such effects have gone past the influence of natural internal variability of the climate. Detection and attribution (D&A) studies provide a formal tool to interpret the complex causes of climate change. The Intergovernmental Panel on Climate Change’s (IPCC, 2010) defines the detection of climate change as “the process of demonstrating that climate or a system affected by climate has changed in some defined statistical sense, without providing a reason for that change” and attribution as “the process of evaluating the relative contribution of multiple causal factors to a change or event with anassignment of statistical confidence”. Detection and attribution of climatologicalor meteorological variables at the regional-scale are more difficult compared to the global or continental D&A analysis as the detection of anthropogenic signal in natural internal climate variability noise is determined by the signal-to-noise ratio which is proportional to the spatialscale of
Fig. 6: Comparison of results from the Dempster-Shafer and Bayesian approaches for the uncertainty modeling of SSFI-4 classifications (Source: Raje and Mujumdar, 2010b)
Table 1: Contribution of climate and LU to the streamflow for different time periods (Source: Chawla and Mujumdar, 2015)
Region Streoniflow PI P2 P3 P4
(1971-1980) (1981-1990) (1991-2000) (2001-2005)
Qint (m3s–1) 775 772 859 823
Qclim (m3s–1) 760 741 824 111
Upstream Qclim (%) 98 96 96 94
QLU (m3s–1) 15 31 35 46
QLU(%) 2 4 4 6
Qint (m3s–1) 1130 1183 1266 1195
Qclim (m3s–1) 1108 1110 1182 1107
Midstream Qclim (%) 98 94 93 93
QLU (m3s–1) 22 73 84 88
QLU(%) 2 6 7 7
Qint (m3s–1) 123 103 85 78
Qclim (m3s–1) 122 103 85 77
Downstream Qclim (%) 100 100 99 98
QLU (m3s–1) 1 0 1 I
[image:8.612.64.549.478.741.2]analysis. A formal D&A analysis is performed by Mondal and Mujumdar (2012) to examine whether the observed trends in the precipitation and the stream flow of Mahanadi basin lie significantly outside the range that is expected from natural internal variability of climate alone and whether a signal of anthropogenic emissions is apparent in them. They studied the time evolution of signal-to-noise ratio and attempted to
detect and attribute anthropogenic climate change accounting for the variability across the different CMIP3 climate models (Fig. 8).
The fingerprint approach, which defines the direction in which the human-induced signal is expected toile (Santer et al., 1995), reduces the detection problem to a low-dimensional problem in
Fig. 7: (A) Location of Upper Ganga Basin (UGB) within Ganges Basin in India; (B) Details of the UGB (C) Contribution of different factors to uncertainty of annual streamflow projections (change in mean, 5th quantile, 50th quantile and 95th quantile) for Upstream (left), Midstream (middle) and Downstream (right) regions of the UGB under both stationary and non-stationary model conditions (Source: Chawla and Mujumdar, 2018)
20
0 40 60 80 100 (A)
GCMs
20
0 40 60 80 100 (B)
20
0 40 60 80 100 (C)
[image:9.612.65.553.74.570.2]the detection variable (Hegerl et al., 1996). The two broad approaches for fingerprint-based D&A analysis are the optimal regression-based and pattern
[image:10.612.66.547.89.620.2]correlation based approaches. The pattern correlation based approaches have an added advantage that they check for both amplitude and strength of the signal
Fig. 8: Detection plot for monsoon precipitation. The ensemble-averaged signal strengths (S values) from each model run (dots) and their 95% confidence intervals (bars) are shown. The observed signal strength (Sobs) with its 95% confidence interval, considering the multimodel ensemble-averaged ANTH fingerprint is shown in black. The GCMs for which the ANTH signal strength is inconsistent in sign with the observed signal strength are marked in cyan and those for which the ANTH signal strength is consistent with the observed signal strength are marked in blue (Source: Mondal and Mujumdar, 2012)
0.1
0.08
0.06
0.04
0.02
S
ig
n
a
l
S
tr
e
n
g
th
0
-0.02
-0.04
-0.06
0 10 20 30 40 50
0.15
0.1
0.05
S
ig
n
a
l
S
tr
e
n
g
th
0
-0.05
and not just whether the patterns are similar. standardized probability-based index from annual maximum one-day (RX1D) and five-day accumulated (RX5D) rainfall is considered to conduct D&A analysis on precipitation extremes over India using pattern-correlation based fingerprint method by Mondal and Mujumdar (2015a). They concluded that at 95% confidence, no signals are detected for RX1D, while for the RX5D and multivariate cases only the anthropogenic signal is detected. Their findings indicate that model simulations may under estimateregional climate system responses to increasing human forcings for extremes, and though anthropogenic factors may have a role to play in causing changes in extreme precipitation, their detection is difficult at regional scales and not statistically significant.
Hydrological extremes such as floods and droughts at regional scales are of increasing concern to researchers and policy makers as such events can directly impact societies. Changing patterns of such
extreme events linked with global warming have non-stationarity induced by rapid climate change and/or anthropogenic interventions, violating the assumption of stationarity. For nonstationary possible future realizations, Mondal and Mujumdar (2016) investigated the validity of the stationary historical design magnitudes or return levels of floods, taking into account the uncertainties in the estimation of observed and projected return levels. They concluded that although some flood projections are nonstationary, most of them are stationary in nature, and there is no significant change in flood return level across the projections is detected in the case study of floods in the Columbia River (Fig. 9).
[image:11.612.92.537.384.703.2]It is also important to understand the other extremes like droughts, in addition to the floods, for long term planning and management of water resources. A comprehensive assessment of drought characteristics and its variation is thus necessary and challenging at the same time due to considerable variation of drought events in both time and extent.
Fig. 9: Observed and multi-model extreme projection (combination of the 11 projections taking the maximum at each year): (a) 75-year; (b) 100-year return levels for floods and their 95% confidence intervals estimated by the delta method; the year of detection is shown by the vertical line (Source: Mondal and Mujumdar, 2016)
7 5 -y e a r re tu rn l e v e l fl o o d ( c fa ) 0.8 0.9 1 1.1 1.2 1.3 1.4 6
1950 2000 2027 2050 2100
Multi-model Projection Observed 1 0 0 -y e a r re tu rn l e v e l fl o o d ( c fa ) 0.8 0.9 1 1.1 1.2 1.3 1.4 6
1950 2000 2050 2065 2100
(A)
The projected return levels (or the conditional quantiles) derived from regional drought projections are compared with those from observed naturalized streamflows by Mondal and Mujumdar (2015b). They concluded that there is no uniform pattern of changes in drought quantiles is observed across all the projections. Though many projections are found to be non-stationary, some projections indicate shifting to a stationary regime for the study region.
Modelling Concurrent Extremes
In view of changing climate, a combination of low rainfall and abnormally high temperatures can have significant consequences compared to their individual occurrence. Globally, the warming climate has increased concurrent extremes such as heat waves and droughts (Leonard et al., 2014; Hao et al., 2013). The rise in global temperatures increases the probability that multiple extremes such as droughts and heat waves will occur simultaneously (Aghakouchak et al., 2014). Increased warming due to climate change may not cause droughts, but it is expected to intensify the severity of droughts (Trenberth et al., 2013), Aghakouchak et al. (2014) showed that a univariate return period or the risk underestimates the risk of the concurrent extremes and suggested that a multivariate viewpoint is necessary for assessing risk of extreme events, especially in a warming climate. The concurrence of meteorological droughts and heatwaves is investigated by Sharma and Mujumdar (2017) in India. They have concluded that there is a substantial increase in the frequency of concurrent heatwaves and droughts across India. Statistically significant trends in the spatial extent of droughts are observed in Central Northeast India and West Central India; however, the spatial extent affected by concurrent droughts and heatwaves is increasing across whole India. Significant shifts are identified in the distribution of spatial extent of concurrent drought and heatwaves in India compared to the base period. Positive feedback between these two extremes can worsen the rainfall deficit situation to serious soil moisture depletion due to the enhanced evapotranspiration.
Urban Flooding Modelling
It is also important to understand the changes in frequency, duration and changes in patterns of
hydrologic extremes in urban areas due to climate change. Urbanisation alters the hydrologic response of a catchment, resulting in the increased runoff rates and volumes, and loss of infiltration and base flow. In general, quick runoff response to precipitation extremes due to short times of concentration in urban areas, exacerbated by inadequate storm water drainage infrastructure, causes intense floods. Quantifying the short duration precipitation extremes is, therefore, crucial in hydrologic designs of urban infrastructure. Also, quantifying distributional behaviour of extreme events is important due to the sparse data at fine resolutions.
Climate change is likely to cause variations in intensity, duration, and frequency of extreme precipitation events. Quantifying the potential impacts of climate change and adapting to them is one way to reduce vulnerability. Therefore, it is essential to update the Intensity Duration Frequency (IDF) relationships for future climatic conditions. Twenty-six GCMs from the CMIP5 datasets, along with four Representative Concentration Pathways (RCP) scenarios are considered by Chandra Rupa et al. (2015) for studying the effects of climate change and to obtain projected IDF relationships for the case study of Bangalore City in India. GCM uncertainty due to the use of multiple GCMs is treated using Reliability Ensemble Averaging (REA) technique along with the parameter uncertainty. Scale invariance theory is employed for obtaining short duration return levels from daily data. It is concluded by them that the uncertainty in short duration rainfall return levels is high when compared to the longer durations. Further, it is observed that parameter uncertainty is large compared to the model uncertainty. Fig. 11A shows the variation in return levels for various durations in comparison with classical approach and historical time line
in urban areas and quantify the associated uncertainty. A spatial component is introduced in the parameters of the GEV through a latent spatial process by considering geographic and climatologic covariates. For Bangalore city, it is inferred that the elevation and mean monsoon precipitation are the predominant
covariates for annual maximum precipitation. Variation of seasonal extremes is also examined in this study. For the monsoon maximum precipitation, it is observed that the geographic covariates dominate while for the summer maximum precipitation, elevation and mean summer precipitation are the predominant covariates. A significant variation in spatial return levels of extreme
[image:13.612.70.546.77.601.2]precipitation is observed over the city (Fig. 11C).
The Chennai rapid assessment report, prepared
[image:14.612.69.548.81.657.2]by Narasimhan et al. (2016), is a voluntary work by researchers from IIT Madras, IIT Bombay and IISc, Bangalore to provide an understanding of various
factors that influenced the devastating floods in Chennai during Nov. and Dec. 2015.The devastating floods that hit Chennai city and other parts of Tamil Nadu during this period claimed more than 400 lives and caused enormous economic damages. Such a mammoth loss to life and property posed a challenge to the scientific community in developing a
comprehensive understanding of the event. The authors of this report came together voluntarily to collate the information and data available through various channels – media, internet, government and other sources – and to present it as coherently as possible. They strengthened the report by adding some quickly conducted preliminary analyses of the data. Answers to a number of pressing questions (such as, what were the atmospheric conditions for high intensity rainfall, how was the rainfall distributed spatially and temporally, how much flow occurred in the three rivers passing through the city, how were the two reservoirs operated etc.) related to the conditions prevailing during and immediately preceding the flooding period are necessary towards developing such an understanding. The information presented in the rapid assessment report would be useful to anyone interested in studying urban floods in the country and to policy makers.
Concluding Remarks
Water resources are inextricably linked with climate, and thus the global climate change has severe implications on water resources and regional development (IPCC, 2001). Assessing the impacts of climate change on hydrology and water resources essentially involves downscaling of global scale climatic variables to local scale hydrologic variables and computation of risk of hydrologic extremes in future for water resources planning and management (Mondal and Mujumdar, 2015c). In addition, estimating inherent uncertainties at each stage of the modelling is also crucial for an informed planning and management of water resources. Recent research work related to development of statistical downscaling models to assess climate change impacts and methodologies to address GCM and scenario uncertainties in assessing climate change impacts on hydrology are discussed in this paper.
Detecting, quantifying and modelling the effects of human-induced climate change in regional hydrology is important for studying the impacts of such changes on the water resources systems and for obtaining reliable projections to help in developing policies for adaptation. Global climate change is expected to alter the hydrologic cycle in multiple ways including intensification of hydrologic extremes. Such effects can have direct impacts on the society and
Fig. 11: (A) Variation in return levels for various durations in comparison with classical approach and historical time line, (B) Rainfall during July 24-30, 2016 in Bangalore Pilot Study Area, (C) Spatial maps of mean return levels (mm) for 10-year return period for selected hierarchical model with Bangalore City boundary and stations marked for annual maximum precipitation (Source: Chandra Rupa et al., 2015;
Chandra Rupa and Mujumdar, 2018)
0 20 40 60 80 100 120
R
a
in
fa
ll
(m
m
)
72-98 mm
23 25 27 29 31
Days (July 2016)
[image:15.612.68.296.80.526.2]pose a challenge to the scientific community (Mujumdar and Nagesh Kumar, 2012). In addition, understanding the effects of other variables such as temperature on the hydrological extremes of floods and droughts is also important. In case of simultaneous effects of extremes, it is necessary to model and obtain the risk of such concurrent extremes. Also, an understanding of the effect of extreme events in urban areas in terms of flooding is critical. Rigorous methods like Hierarchical Bayesian Models are required for understanding the spatial and temporal variation in short duration precipitation extremes.
The knowledge generated through research should be used in improving the present, poorly managed state of water resources. To help achieve this, it is the responsibility of the hydrologic research community to communicate the uncertainties correctly and to reduce the uncertainties in the projected impacts on water resources at different spatial and time scales. However, it is to be noted that there are limitations with the statistical based modelling and one must understand the basic assumptions of the modelling and the implications if there are deviations from those basic assumptions. Also, some issues (like lags in response, low-pressure systems, effects of dams on streamflow etc.) cannot be explicitly resolved using the computer-based models.
References
Agha Kouchak A, Cheng L, Mazdiyasni O and Farahmand A (2104) Global warming and changes in risk of concurrent climate extremes: Insights from the 2014 California drought Geophys Res Lett41 8847-8852
Basha G, Kishore P, Venkat Ratnam M, Jayaraman A, Amir Agha Kouchak, Taha B M J Ouarda and Isabella Velicogna (2017) Historical and Projected Surface Temperature over India during the 20th and 21st century Scientific Reports7 2987
Betts R A, Alfieri L, Bradshaw C, Caesar J, Feyen L, Friedlingstein P, Gohar L, Koutroulis A, Lewis K, Morfopoulos C, Papadimitriou L, Richardson K J, Tsanis I and Wyser K (2018) Changes in climate extremes, fresh water availability and vulnerability to food insecurity projected at 1.5°C and 2°C global warming with a higher-resolution global climate model Phil Trans R Soc A376 20160452
Chandra Rupa R and P P Mujumdar (2018) Quantification of Uncertainty in Spatial Return Levels of Urban Precipitation Extremes ASCE Journal of Hydrologic Engineering23 04017053 doi: 10.1061/(ASCE)HE.1943-5584.0001583
Chandra Rupa R, Ujjwal Saha and Mujumdar P P (2015) Model and Parameter Uncertainty in IDF Relationships under Climate Change Advances in Water Resources79 127-139
Chawla I and Mujumdar P P (2015) Isolating the Impacts of land Use and Climate Change on Streamflow Hydrol Earth Syst Sci19 3633-3651
Chawla I and Mujumdar P P (2018) Partitioning Uncertainty in Streamflow Projections under Nonstationary Model Conditions Advances in Water Resources112 266-282
Church J A, White N J and Hunter J R (2006) Sea-level rise at
tropical Pacific and Indian Ocean islands Global and Planetary Change53 155-168
Deletic A, Dotto C, Mccarthy D, Kleidorfer M, Freni G, Mannina G, Uhl M, Henrichs M, Fletcher T, Rauch W, Bertrandkrajewski J and Tait S (2012) Uncertainty in environmental and hydrological mathematical modelling Physics and Chemistry of the Earth42 3-10
Fowler H, Blenkinsop S and Tebaldi C (2007) Review Linking climate change modelling to impacts studies: recent advances in downscaling techniques for hydrological modelling Int J Climatol27 1547-1578
Ghosh S, Vittal H, Tarul Sharma, Subhankar Karmakar, Kasiviswanathan K S, Dhanesh Y, Sudheer K P and Gunthe S S (2016) Indian Summer Monsoon Rainfall: Implications of Contrasting Trends in the Spatial Variability of Means and Extremes PLoS ONE11 e0158670 doi:10.1371/ journal.pone.0158670
Ghosh S and Mujumdar P P (2009) Climate Change Impact Assessment-Uncertainty Modeling with Imprecise Probability Journal of Geophysical Research-Atmosphere
114 D18113, doi:10.1029/2008JD011648
Ghosh S and Mujumdar P P (2006) Future Rainfall Scenario over Orissa with GCM Projections by Statistical Downscaling Current Science90 396-404 (Pub : Indian Academy of Sciences, Bangalore)
Ghosh S and Mujumdar P P (2007) Nonparametric Methods for Modeling GCM and Scenario Uncertainty in Drought Assessment Water Resources Research43 W07405 doi: 10.1029/2006WR005351
Ghosh S and Mujumdar P P (2009) Climate Change Impact Assessment- Uncertainty Modeling with Imprecise Probability Journal of Geophysical Research - Atmospheres
114 D18113 doi:10.1029/2008JD011648
Ghosh S and Katkar S (2012) Modeling Uncertainty Resulting from Multiple Downscaling Methods in Assessing Hydrological Impacts of Climate Change Water Resources Management26 3559-3579 DOI 10.1007/s11269-012-0090-5
Ghosh S, Raje D and Mujumdar P P (2010) Mahanadi Streamflow: Climate Change Impact Assessment and Adaptive Strategies Current Science98 1084-1091
Gosain A K, Rao S and Basuray D (2006) Climate change impact assessment on hydrology of Indian river basins Current Science Special Section: Climate Change and India90 346-353
Goswami B N, Venugopal V, Sengupta D, Madhusoodanan M S and Prince K Xavier (2006) Increasing trend of extreme rain events over India in a warming environment Science
314 1442-1445
Han W, Meehl G A, Rajagopalan B, Fasullo J T, Hu A, Lin J, Large W G, Jih-wang Wang, Xiao-Wei Quan, Trenary L L, Wallcraft A, Shinoda T and Yeager S (2010) Patterns of Indian Ocean sea-level change in a warming climate Nature Geoscience3 546-550 DOI: 10.1038/NGEO901
Hao Z, Agha Kouchak A and Phillips T J (2013) Changes in concurrent monthly precipitation and temperature extremes Environ ResLett8 34014
Hegerl G C Hans von Storch and Klaus Hasselmann (1996) Detecting greenhouse-gas induced climate change with an optimal fingerprint method J Clim9 2281-2306
IPCC (2001) Climate Change 2001 - The scientific basis, Contribution of Working Group I to the Third Assessment Report of the Intergovernmental Panel on Climate Change Ed. by Houghton, JT, Y Ding, D J Griggs, M Noguer, P J van der Linden, X Dai, K Maskell and C A Johnson, Cambridge University Press, Cambridge, UK
IPCC (2010) Meeting report of the Intergovernmental Panel on climate change expert meeting on detection and attribution related to anthropogenic climate change Bern, Switzerland: Univ of Bern IPCC Working Group I Technical Support Unit
Jones P D, Murphy J M and Noguer M (1995) Simulation of climate change over Europe using a nested regional-climate model, I: assessment of control climate including sensitivity to location of lateral boundaries Q J R Meteorological Society121 1413-1449
Kannan S, Ghosh S, Mishra V and Salvi K (2014) Uncertainty
Resulting from Multiple Data Usage in Statistical Downscaling Geophys Res Lett41 4013-4019 doi:10.1002/ 2014GL060089
Kothawale D R and Rupa Kumar K (2005) On the recent changes in surface temperature trends over India Geophys Res Lett
32 L18714 doi:10.1029/2005GL023528
Leonard M, Westra S, Phatak A, Lambert M, B van den Hurk, McInnes K, Risbey J, Schuster S, Jakob D and Stafford-Smith M (2014) A compound event framework for understanding extreme impacts WIREs Clim Change5
113-128
Meenu R, Rehana S and Mujumdar P P (2013) Assessment of Hydrologic Impacts of Climate Change in Tunga-Bhadra River Basin, India with HEC-HMS and SDSM Hydrological Processes27 1572-1589
Mondal A and Mujumdar P P (2012) On the basin-scale detection and attribution of human-induced climate change in monsoon precipitation and streamflow Water Resources Research48 W10520
Mondal A and Mujumdar P P (2015a) On the Detection of Human Influence in Extreme Precipitation over India Journal of Hydrology529 1161-1172
Mondal A and Mujumdar P P (2015b) Return Levels of Hydrologic Droughts under Climate Change Advances in Water Resources75 67-75
Mondal A and Mujumdar P P (2015c) Modeling Non-Stationarity in Intensity, Duration and Frequency of Extreme Rainfall over India Journal of Hydrology521 217-231
Mondal A and Mujumdar P P (2016) Detection of Change in Flood Return Levels under Global Warming J Hydrol Eng
21 04016021 10.1061/(ASCE)HE.1943-5584.0001326, 04016021
Mujumdar P P and Nagesh Kumar D (2012) Floods in a Changing Climate: Hydrologic Modeling International Hydrology Series Cambridge University Press Cambridge U.K., ISBN-13: 9781107018761
Mujumdar P P (2013) Climate Change and Water National Science Seminar 2013 National Council of Science Museums
Mujumdar P P and Ghosh S (2007) Assessment of Impact of Global Climate Change on Precipitation at Regional Scales Hydrology Review INCOH Roorkee 22 21-36
Mujumdar P P and Ghosh S (2008) Modeling GCM and Scenario Uncertainty using a Possibilistic Approach: Application to the Mahanadi River, India Water Resources Research
44 W06407 doi:10.1029/2007WR006137
assessment Technical Report Interdisciplinary Centre for Water Research, IISc Bangalore, May 2016 (available online, http://www.icwar.iisc.ernet.in/wp-content/uploads/ 2016/06/Chennai-Floods-Rapid-Assessment-Report.pdf)
Palanisamy H, Cazenave A, Meyssignac B, Soudarin L, Wöppelmann G and Becker M (2014) Regional sea level variability, total relative sea level rise and its impacts on islands and coastal zones of Indian Ocean over the last sixty years Global and Planetary Change116 54-67
Poulin A, Brissette F, Leconte R, Arsenault R and Jean-Stéphane Malo (2011) Uncertainty of hydrological modelling in climate change impact studies in a Canadian, snow-dominated river basin J Hydrol409 626-636 doi: 10.1016/ j.jhydrol.2011.08.057
Raje D and Mujumdar P P (2009) A Conditional Random Field Based Downscaling Method for Assessment of Climate Change Impact on Multisite Daily Precipitation in the Mahanadi Basin Water Resources Research45 W10404 doi: 10.1029/2008WR007487. (Pub: American Geophysical Union)
Raje D and Mujumdar P P (2010a) Constraining Uncertainty in Regional Hydrologic Impacts of Climate Change: Nonstationarity in Downscaling Water Resources Research
46 W07543 doi:10.1029/2009WR008425
Raje D and Mujumdar P P (2010b) Hydrologic Drought Prediction under Climate Change: Uncertainty Modeling with Dempster-Shafer and Bayesian Approaches Advances in Water Resources doi: 10.1016/j.advwatres.2010.08.001
Raje D and Mujumdar P P (2010c) Reservoir Performance under Uncertainty in Hydrologic Impacts of Climate Change Advances in Water Resources33 312-326 doi: 10.1016/ j.advwatres.2009.12.008
Rajeevan M, Bhate J and Jaswal A K (2008) Analysis of variability and trends of extreme rainfall events over India using 104 years of gridded daily rainfall data Geophys Res Lett 35
L18707
Refsgaard J, Storm B and Clausen T (2010) Système Hydrologique Europeén (SHE): review and perspectives after 30 years development in distributed physically-based hydrological modelling Hydrol Res41 355-377
Santer BD, Mikolajewicz U, Brüggemann W, Cubasch U, Hasselmann K, Höck H, Maier-Reimer E and Wigley TM L (1995) Ocean variability and its influence on the detectability of greenhouse warming signals Journal of geophysical research100 10693-10710
Sengupta A and Rajeevan M (2013) Uncertainty quantification and reliability analysis of CMIP5 projections for the Indian summer monsoon Current Science105 1692-1703
Sharma S and Mujumdar P P (2017) Increasing Frequency and Spatial Extent of Concurrent Meteorological Droughts and Heatwaves in India Scientific Reports (Nature Publishing Group) 7 15582 doi:10.1038/s41598-017-15896-3
Teutschbein C and Seibert J (2012) Bias correction of regional climate model simulations for hydrological climate change impact studies: review and evaluation of different methods J Hydrol 456-457 12-29 doi:10.1016/j.jhydrol.2012.05.052
Trenberth K E, Dai A, van der Schrier G, Jones P D, Barichivich J, Briffa K R and Sheffield J (2013) Global warming and changes in drought Nat Clim Change4 17-22
Unnikrishnan A S, Rupa Kumar K, Fernandes S E, Michael G S and Patwardhan S K (2006) Sea level changes along the Indian coast: Observations and projections Current Science
90 362-368
Unnikrishnan A S and Shankar D (2007) Are sea-level-rise trends along the coasts of the north Indian Ocean consistent with global estimates? Global and Planetary Change57 301-307