ORIGINAL RESEARCH
Whither the Hippocampus? FDG-PET Hippocampal
Hypometabolism in Alzheimer Disease Revisited
J.A. Maldjian C.T. Whitlow for the Alzheimer’s Disease Neuroimaging Initiative*
EBM2
BACKGROUND AND PURPOSE: The hippocampus is a widely recognized area of early change in AD, yet voxelwise analyses of FDG-PET activity differences between AD and CN controls have consistently failed to identify hippocampal hypometabolism. In this article, we propose a high-dimensional PET-specific analysis framework to determine whether important hippocampal metabolic FDG-PET activity differences between patients with AD and CN subjects are embedded in the Jacobian information generated during spatial normalization.
MATERIALS AND METHODS:Resting FDG-PET data were obtained from 102 CN and 92 participants with AD from the ADNI data base. A PET-study-specific template was constructed using symmetric diffeomor-phic registration. Spatially normalized raw FDG maps, Jacobian determinant maps, and modulated maps were generated for all subjects. Statistical parametric mapping and tensor-based morphometry were performed, comparing patients with AD with CN subjects.
RESULTS: Whole-brain spatially normalized raw FDG maps demonstrated robust hypometabolism in cingulate gyrus and bilateral parietal areas. No hippocampal differences were present, except on ROI-based analyses with a hippocampal mask. Whole-brain modulated maps demonstrated robust bilateral hippocampal hypometabolism, and some hypometabolism in the posterior cingulate. Tensor-based morphometry demonstrated robust hippocampal differences only.
CONCLUSIONS:These results demonstrate that hippocampal metabolic differences are embedded in the Jacobian information from the spatial normalization procedure. We introduce a voxelwise PET-specific analysis framework based on the use of a PET-population-PET-specific template, high-dimensional symmetric diffeomorphic normalization, and the use of Jacobian information, which can provide substantially increased statistical power and an order of magnitude decrease in imaging costs.
ABBREVIATIONS:AD⫽Alzheimer disease; ADNI⫽Alzheimer’s Disease Neuroimaging Initiative; CN⫽cognitively normal; FWE⫽family-wise error; hpa⫽ hippocampal/parahippocampal/amyg-dala; MCI⫽ mild cognitive impairment; SyN⫽ symmetric diffeomorphic registration; VBM⫽ voxel-based morphometry
T
he hippocampus is widely recognized as an area of early change in AD, with volume loss consistently reported across a wide variety of MR imaging studies, sample sizes, methodologies, and instruments.1The case for alteredhip-pocampal metabolism in AD, and, more specifically, for whole-brain FDG-PET, has been less clear and even divergent between studies. Most metabolic neuroimaging studies have failed to show hippocampal dysfunction in AD and MCI.2,3A
consistent and striking finding has been the lack of hippocam-pal metabolic differences on whole-brain FDG-PET using sta-tistical parametric mapping– based (SPM; Wellcome
Depart-ment of Imaging Neuroscience, London, UK) voxelwise analysis methods comparing patients with AD and CN control subjects.2-6 Group comparisons using these voxelwise PET
methods have consistently shown hypometabolism in the cin-gulate gyrus and temporoparietal areas for AD but, interest-ingly, not in the hippocampus. Some ROI-based methods, however, have shown hypometabolism in the hippocampus for AD,3,4,7-10and a variety of studies have attempted to ad-dress this apparent inconsistency between voxelwise and ROI-based methods. Many of these investigations have centered on potential methodologic artifacts or discrepancies related to spatial resolution, partial volume effects, inaccuracies in PET-MRI coregistration, and the method of PET intensity normal-ization.2-4,11,12 The lack of hippocampal metabolic change
(and, more specifically, hypometabolism in AD) associated with SPM-style voxelwise analyses, however, has not been ad-equately explained. We hypothesize that the source of the ap-parent discrepancy can be traced to the analytic methods and the nature of the question being posed in the analysis.
Voxelwise methods applied to FDG-PET data typically adapt techniques from VBM developed for MR imaging struc-tural analysis.13-17For PET data, this involves 1) coregistration
of the native subject PET data to the native MR imaging, 2) spatial normalization of the subject MRI scan to an atlas or study template (usually based on gray matter segmented tissue maps), and 3) application of the transformation parameters from the MR imaging normalization to the coregistered PET
Received January 31, 2012; accepted after revision February 20, 2012.
From the Department of Radiology (J.A.M., C.T.W.) and Translational Science Institute (C.T.W.), Wake Forest School of Medicine, Winston-Salem, North Carolina.
* Data used in preparation of this article were obtained from the Alzheimer’s Disease Neuroimaging Initiative (ADNI) data base (http://adni.loni.ucla.edu). As such, the investi-gators within the ADNI contributed to the design and implementation of ADNI and/or provided data but did not participate in analysis or writing of this report. A complete listing of ADNI investigators can be found at http://adni.loni.ucla.edu/wp-content/uploads/how_ to_apply/ADNI_Acknowledgement_List.pdf
Please address correspondence to Joseph Maldjian, MD, Department of Radiology, Wake Forest University Health Sciences, Winston-Salem, NC 27157; e-mail: maldjian@ wakehealth.edu
Indicates open access to non-subscribers at www.ajnr.org
Indicates article with supplemental on-line table.
EBM2indicates Evidence-Based Medicine Level 2 as designated by peer reviewers. http://dx.doi.org/10.3174/ajnr.A3113
FUNCTIONAL
ORIGINAL
data. These steps bring the individual subject PET images into alignment with each other in template space, allowing voxel-wise analysis of differences using standard SPM-style 2-sample
t-statistics. In comparison with the MRI-based VBM pipeline, there is a critical step that is universally omitted. In MRI-based analysis, the spatially normalized images are modulated, with the determinant of the Jacobian specifying the degree of ex-pansion or contraction at each voxel. This is necessary to pre-serve gray matter volumes, as a perfect normalization would show no differences in the spatially normalized images alone (referred to as gray matter concentration). Specifically, a voxel that is segmented as 100% gray matter (concentration) on MR imaging will not vary in gray matter content between popula-tions, and hence, a perfect MR imaging spatial normalization will show no differences in gray matter concentration between template and normalized subject. With the advent of highly accurate high-dimensional normalization algorithms, this re-alization has led to a method of analysis termed tensor-based morphometry, in which group differences are identified en-tirely on the basis of the shape change parameters rather than the spatially normalized images that, alone, would carry very little information on the structural differences. The situation for PET is different, in that voxels can show differential FDG activity despite having equal gray matter content. In addition, the assumption that coregistration between PET and MR im-aging can be performed accurately in diseased states, for the purposes of applying MR imaging normalization parameters, can be called into question. For example, diseased hippocam-pal activity on PET imaging may not be reflective of the entire spatial extent of the hippocampus visible to the human ob-server or to a computer algorithm on the corresponding MRI, which is a central assumption for accurate coregistration be-tween structures.
In this study, we investigate hippocampal metabolic activ-ity in AD using a PET-specific framework with a novel high-dimensional normalization strategy, while accounting for the degree of spatial deformation. Previous MRI-related normal-ization methodologic confounds are addressed by using a PET-specific population template. The purpose of this study is to determine whether important hippocampal metabolic FDG-PET activity differences in whole-brain voxelwise anal-yses between patients with AD and normal controls are em-bedded in the Jacobian information generated during spatial normalization.
Materials and Methods
Data used in the preparation of this article were obtained from the ADNI database (adni.loni.ucla.edu). The ADNI was launched in 2003 by the National Institute on Aging, the National Institute of Biomed-ical Imaging and Bioengineering, the Food and Drug Administration, private pharmaceutical companies and non-profit organizations, as a $60 million, 5-year public-private partnership. The primary goal of ADNI has been to test whether serial MR imaging, positron emission tomography, other biological markers, and clinical and neuropsycho-logical assessment can be combined to measure the progression of MCI and early AD. Determination of sensitive and specific markers of very early AD progression is intended to aid researchers and clinicians to develop new treatments and monitor their effectiveness, as well as lessen the time and cost of clinical trials.
The Principal Investigator of this initiative is Michael W. Weiner,
MD, VA Medical Center and University of California–San Francisco. ADNI is the result of efforts of many co-investigators from a broad range of academic institutions and private corporations, and subjects have been recruited from over 50 sites across the U.S. and Canada. The initial goal of ADNI was to recruit 800 adults, ages 55 to 90, to participate in the research, approximately 200 cognitively normal older individuals to be followed for 3 years, 400 people with MCI to be followed for 3 years and 200 people with early AD to be followed for 2 years. For up-to-date information, see www.adni-info.org.
Participants
We used available baseline PET-FDG data, as described in the ADNI acquisition protocol,18-19from 102 CN subjects (average age 75.8 years; 62 male, 40 female) and 92 patients with AD (average age 75.5 years, 55 male, 37 female) participants. Subject IDs are provided in the On-line Table.
PET Scans
Preprocessing by ADNI project investigators includes reorientation to a common spatial orientation, resampling to 1.5-mm isotropic dimension, and intensity normalization to a subject-specific mask, such that voxel values in the mask sum to 1.19The intensity normal-ization step was designed to account for differences introduced by the use of multiple scanners.20
Standard PET Processing Framework
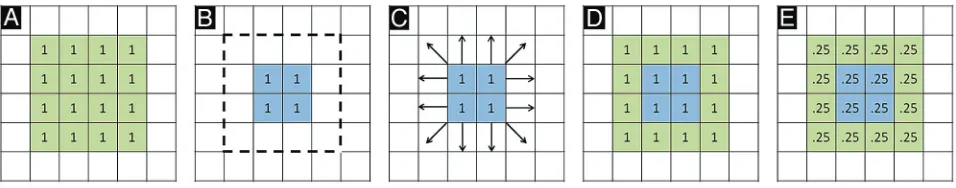
Before describing our image processing methodology, we first briefly review the standard PET processing framework, followed by a con-ceptualized description of spatially normalized, modulated, and Jaco-bian maps. In the typical PET processing pipeline, spatial normaliza-tion alone is performed based on MR imaging parameters, without any modulation with the Jacobian. After spatial normalization, the activity in the native image is resampled to the space of the template image. The voxel values are not altered. Comparison of these images asks the question, “Does average FDG activity differ between struc-tures?” This does not take into account the effects of atrophy or changes in local spatial distribution of activity (eg, up- or downregu-lation). Figure 1 demonstrates a conceptualized normalization for a representative atrophied area. After spatial normalization to a tem-plate of 16 voxels for the hippocampus, if the activity in an atrophied hippocampus (eg, 1 count for each of 4 voxels; Fig 1B) is the same as that for a normal hippocampus (1 count for each of 16 voxels in Fig 1A), there will be no difference between the normal and diseased areas (1 count for each of 16 voxels; Fig 1D). Modulation of the spatially normalized images with the amount of shape change (Jacobian) scales the voxel values to reflect the original volume of the structure. A comparison of modulated images asks the question, “Does total ac-tivity differ between structures?” Using the same example, the 1 count in each of 16 voxels is now scaled for the degree of expansion, reduc-ing the value to 0.25 in each of the 16 voxels for the diseased case (Fig 1E). The Jacobian maps derived from the spatial normalization pa-rameters quantify the degree of local expansion or contraction re-quired to match the template. If there is no difference in average activity, all the differences will be present in the Jacobian deformation fields.
Symmetric Diffeomorphic Registration
differen-tiable inverse) to capture both large deformations and small shape changes.21In the largest evaluation of nonlinear brain registration algorithms to date, SyN provided the most consistently high accuracy across subjects and label sets.22
Custom Template Construction
A PET custom study-specific template was built using a diffeomor-phic shape and intensity averaging technique.21,23The PET template was constructed from 397 ADNI participants (102 CN, 203 with MCI, and 92 with AD, including participants for this study). Parameters for the template construction procedure included a 4-level Gaussian pyr-amid as the multiresolution strategy and the cross-correlation simi-larity metric, with 200 maximum iterations. This yielded an unbiased average shape and appearance template, as well as the set of diffeo-morphisms and inverse diffeodiffeo-morphisms that map from the template to each individual. The resulting PET study template was then nor-malized, using SyN to the Montreal Neurological Institute space PET template provided in SPM resampled to 1-mm isotropic voxel dimensions.21,23
PET Spatial Normalization
The subject-specific inverse deformation parameters computed from the PET population template generation procedure were combined with the custom PET template to Montreal Neurological Institute space normalization parameters to bring the PET individual subject images into Montreal Neurological Institute space in a single resam-pling step.
Modulation and Tensor-Based Morphometry
The nonlinear transformations from the SyN procedure provide de-formation tensor fields describing the voxelwise shape changes from the template to each subject’s brain. The Jacobian determinants of these deformation fields indicate the fractional volume expansion and contraction at each voxel required to match the template. PET-spe-cific modulated maps were generated by multiplying the spatially nor-malized PET images by the respective Jacobian determinants.
Statistical Group Comparisons
Voxelwise analyses were performed to identify regional variation in FDG activity between patients with AD and CN subjects using the 2-samplettest model in SPM8. Group comparisons were performed for 1) spatially normalized raw PET, 2) modulated PET (spatially normalized⫻Jacobian), and 3) Jacobian PET (tensor-based mor-phometry). For the spatially normalized raw PET data modeling in
SPM, no additional intensity scaling (eg, proportional scaling) was performed, as the preprocessed PET data downloaded from the ADNI data base were already subject to intensity scaling. In addition to whole-brain comparisons, an hpa mask was constructed using the automated anatomical labeling atlas,24 as implemented by the wfu_pickatlas25for ROI-based hypothesis testing in SPM8. All statis-tical parametric maps were thresholded atP⬍.05 and corrected for multiple comparisons using a stringent FWE-rate Bonferroni correc-tion for the whole-brain maps or the false discovery rate26-29for the hippocampal masked data.
Standard PET Processing
For comparison purposes, we also performed analysis of the data using a standard PET processing pipeline. PET images from each subject were coregistered to their corresponding MRI T1-weighted image using the mutual information algorithm in SPM8. The individ-ual subject MR images were segmented and normalized to Montreal Neurological Institute space using the Dartel high-dimensional warp-ing and the SPM8 new segment procedure, as implemented in the VBM8 toolbox. The coregistered PET images were normalized to Montreal Neurological Institute space using the transforms com-puted for the corresponding structural MR imaging. Effect sizes (Co-hend; correlation coefficient,r) were computed between the AD and CN groups using the hpa ROI for the following 3 analysis methods: modulated PET (custom PET template), standard PET-MRI, and MR imaging only (modulated gray matter VBM MRI images from the SPM8 new segment procedure). In addition, sample-size plots were generated for each analysis method using the hpa ROI with a type I error rate of .05.
Results
Spatially Normalized Raw PET Data
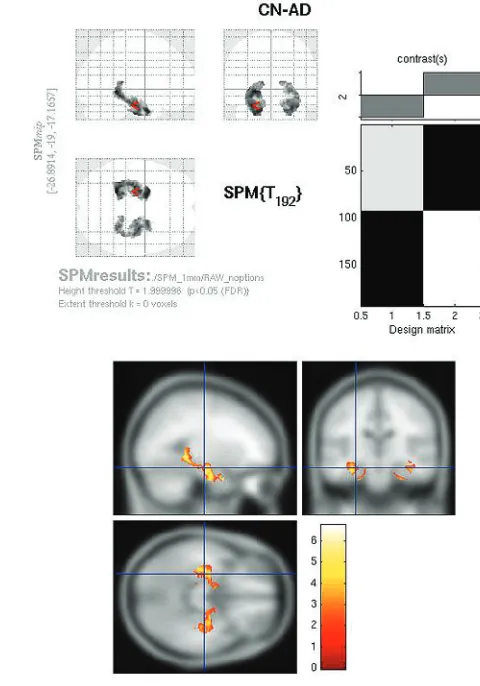
SPMt maps for CN-AD, using a stringentP⬍.05 FWE mul-tiple comparisons correction, demonstrated metabolic differ-ences in the posterior cingulate and bilateral parietal areas (Fig 2). There were no hippocampal regions that survived correc-tion on the whole-brain analysis. With the use of the hip-pocampal ROI mask, however, bilateral hiphip-pocampal meta-bolic differences were apparent (Fig 3).
Modulated PET Data (Custom Template)
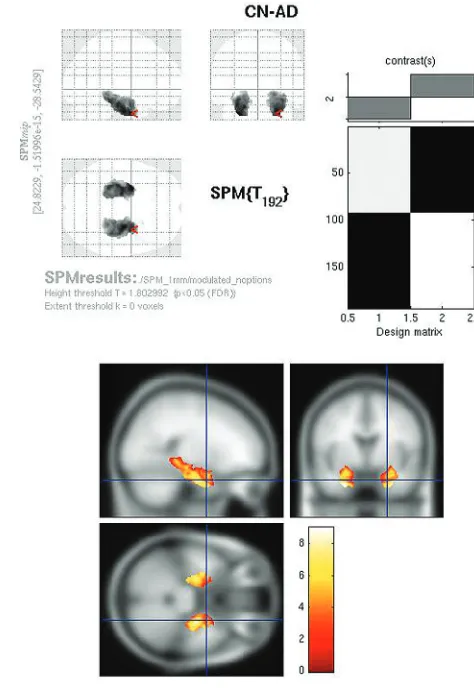
The modulated PET whole-brain SPMt analysis for CN-AD (P ⬍ .05, FWE corrected) demonstrated strong bilateral
[image:3.594.54.532.43.137.2]hippocampal metabolic differences as well as differences in the posterior cingulate (Fig 4). The parietal differences were no longer apparent. With the hpa mask, CN-AD demon-strated even more robust differences in the hippocampus (Fig 5).
Jacobian PET Data
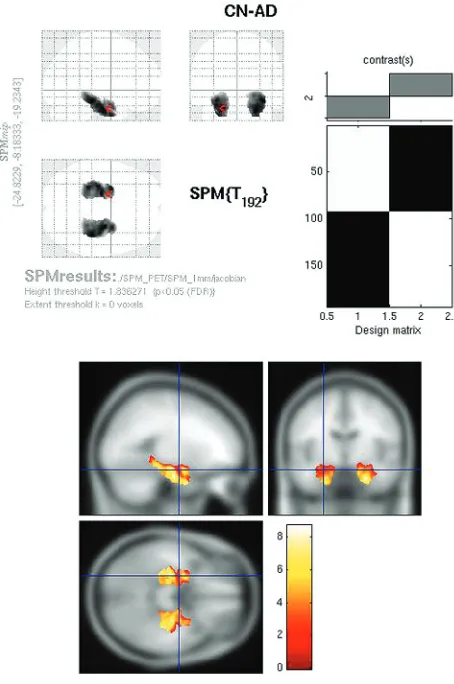
Whole-brain comparison of CN-AD on the Jacobian maps (P⬍.05, FWE corrected) demonstrated exclusively bilateral hippocampal metabolic differences (Fig 6). Other areas, in-cluding the cingulate and parietal regions, no longer survived multiple comparison correction. With the use of the hpa mask, strong hippocampal differences were again identified on the CN-AD (Fig 7).
Effect Sizes
Effect sizes for the modulated PET data (custom PET tem-plate) were 1.12 and 0.49 (Cohendandr, respectively). Effect sizes for the standard PET-MRI analysis were 0.47 and 0.23, while, for structural MR imaging alone, effect sizes were 1.58 and 0.62. Sample sizes for detecting a difference at 80% power with a .05 Type I error rate were 8, 12, and 68 subjects per group, for MR imaging alone, modulated PET, and standard PET, respectively (Fig 8).
Discussion
Whole-brain voxelwise analyses of FDG-PET data in studies of AD have been notoriously devoid of differences in the hip-pocampus. This has been ascribed to a variety of factors, in-cluding partial volume effects, limited spatial resolution, and poor registration between PET and MR imaging, but a defin-itive explanation has been lacking. We demonstrate that the hippocampal differences are not just present in the FDG-PET data—they are massive in scope and are comparable with those identified for structural MR imaging.
Hippocampal Activity Differences Embedded in Jacobian Determinants
The negative findings in previous FDG-PET reports stem from a processing approach adapted from the MRI VBM literature and the nature of the underlying comparisons in the activity being performed. Specifically, much of the activity difference is contained in the Jacobian information from the spatial nor-malization procedure. While the Jacobian is used for MRI VBM processing (modulated data, or tensor-based mor-phometry), it has instead been discarded in the PET process-ing pipeline. Because the warp fields are typically computed between individual subject MR imaging and template MR im-aging, and subsequently applied to coregistered PET data, it does not make sense to use this Jacobian information, as it
Fig 2.Raw FDG SPMt for CN-AD thresholded atP⬍.05 with FWE correction. Strong posterior cingulate gyrus and bilateral parietal metabolic activity differences are present. There is no activity difference that survives correction in the hippocampal regions.
[image:4.594.284.524.44.387.2] [image:4.594.56.282.47.388.2]would provide only a measure of MR imaging differences. We have taken the approach of generating a PET-study-specific template for the normalization procedure, rather than relying on coregistration between PET and MR imaging. Thus, the Jacobian information reflects only PET-related differences in populations, with no relationship to the MR imaging normal-ization procedure. Using this approach, large differences are identified specifically in the hippocampus on both the PET Jacobian maps alone, as well as the modulated PET data. The decreased metabolism on the raw FDG maps is not sufficient to survive multiple comparisons correction for whole-brain voxelwise studies. It only becomes apparent with the use of a hippocampal region of interest, which significantly reduces the multiple comparisons problem, allowing statistical signif-icance to be achieved.
An important question is whether there is decreased activ-ity, as a whole, in the hippocampus, taking into consideration the effects of atrophy. The critical piece of information is con-tained in the degree of expansion and contraction required to match the template. In the case of AD, there is a massive dif-ference in the activity levels in the hippocampus, as manifested on the modulated maps and in the Jacobian maps alone.
Extrahippocampal Regions
Some additional, interesting observations arise from an anal-ysis of the modulated and Jacobian maps, with reference to
areas outside the hippocampus. On the raw FDG maps, there are large activity differences in the parietal lobes bilaterally, as well as in the cingulate gyrus, which have been demonstrated in numerous FDG-PET studies. With modulation, however, the parietal areas disappear and the cingulate gyrus activity differences become markedly reduced, as well as more re-stricted to the posterior cingulate. On the Jacobian maps alone, there are no differences identified in either of these re-gions. In the context of the PET-based normalization proce-dure, this suggests that these areas have some increased spatial extent of FDG uptake in the patients with AD (or a spatial up-regulation) to compensate for the reduced underlying ac-tivity (assuming the difference is not attributable to a regional increase in gray matter volume in the subjects with AD).
Study-Specific PET Template
A significant methodologic departure proposed here is the use of a study-specific PET template for the spatial normalization procedure. Many previous studies have used coregistration of PET data to a corresponding MRI in the same subject, and application of the parameters computed from an MRI-to-MRI normalization procedure. The reasoning for this approach is that, due to the inherently higher spatial resolution, the MRI-based normalization is more accurate. This approach assumes that PET activity corresponds to anatomic structure in a con-sistent manner between disease states and anatomic locations.
Fig 4.Modulated FDG SPMt for CN-AD thresholded atP⬍.05 with FWE correction. Bilateral hippocampal activity differences are now present, as well as posterior cingulate gyrus activity differences. The parietal differences are no longer apparent, and the degree of cingulate gyrus activity difference is markedly reduced from the raw FDG comparison.
Fig 5.Modulated FDG SPMt for CN-AD with hippocampal ROI mask thresholded atP⬍
[image:5.594.291.528.43.387.2] [image:5.594.54.281.45.385.2]This assumption is not biologically plausible, as cerebral met-abolic activity levels can vary within anatomic structures, based on metabolic demand and underlying pathology. In ad-dition, this approach universally discards information on local expansion and contraction computed from the MRI-based parameters. The use of a PET-study-specific template allows the valid use of all normalization information (including the Jacobian determinants) to identify population differences based only on FDG-PET data. In previous reports, the use of MRI-to-MRI normalizations would invalidate any unique PET information to be gained from the tissue expansion and contraction coded in the MRI-based transformations. The PET data can contain combinations of information that may be lost when standard MRI-to-MRI normalization is trans-posed to PET, such as metabolic volumetric differences, activ-ity changes restricted to an anatomic structure, activactiv-ity differ-ential gradients across an anatomic structure, as well as up-regulation of the spatial extent of activity that may encompass more than a particular anatomic boundary.
The use of modulated data and Jacobian information is more than simply academic in importance. A primary goal of AD research is the search for early biomarkers to diagnose and evaluate treatment effects. Imaging has taken an important role in this regard, with numerous efforts aimed at using both MR imaging and PET imaging data for diagnosis and classifi-cation of subjects such as those with AD and MCI, or those
who are CN. With regard to PET, much of the sensitivity pres-ent in the data for idpres-entifying AD in the critical hippocampal regions is not currently being utilized. Incorporation of these additional imaging biomarkers (Jacobian and modulated data) may increase the sensitivity of methods for individual subject diagnosis, including those that rely on univariate sta-tistics,z-score population comparisons, and the newer ma-chine learning classification approaches.
Fig 6.Jacobian FDG SPMt for CN-AD thresholded atP⬍.05 with FWE correction. Bilateral hippocampal activity differences are present. The parietal and cingulate gyrus activity differences are no longer apparent.
Fig 7.Jacobian FDG SPMt for CN-AD with hippocampal ROI mask thresholded atP⬍.05 with false discovery rate correction. Strong bilateral hippocampal activity differences are present.
[image:6.594.301.528.43.385.2] [image:6.594.54.281.45.385.2] [image:6.594.303.530.429.584.2]The differences in analytic approaches are clearly exempli-fied by comparing power curves and sample sizes required to identify differences in populations for the hippocampal region (Fig 8). Using the modulated PET approach, a difference in populations can be identified using only 12 subjects per group. This is comparable with the power of using MRI VBM alone (8 subjects per group). In contrast, using the conventional PET approach, a 5- to 6-fold increase in subjects (68 subjects per group) is required to observe comparable differences. In ad-dition to the massive loss in sensitivity for identifying subtle differences, this translates to nearly an order of magnitude increase in imaging costs (in this example, well over $100,000, assuming $1000 per PET scan).
Use of Modulated Data
Unlike the case for structural MR imaging analyses, modu-lated data are typically not used for imaging studies of brain function. For example, in fMRI studies, most investigators are only interested in comparisons of the average signal within each region. Information on the total amount of signal in fMRI (provided by modulated data) within a region is typi-cally not considered. However, total activity may provide a better model for the underlying processes being studied. In this sense, the use of modulated data with functional brain imaging data (fMRI, PET, arterial spin-labeling, etc) may pro-vide a more appropriate model and better sensitivity, depend-ing on the question bedepend-ing asked.
Reconciling Voxelwise and ROI-Based Studies
We have demonstrated why previous SPM-style voxelwise analyses of AD PET data have not shown strong hippocampal differences. These previous SPM-style analyses are measuring average activity, which is enforced by the spatial normalization process. The average activity within the hippocampi between groups is not greatly different, whereas total activity shows large differences. Activity differences become apparent only with the use of a hippocampal region of interest, which re-duces the multiple comparisons problem. ROI methods do not need to correct for multiple comparisons. In this sense, the multiple comparisons correction applied to whole-brain vox-elwise studies is potentially the source of differences with ROI-based methods that are also measuring average activity. In addition, some manual and semiautomated ROI-based PET analyses demonstrating hippocampal hypometabolism are probably measuring total activity in the hippocampal region (or mean of total activity between hemispheres). This capabil-ity is inherent in the ROI-based approach, regardless of whether each hippocampus is carefully outlined on a corre-sponding structural image or drawn directly on the PET image itself.
Limitations
There are several potential limitations of our study. For the PET analysis, we used signal-intensity-scaled data from the ADNI data base. There are a variety of signal scaling methods used in PET imaging and continued debate regarding which to use in different circumstances.30,31The ADNI preprocessing is
essentially a proportional scaling approach, similar to that of SPM. We performed some analyses using additional propor-tional scaling in the SPM modeling and had similar results to
those reported here. In AD, the cerebellum is probably more normal in FDG activity than the remaining brain; thus, using a cerebellar standard would result in lower supratentorial values for AD and would probably increase the observed cingulate and bilateral parietal activity on the raw FDG maps. It is im-portant to note that a cerebellar normalization procedure can have a profound effect on the reverse AD-CN contrast, in which proportional scaling typically demonstrates large bilat-eral cerebellar activity differences, which disappear with cere-bellar normalization.30,31Thus, some care must be taken in
interpreting differences that relate to the regions used for in-tensity scaling in the frontotemporal dementias. Partial vol-ume effects can result in an underestimation of the metabolic activity.32,33Additional PET analyses performed using a
vox-elwise gray matter volume regression method34to correct for
these effects demonstrated similar findings. In many SPM VBM studies, a significant degree of spatial smoothing is used. This has the effect of increasing signal-to-noise for identifying subtle differences, as well as making the data more Gaussian for use with SPM Gaussian random field theory corrections. For this study, smoothing was unnecessary, as we had ample SNR for demonstrating activity differences. In addition, we used stringent Bonferroni corrections for whole-brain analy-ses, which do not rely on Gaussian random field theory.
Conclusions
We demonstrate the heretofore elusive AD hippocampal FDG-PET activity differences on whole-brain SPM voxelwise analyses to be embedded in spatial normalization Jacobian information. We introduce a PET-specific analysis framework using a PET population template, high-dimensional SyN, and Jacobian information as imaging biomarkers for whole-brain voxelwise FDG-PET analyses. The use of modulated data and Jacobian information may provide novel biomarkers of AD to diagnose and evaluate treatment effects.
Acknowledgments
Cooperative Study at the University of California, San Diego. ADNI data are disseminated by the Laboratory for Neuro Im-aging at the University of California, Los Angeles. This re-search was also supported by NIH grants P30 AG010129 and K01 AG030514.
References
1. Nestor PJ, Scheltens P, Hodges JR.Advances in the early detection of Alzhei-mer’s disease.Nat Med2004;10:S34 – 41
2. Mevel K, Desgranges B, Baron JC, et al.Detecting hippocampal hypometabo-lism in mild cognitive impairment using automatic voxel-based approaches.
Neuroimage2007;37:18 –25
3. Mosconi L, Tsui WH, De Santi S, et al.Reduced hippocampal metabolism in MCI and AD: automated FDG-PET image analysis.Neurology 2005;64: 1860 – 67
4. De Santi S, de Leon MJ, Rusinek H, et al.Hippocampal formation glucose metabolism and volume losses in MCI and AD.Neurobiol Aging2001;22: 529 –39
5. Ishii K, Sasaki M, Yamaji S, et al.Relatively preserved hippocampal glucose metabolism in mild Alzheimer’s disease.Dement Geriatr Cogn Disord1998;9: 317–22
6. Kawachi T, Ishii K, Sakamoto S, et al.Comparison of the diagnostic perfor-mance of FDG-PET and VBM-MRI in very mild Alzheimer’s disease.Eur J Nucl Med Mol Imaging2006;33:801– 09
7. de Leon MJ, McRae T, Rusinek H, et al.Cortisol reduces hippocampal glucose metabolism in normal elderly, but not in Alzheimer’s disease.J Clin Endocri-nol Metab1997;82:3251–59
8. Ouchi Y, Nobezawa S, Okada H, et al.Altered glucose metabolism in the hip-pocampal head in memory impairment.Neurology1998;51:136 – 42 9. de Leon MJ, Convit A, Wolf OT, et al.Prediction of cognitive decline in normal
elderly subjects with 2-[(18)F]fluoro-2-deoxy-D-glucose/poitron-emission tomography (FDG/PET).Proc Natl Acad Sci USA2001;98:10966 –71 10. Nestor PJ, Fryer TD, Smielewski P, et al.Limbic hypometabolism in
Alzhei-mer’s disease and mild cognitive impairment.Ann Neurol2003;54:343–51 11. Matsuda H, Kanetaka H, Ohnishi T, et al.Brain SPET abnormalities in
Alzhei-mer’s disease before and after atrophy correction.Eur J Nucl Med Mol Imaging
2002;29:1502– 05
12. Mosconi L, Sorbi S, de Leon MJ, et al.Hypometabolism exceeds atrophy in presymptomatic early-onset familial Alzheimer’s disease.J Nucl Med2006;47: 1778 – 86
13. Ashburner J, Friston KJ.Voxel-based morphometry–the methods.Neuroimage
2000;11:805–21
14. Friston KJ, Ashburner J, Poline J, et al.Spatial registration and normalization of images.Hum Brain Mapp1995;2:165– 89
15. Friston KJ, Frith CD, Liddle PF, et al.Comparing functional (PET) images: the assessment of significant change.J Cereb Blood Flow Metab1991;11:690 –99 16. Friston KJ, Passingham RE, Nutt JG, et al.Localisation in PET images: direct
fitting of the intercommissural (AC-PC) line.J Cereb Blood Flow Metab1989; 9:690 –95
17. Minoshima S, Frey KA, Koeppe RA, et al.A diagnostic approach in Alzheimer’s disease using three-dimensional stereotactic surface projections of fluorine-18-FDG-PET.J Nucl Med1995;36:1238 – 48
18. Mueller SG, Weiner MW, Thal LJ, et al.The Alzheimer’s Disease Neuroimag-ing Initiative.Neuroimaging Clin N Am2005;15:869 –77, xi-xii
19. Jagust WJ, Bandy D, Chen K, et al.The Alzheimer’s Disease Neuroimaging Initiative positron emission tomography core.Alzheimers Dement2010;6: 221–29
20. Landau SM, Harvey D, Madison CM, et al.Associations between cognitive, functional, and FDG-PET measures of decline in AD and MCI.Neurobiol Ag-ing2009;32:1207–18
21. Avants BB, Epstein CL, Grossman M, et al.Symmetric diffeomorphic image registration with cross-correlation: evaluating automated labeling of elderly and neurodegenerative brain.Med Image Anal2008;12:26 – 41
22. Klein A, Andersson J, Ardekani BA, et al.Evaluation of 14 nonlinear deforma-tion algorithms applied to human brain MRI registradeforma-tion.Neuroimage2009; 46:786 – 802
23. Avants B, Gee JC.Geodesic estimation for large deformation anatomical shape averaging and interpolation.Neuroimage2004;23:S139 –50
24. Tzourio-Mazoyer N, Landeau B, Papathanassiou D, et al.Automated anatom-ical labeling of activations in SPM using a macroscopic anatomanatom-ical parcella-tion of the MNI MRI single-subject brain.Neuroimage2002;15:273– 89 25. Maldjian JA, Laurienti PJ, Kraft RA, et al.An automated method for
neuro-anatomic and cytoarchitectonic atlas-based interrogation of fMRI data sets.
Neuroimage2003;19:1233–39
26. Hochberg MC, Kasper J, Williamson J, et al.The contribution of osteoarthritis to disability: preliminary data from the Women’s Health and Aging Study.
J Rheumatol Suppl1995;43:16 –18
27. Benjamini Y, Drai D, Elmer G, et al.Controlling the false discovery rate in behavior genetics research.Behav Brain Res2001;125:279 – 84
28. Benjamini Y, Hochberg Y.Controlling the false discovery rate: a practical and powerful approach to multiple testing.J Royal Stat Soc1995;57:289 –300 29. Yekutieli Y, Hochberg Y.Resampling-based false discovery rate controlling
multiple test procedures for correlated test statistics.J Statist Plann Inference
1999;82:171–96
30. Dukart J, Mueller K, Horstmann A, et al.Differential effects of global and cerebellar normalization on detection and differentiation of dementia in FDG-PET studies.Neuroimage2010;49:1490 –95
31. Yakushev I, Hammers A, Fellgiebel A, et al.SPM-based count normalization provides excellent discrimination of mild Alzheimer’s disease and amnestic mild cognitive impairment from healthy aging.Neuroimage2009;44:43–50 32. Meltzer CC, Leal JP, Mayberg HS, et al.Correction of PET data for partial
volume effects in human cerebral cortex by MR imaging.J Comput Assist To-mogr1990;14:561–70
33. Mu¨ller-Ga¨rtner HW, Links JM, Prince JL, et al.Measurement of radiotracer concentration in brain gray matter using positron emission tomography: MRI-based correction for partial volume effects.J Cereb Blood Flow Metab
1992;12:571– 83