Analysing Nursing Workload in
Intensive Care Unit by Using a Novel
Objective Tracking System
by Peng Guo
A thesis submitted for the degree of
Doctor of Philosophy in
Mechanical Engineering
at the
University of Canterbury
Christchurch, New Zealand
I
Acknowledgement
I would like to thank my supervisor, Distinguished Prof. J. Geoffrey Chase, who responsibly
provides me plenty of support. Thank you for giving me continuous guide and direction to
my research. Thanks for your positive response to my requests and paper writings. You let
me know what research is and how to conduct one. You let me dare to question, to challenge,
and to create. Your support makes me feel confident that I can achieve this academic goal.
Many thanks also go to my Co. supervisor Dr. Geoff Shaw. Thanks for all your help in
making this research possible in the Christchurch Hospital ICU. You give me the opportunity
to experience the clinical ICU and work there. We both know how difficult every step is to
make this experiment actually happen. Thank you for always encouraging me and supporting
me for every achievement I made.
I also would like to thank my assist supervisor, Dr. Yeong Shiong Chiew, who becomes a
good mentor and friend to me. Thank you for giving me continuous ideas and possible
solutions to many specific problems I encountered. Your conscientious researching attitude
let me understand the right attitude in academic field.
I must also thank all those people who give me technical support to solve all specific
problems. Many thanks go to Dr. Richard Green, Dr. Adrian Clark, and Dr. Lei Shao, who
helped me with Kinect coding; to Dr. Chris Pretty, Dr. Paul Docherty, and Dr. Matt Signal,
who helped me with Matlab coding, statistic analysing, and paper writing; and to Dr. Jennifer
II
I also need to thank many ICU staff, especially nurses Danny, Joyce, Jamma, Hannah,
Gabriel, and Shelly, who helped participating and cooperating in this research. Your
supporting attitude makes this research feasible and accurate. Many of you are so supportive
that you help me understand the ICU working environment, explain nursing duties to me, and
share your nursing experience.
Many thanks also go to my colleagues in bio-engineering centre. You guys create an
awesome, positive, and enjoyable working environment. Thanks are given to Azlan, Salwa,
Shunny, Musa, Cong Zhou, Fatanah, Jackie, Ummu, Sam, Hina, Alex, and Reza.
I also would like to thank all my friends in New Zealand, Jeremy, Esther, Miao Liu, Nathan,
Bradley, Jun, Connor, Paul and many others. You guys enrich my life and open my world in
the past few years. A big thank you also goes to my girlfriend Lisha Niu, who encourages and
supports me at all time.
I must also thank China Scholarship Council and University of Canterbury Joint Scholarship,
who provide me funds to make this research possible.
Last but not least, I would like to thank my parents and my family. Without your support and
your understanding, I would not have stood a chance to accomplish this study. I owe you
III
Table of Contents
ACKNOWLEDGEMENT ... I TABLE OF CONTENTS ...III LIST OF FIGURES ... VII LIST OF TABLES ... XII ABSTRACT ... XIII ABBREVIATIONS ... XVI
CHAPTER 1 INTRODUCTION ... 1
1.1NURSING WORKLOAD,ICU OPERATING COST AND PATIENT OUTCOME ... 3
1.2NURSE WORKLOAD IS DIFFICULT TO QUANTIFY. ... 6
1.3CURRENT WORKLOAD ASSESSMENT TOOLS ... 9
1.4THE POSSIBILITY OF AUTOMATIC SYSTEM TO QUANTIFY NURSING WORKLOAD ... 10
1.5RESEARCH OBJECTIVES... 11
1.6STRUCTURE OF THESIS ... 12
CHAPTER 2 COMPARISON OF POSSIBLE TRACKING SYSTEMS TO APPLY IN INTENSIVE CARE UNIT ... 15
2.1INTRODUCTION ... 16
2.2REQUIREMENTS FOR THE TRACKING SYSTEM ... 17
2.3DIFFERENT TRACKING SYSTEM DESIGNS ... 19
2.3.1 Facial detection ... 19
2.3.2 Color detection ... 20
2.3.3 Inferred detection ... 21
2.3.4 LPM ... 22
2.4COMPARISON OF DIFFERENT SYSTEMS ... 24
2.5SUMMARY ... 27
CHAPTER 3 DESIGN AND DEVELOPMENT OF CLINICAL ACTIVITY TRACKING SYSTEM (CATS) ... 28
3.1CATS HARDWARE COMPONENT:MICROSOFT KINECT ... 28
3.2KINECT RANGE OF DETECTION ... 31
3.3CATS SOFTWARE COMPONENT ... 34
3.3.1 OpenNI ... 34
3.3.2 OpenCV ... 36
3.3.3 Kinect for Windows software development kit (SDK) ... 37
3.4IMAGING PROCESSING PROCEDURES AND STORAGE ... 37
3.4.1 CATS software system initialization ... 37
3.4.2 Image filtering based on the range of minimum and maximum depth ... 38
3.4.3 Identification of human size blobs: filtering large and small blobs ... 40
3.4.4 Identifying head-shoulder distance and blob grouping ... 42
3.4.5 CATS data recording ... 43
3.5SUMMARY ... 45
CHAPTER 4: CATS PERFORMANCE IN AN EXPERIMENTAL ENVIRONMENT ... 46
IV
4.2CATS NURSING ACTIVITY EVALUATION METRICS ... 46
4.3SYSTEM EVALUATION METHODOLOGY... 48
4.3.1 Walking patterns for single candidate tests ... 49
4.3.2 Walking patterns for two candidate tests ... 50
4.3.3 Testing process for determining the optimal system setting ... 51
4.3.4 Absolute percentage error (APE) of motion tracking ... 51
4.3.5 Additional data processing: ... 53
4.4RESULTS ... 53
4.4.1 Test 1: finding optimal maximum and minimum depth ... 53
4.4.2 Test 2: different blob filters ... 57
4.4.3 Test 3: different walking paths ... 58
4.4.4 Test 4: different candidate heights ... 60
4.4.5 Test 5: multiple candidates tracking ... 61
4.5DISCUSSION ... 61
4.5.1 System mounting and area of interest ... 61
4.5.2 System and testing limitations ... 65
4.6SUMMARY ... 66
CHAPTER 5 CATS SETUP IN CLINICAL ENVIRONMENT ... 67
5.1INTRODUCTION ... 67
5.2SYSTEM SETUP IN CLINICAL TRIAL AND ETHIC APPROVAL ... 68
5.2.1 System setup ... 68
5.2.2 Ethics approval ... 69
5.3DATA POST-PROCESSING ACCORDING TO SPECIFIC LIMITATIONS IN 4 SUB-AREAS ... 69
5.3.1 Curtain filter ... 72
5.3.2. ‘Still objects’ filter ... 78
5.3.3 Flash object and short term non-moving objects filter ... 80
5.3.4 Long term multiple blobs filter ... 82
5.3.5. Non-moving nurse and family member filter ... 84
5.3.6 Overlapped area filter ... 86
5.4FILTER IN K1 AND K3 AREA ... 88
5.5PERFORMANCE OF FILTERS IN ALL 4 AREAS ... 91
5.6SUMMARY ... 93
CHAPTER 6 CLINICAL VALIDATION AND RELATIVE PRELIMINARY RESULTS ... 94
6.1INTRODUCTION ... 94
6.2VALIDATION METHOD DESIGN ... 95
6.3RELATIONSHIP BETWEEN CATS AND ACTUAL NURSING INTERVENTION ... 96
6.4DAY TIME-NIGHT TIME INTERVENTION DISTRIBUTION ... 100
6.5HEAT MAPS ... 102
6.6DISCUSSION ... 103
6.7SUMMARY ... 106
CHAPTER 7 COMPARISON OF DIFFERENT CLINICAL SCORING SYSTEMS AND RELATIVE RESULTS ... 107
7.1INTRODUCTION ... 107
7.2LITERATURE REVIEW ... 111
7.2.1 Patient illness severity assessment systems ... 111
7.2.2 Nursing workload assessment systems ... 114
V
7.4RESULTS ... 119
7.4.1 Mortality according to SAPS-II and APACHE-II ... 119
7.4.2 Patient clinical results ... 120
7.4.3 Correlation between different patient clinical scores... 125
7.4.4 Nurse-to-patient ratio prediction ... 125
7.4.5 Patient specific study ... 127
7.5DISCUSSION AND LIMITATIONS ... 130
7.5.1 TISS-28 and NEMS ... 130
7.5.2 APACHE-III, SAPS-II, APACHE-II and SOFA ... 131
7.5.3 Correlation between TISS-28 and patient acuity ... 134
7.5.4 Limitation ... 135
7.6SUMMARY ... 136
CHAPTER 8 PATIENT SEDATIVE CONDITIONS AND ITS RELATION WITH NURSING INTERVENTIONS ... 137
8.1INTRODUCTION ... 137
8.2DATA COLLECTION ... 139
8.3VALIDATION OF GSC AND RASS ... 140
8.3.1 Correlation between RASS and GCS ... 140
8.3.2 Correlation between RASS and sedative drug dose ... 142
8.3.3 Correlation between GCS and sedation drug dose ... 144
8.4SEDATION LEVEL DURING DAY AND NIGHT... 146
8.4.1 RASS 24-hour distribution ... 146
8.4.2 Sedation drug dose distribution ... 147
8.4.3 Correlation between day dose and night dose ... 148
8.5NURSING WORKLOAD AND PATIENT SEDATION LEVEL ... 150
8.5.1 Nursing workload and RASS ... 150
8.5.2 Correlation between nursing workload and GCS... 151
8.5.3 Correlation between nursing workload and sedative drug dose ... 152
8.6SUMMARY ... 154
CHAPTER 9 RELATION BETWEEN CATS NURSING INTERVENTION AND PATIENT CLINICAL CONDITIONS ... 155
9.1INTRODUCTION ... 155
9.2CORRELATION BETWEEN NURSING WORKLOAD AND DIFFERENT TIME OF THE DAY ... 159
9.3CORRELATION BETWEEN PATIENT ACUITY LEVEL AND NURSING WORKLOAD ... 162
9.3.1 Correlation between patient APACHE-II scores and nursing time ... 162
9.3.2 Correlation between patient APACHE-III scores and nursing time ... 163
9.3.3 Correlation between patient SAPS-II scores and nursing time ... 164
9.3.4 Correlation between patient SOFA scores and nursing time ... 164
9.3.5 Correlation between patient TISS-28 scores, NEMS and nursing time ... 166
9.4THE INFLUENCE OF OTHER FACTORS TO NURSING TIME ... 169
9.4.1 Correlation between patient age and nursing time ... 169
9.4.2 Correlation between patient gender and nursing time ... 169
9.4.3 Correlation between admission type and nursing time ... 169
9.4.4 Correlation between patient intubation condition and nursing time ... 171
9.4.5 Correlation between patient FiO2 level and nursing time ... 172
9.4.6 Correlation between patient LOS and nursing time ... 173
9.5SUMMARY ... 174
VI
10.1INTRODUCTION ... 175
10.2PATIENT SPECIFIC STUDY ... 175
10.3TEMPORAL PROGRESSION OF NURSING WORKLOAD AND ACUITY SCORES. ... 179
10.4RECOMMENDED NURSE-TO-PATIENT RATIO ... 183
10.5SUMMARY ... 186
CHAPTER 11 CONCLUSIONS, LIMITATIONS AND FUTURE WORK ... 187
11.1CONCLUSIONS ... 187
11.1.1 CATS development ... 187
11.1.2 Clinical conclusions ... 188
11.2LIMITATIONS ... 189
11.3FUTURE WORK ... 190
11.3.1 Further develop of nursing tracking system ... 190
11.3.2 Clinical future works ... 191
REFERENCES ... 193
VII
List of Figures
Figure 1.1: A typical intensive care unit patient. ... 2
Figure 1.2: Correlation between nursing workload, patient mortality, nurse job satisfaction, ICU cost, and nurse-to-patient ratio. ... 6
Figure 2.1: Left: Layout of one unit in ICU; Right: a typical Christchurch ICU unit. ... 18
Figure 2.2: Uniform color detection... 21
Figure 2.3: The depth sensor captured image and the color image. ... 22
Figure 2.4: Basic arrangement of transponders, BSs, and MPU, and the signal flow within the LPM system. .... 23
Figure 3.1: Kinect system image showing the overall sensor package. ... 30
Figure 3.2: Mechanical installation of Kinect onto ceiling. ... 31
Figure 3.3: Front view of system configuration. ... 31
Figure 3.4: CATS configuration and geometry. ... 32
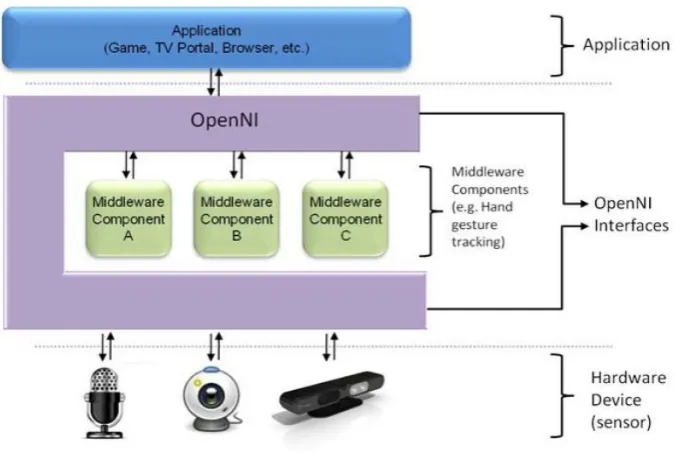
Figure 3.5: Three-layered view of the OpenNI Concept with each layer representing an integral element. ... 36
Figure 3.6: Detected object changes from black (out of detection area or above maximum detection setting) to gray (just entering maximum detection setting) to white (close to minimum detection setting), and then suddenly black (less than minimum detection setting). ... 39
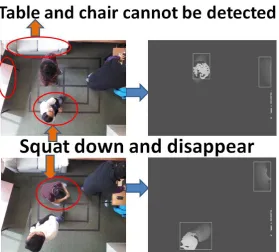
Figure 3.7: Object disappears when they are out of the Maximum and Minimum Depth range, thus eliminate the influence of table and desk, especially in ICU case, the influence from patient bed and curtain. In the top frames, the top left person stands and lower left squats. In the bottom frames, the roles are reversed. The third person, on the right, remains fixed partly squatting. ... 39
Figure 3.8: Depth image captured from Kinect is combined with generated mask to create ready for used depth image. Generated Mask can filter objects out of detection range, only keeping those between maximum depth and minimum depth. ... 40
Figure 3.9: Connected arrays of pixels defined as blobs. ... 41
Figure 3.10: Objects bigger or smaller than human size are not recorded. (a): The large blob created by having a subject carrying a large tray close to their body is filtered. Position of person at the right top corner is recorded, as shown with a white rectangular box. (b): The small blob created by raising a person’s hand is filtered, and the tracked blobs are distinguished by a box. ... 41
Figure 3.11: Example of multiple blobs within 150 pixels distance combining into one. ... 43
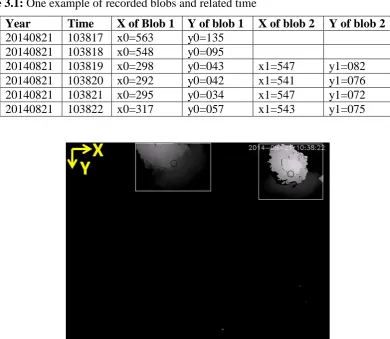
Figure 3.12: An example of recorded depth image frame with 2 person detected and current time is displayed at the right top corner. The original point is at frame left top corner. The relatively position are saved in ‘csv’ file and shown in Table 3.1. ... 44
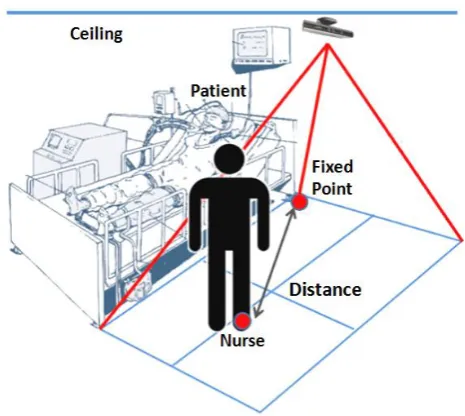
Figure 4.1: The distance between each nurse and the fixed point ... 47
Figure 4.2: The tracking area is divided into 4 zones with 9 designated feature points. ... 49
Figure 4.3: Different motion paths and timing for the single candidate tests. The time in each region indicate times where the person stopped walking and assessed as dwell time. ... 50
Figure 4.4: The walking pattern designed for two people. The first candidate was 1.90 m tall and the second candidate was 1.67 m tall. Person 1 stopped at points 1-3-9-7 for 20-40-20-40 seconds, and Person 2 stopped at points 9-7-1-3 for 20-40-20-40 seconds. ... 50
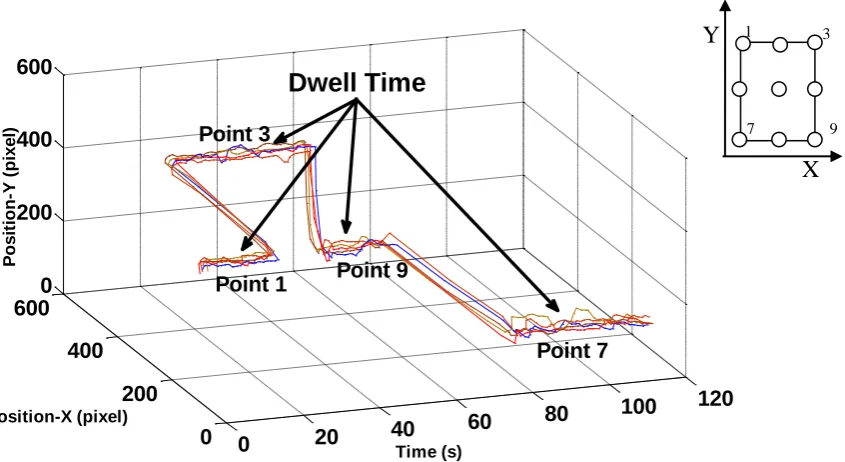
Figure 4.5: 3-D plot of test candidate centre position versus dwell time. Test candidate follow walking path in Figure 4.3(a), with 5 iterations. ... 53
Figure 4.6: When people bend over, shoulder and head could be detected as 2 separate blobs. Blob size filter helps eliminating objects too big or too small to be a human, while blob distance filter helps combining nearby blobs into one. ... 63
VIII
IX
time from 12am-10am in the area K1. The total intervention dwell time is 4335 seconds, which is 91.28% of total nursing intervention. ... 90 Figure 5.21: Left: Contour of cumulative nursing intervention distribution on a given 12am~10am. Right: Contour of probability density or heat map labelled to show area next to the patient head and other clinical equipment. Units of X and Y are all in pixels. ... 90 Figure 6.1: 30-hour observed nursing intervention and CATS detected nursing intervention. K1 + K3 is
intervention in K13 area, K1 + K2 + K3 + K4 is intervention in K1234 area. ... 97 Figure 6.2: Correlation plot of observed intervention (Atime) and CATS detected intervention (Ctime). The X-axis is the CATS monitoring (Ctime in minutes/hour) and Y-axis is the corresponding observed intervention (Atime in minutes/hour). The solid line represents the linear relation between Atime and Ctime calculated in area K13. The dashed line is the relation between Atime and Ctime in K1234. ... 97 Figure 6.3: Scatter plot of observed intervention time (Atime) and CATS detected intervention time (Ctime). ... 98 Figure 6.4: Bland-Altman plot showing the agreement between manual observation and CATS monitoring in K13. ... 99 Figure 6.5: Bland-Altman plot showing the agreement between manual observation and CATS monitoring in K1234. ... 100 Figure 6.6: 24-hour nursing intervention distribution based on the initial 30 days observational study. ... 100 Figure 6.7: 24-hour nursing intervention distribution based on a 60 days of observation. ... 101 Figure 6.8: Heat map on a particular patient day. (a-d) show each sub-area nursing intervention in K1~K4 respectively, and (e) shows the combination of 4 areas. ... 104 Figure 7.1: Left:APACHE-II scores and relative estimated mortality according to 104 patient days. Right: SAPS-II scores and relative estimated mortality. Both of them fit sigmoid relationship: mortality= c/ (1 + exp
X
Figure 8.7: (a): 24-hour RASS distribution for Patient Group C; (b): Day (7am - 11pm) and night (11pm - 7am)
RASS distribution... 147
Figure 8.8: (a): 24-hour sedative drug dose distribution for Patient Group B; (b): Day (7am - 11pm) and night (11pm - 7am) sedative drug dose distribution. ... 148
Figure 8.9: Daily and nightly sedative drug dose are highly correlated. ... 149
Figure 8.10: Cumulative distribution of sedative drug dose during day and night in Patient Group B. ... 149
Figure 8.11: Nursing time distribution based on different RASS scores for Patient Group A. Four hours of +1 data is combined with RASS = 0. ... 151
Figure 8.12: Correlation between nursing time and RASS scores for Patient Group A. ... 151
Figure 8.13: Nursing time distribution based on different GCS scores for Patient Group A. ... 152
Figure 8.14: Correlation between nursing time and GCS scores for Patient Group A. ... 152
Figure 8.15: Nursing time distribution based on different sedative drug dose. (a): Data from Patient Group A. Number of patient hours is presented on each box. (b): Data based on 65 patient days from Patient Group D). Number of patient days is given below each box. ... 153
Figure 8.16: Correlation between nursing time and sedative drug dose, based on 65 patient days, only includes patient with LOS more than 3 days and patient requires sedative drugs. ... 154
Figure 9.1: (a-c): The distribution for average nursing intervention time per day, 24-hour, day time, and night time. (a) is not simply the average of (b) and (c) as high day-time intervention caused 24-hour intervention much higher than night-time intervention. ... 160
Figure 9.2: Cumulative distribution of nursing intervention. ... 161
Figure 9.3: Correlation between average nursing intervention time at night and day. X-axis represents the average nursing intervention of each night (11 pm – 7 am); Y-axis represents the corresponding nursing intervention of each day (7 am – 11 pm). ... 162
Figure 9.4: (a-c): Correlation between patient APACHE-II scores and CATS recorded nursing time during day, night, and 24-hour, respectively. ... 163
Figure 9.5: (a-c): Correlation between patient APACHE-III scores and nursing time during day, night, and entire 24-hour period, based on 104 patient days. (d-f): Correlation between patient APACHE-III (204) and nursing time during day, night, and entire 24-hour period. ... 165
Figure 9.6: (a-c): Correlation between patient SAPS-II scores and average nursing time during day, night, and entire 24-hour period, based on 104 patient days. ... 166
Figure 9.7: (a-c): Correlation between patient SOFA scores and average nursing time during day, night, and entire 24-hour period, based on 104 patient days. ... 167
Figure 9.8: (a-c): Correlation between patient TISS-28 scores and average nursing time during day, night, and entire 24-hour period, based on 104 patient days. (d-f): Correlation between NEMS scores and average nursing time during day, night, and entire 24-hour period. ... 168
Figure 9.9: (a): Nursing time distribution according to different age groups. Patient days are presented at top of each box. (b): Correlation between patient age and ‘day average’ nursing time, based on 104 patient days. (c): Correlation between patient age and ‘patient average’ nursing time, based on 23 patients. Day average nursing time is the average nursing time during every 24 hours, while patient average nursing time is the average nursing time during every patient’s LOS. ... 170
Figure 9.10: Nursing time distribution based on different patient genders. (a) is based on 104 patient days, of which 70 days were from male patients; (b) is based on 23 patients, of which 13 are male patients. ... 171
XI
XII
List of Tables
Table 1.1: Nursing work direct related to patient ... 8
Table 1.2: Nursing work indirect related to patient ... 8
Table 2.1: Comparison between different recognition and tracking approaches ... 24
Table 3.1: One example of recorded blobs and related time... 44
Table 4.1: Distance to a fixed point (640,480) within 120 seconds for 5 iterations and one subject ... 52
Table 4.2: Tracking area based on maximum and minimum depth variables ... 54
Table 4.3: Test 1: The consistency of tracking with different maximum depth. The walking pattern used is shown in Figure 4.3 (a), with the Fixed Point at top right corner, as shown in Figure 4.2. In plots a) - c), each line shows the distance to the fixed point for different iterations; plots d) – f) show the dwelling time of the first iteration; and plots g) – i) show the error CDF over 5 iterations. ... 55
Table 4.4: Test 1: The consistency of the tracking with different minimum depth. The walking pattern used is shown in Figure 4.3 (c), with the Fixed Point at top right corner. In plots a) - c), each line shows the distance to the fixed point for different iterations; plots d) – f) show the dwelling time of the first iteration; and plots g) – i) show the error CDF over 5 iterations. ... 56
Table 4.5: Test 2: The consistency of tracking with different blob filter. The walking pattern used is shown in Figure 4.3 (a), with the Fixed Point at top right corner. Plots a) and b) show distance from the fixed point for each iteration; plots c) and d) show the dwelling time of the first iteration; and plots e) and f) show the error distributions. ... 58
Table 4.6: Test 3: The consistency of tracking with different paths. ... 59
Table 4.7: Test 4: The consistency of tracking different height using walking patterns from Figure 4.3(a). ... 60
Table 4.8: Test 5: multiple candidates monitoring using walking pattern from Figure 4.4... 62
Table 5.1: Nursing intervention and heat map in each area before and after using filters to eliminate ‘noise’ intervention. Units of heat maps are all in pixels. ... 91
Table 6.1: Median intervention in each hour (30 days of observation) ... 101
Table 6.2: Median intervention in each hour (60 days of observation) ... 101
Table 7.1: Correlation between SOFA scores and hospital mortality ... 113
Table 7.2: Patient demographics ... 118
Table 7.3: Patient clinical evaluation items calculated each day of stay ... 119
Table 7.4(a): 23 patients’ average clinical results during their LOS ... 121
Table 7.4(b): 23 patients’ median clinical results during their LOS ... 123
Table 7.5: Clinical score results from 104 patient days. ... 124
Table 7.6: Clinical score results over 104 patient days (in percentage) ... 124
Table 7.7: Correlation co-efficient, R, between different nurse workload and patient illness severity scores. .. 125
Table 7.8: Correlation and correlation equations relating TISS-28 and other clinical scores ... 127
Table 7.9: TISS-28 items, points, how many patient days are counted, percentage, and whether each item is likely to change ... 133
Table 8.1: Different patient groups based on their LOS in ‘Bed 7’ and sedative drug dosage ... 140
Table 8.2: 5th, 25th, 50th, 75th, and 95th percentile of average dose for the day, night, and entire 24-hour period (units/hour) ... 150
Table 9.1: 5% CI, 25% CI, median, 75% CI, and 95% CI of nursing intervention time (minutes/hour) during the day, night, and 24-hour period ... 161
Table 10.1: 6 selected patients’ demographics details, acuity evaluation levels, and nursing demands ... 176
Table 10.2 (a): Calculation of nurse-to-patient ratio during night shift (23:00~07:00) ... 184
XIII
Abstract
Quantifying nursing workload in Intensive Care Unit (ICU) can help optimize nursing
resources, allowing allocation of nurses according to patient demand. This can benefit the
ICU patients and nurses through the provision of adequate nursing care, prevention of nurse
burnout, and reducing of ICU fixed costs. However, quantifying nursing workload is
extremely challenging. Current nursing workload assessment tools, such as the therapeutic
interventions scoring system (TISS) and nursing activities score (NAS), are subjective and
laborious, requiring experienced nurses and researchers to fill out forms. Therefore, an
automatic system that can objectively quantify nursing workload is required. The
development of computer imaging and tracking technology offer possible solutions to track
nursing activities.
This research focuses on developing a novel tracking system that can continuously track
bedside nursing interventions and quantify nursing workload. Nursing workload is then
compared with patient clinical data to analyse which factors strongly influence patient
nursing demands. The first part of this thesis discusses the development of a tracking system,
and the second part discusses the correlation between quantified nursing workload and patient
clinical conditions.
Facial detection, color detection, infrared detection, and local position measurement (LPM)
are the 4 possible approaches to continuously track nurse bedside interventions. These 4
approaches are evaluated, and infrared detection was the optimal non-invasive approach that
XIV
A clinical activities tracking system (CATS) was developed to track bedside nursing
interventions continuously. The CATS hardware contains a Microsoft Kinect with image and
infrared depth sensors, controlled by a portable laptop. The CATS software was designed
under Microsoft Express C++ environment, implementing OpenNI and OpenCV libraries.
The Kinect sensor is placed onto the ceiling to monitor a defined detection area. When an
object enters the detection area, it is converted into an unidentifiable unrecognizable blob to
protect privacy, and its location over time is recorded.
CATS was tested in an experimental environment using two metrics, distance and dwell time
to quantify nurse-patient interaction. CATS was then implemented in the Christchurch
Hospital ICU. A trained ICU researcher performed manual observations on nursing workload
at the bedside and compared with data collected using CATS. The researcher calculated the
direct nursing intervention time for each observed hour for 30 hours. The observed direct
nursing intervention time was then compared to CATS recorded nursing intervention time. It
was found that the CATS recorded nursing intervention is highly correlated with manual
observed intervention, and thus CATS was able to record nursing intervention objectively. A
preliminary study shows that nursing intervention density is higher during the day compared
to night time.
Clinical trials include all patients admitted and allocated to a monitored bed between
04/08/2014 to 03/05/2015. 23 patients, with a total of 104 patient days, were recorded. Patient
demographics, various patient acuity assessment scores, and workload assessment scores,
including APACHE-II, APACHE-III, SAPS-II, SOFA, TISS-28, and NEMS, were calculated
XV
quantified by GCS, RASS, and sedation drug dose, were also assessed and compared with the
nursing intervention recorded by CATS.
In this study, APACHE-III and SAPS-II were found to have better resolution in describing
patient acuity compared to APACHE-II and SOFA. Both TISS-28 and NEMS display poor
sensitivity to different patient specific nursing demands because only 36% of TISS-28 score
varies from patient to patient. Equally, no significant trend was found between nursing
intervention and sedative dose or sedation level assessed by GCS or RASS. Results showed
that the nursing intervention is highly patient-specific and conventional generalised
approaches were not able to capture the specificity. CATS was able to capture specificity
automatically and objectively.
Overall, the objective nursing intervention tracking system provides an objective approach to
automatically quantify nursing intervention. This system is validated in clinical trials,
indicating its high accuracy and robustness. Nursing intervention captured by CATS shows
that during the day nursing intensity is higher than at night time. In addition, none of patient
sedation level, acuity level, TISS-28, NEMS, age, length of stay, admission type, or
intubation condition shows a strong clinical correlation with nursing time. The difficulty of
quantifying nursing intervention using conventional scores revealed a need for an objective
system to evaluate nursing workload. At this stage, it is almost impossible to link nursing
invention assessed directly by CATS to any existing assessment system based on tasks,
patient severity or similar clinical data. As a result, CATS has the potential to standardise
nursing workload quantification objectively, and is much less invasive and labor intensive
XVI
Abbreviations
ABL: Arterial blood line
AIDS: Acquired immunodeficiency syndrome
ANZICS: Australian and New Zealand Intensive Care Society
APACHE: Acute physiology and chronic health evaluation
APE: Absolute percentage error
API: Application Programming Interface
APS: Acute physiology score
Atime: Actual manually observed
B-NMDS: Belgian nursing minimum data set
BP: Blood pressure
BS: Base-stations
BUN: Blood urea nitrogen
CABG: Coronary artery bypass graft
CATS: Clinical activity tracking system
CDF: Cumulative distribution function
CDHB: Canterbury District Health Board
CI: Confidence interval
CPR: Cardiopulmonary resuscitation
CT: Computed tomography
Ctime: CATS recorded activity time
CV: Computer vision
CVL: Central venous line
CVP: Central venous pressure
ESICM: European Society of Intensive Care Medicine
XVII GCS: Glasgow coma score
GICU: General ICU
GIRTI: Italian multicenter group of ICU research
GPS: Global positioning system
Hb: Hæmoglobin
HCO3: Bicarbonate
Hct: Hematocrit
HDEC: Health and Disability Ethics Committees
ICP: Intracranial pressure
ICU: Intensive care unit
IF: Infrared
IQP: Inter-quartile range
IV: Intravenous
K: Potassium
LOC: Level of care
LOS: Length of stay
LPM: Local position measurement
MAP: Mean arterial pressure
MBP: Mean blood pressure
MICU: Medical ICU
mmHg: Millimetres of mercury
mmol/L: Millimole per litre
MT: Measurement Transponder
Na: Sodium
NAS: Nursing activity score
NEMS: Nine equivalents of nursing manpower
XVIII OpenNI: Open natural interaction
OPS: Oulu patient classification
PaO2: Arterial oxygen tension
pCO2: Partial pressure of carbon dioxide.
PDMS: Patient data management system
PEEP: Positive end-expiratory pressure
pH: Potential of hydrogen
PICC: Peripherally inserted central catheter
PRN: Project research of nursing
RASS: Richmond agitation-sedation scale
RF: Radio frequency
RFID: Radio frequency identification
RN: Registered nurse
RT: reference transponder
SAPS: Simplified acute physiology score
SDK: Software development kit
SOFA: Sequential organ failure assessment
TISS: Therapeutic intervention scoring system
TOSS: Time oriented score system
UHF: Ultra high frequency
µmol/L: Micromole per litre
UWB: Ultra-wide band
WBC: White blood count
Wh: Width of human head
WLAN: Wireless Local Area Network
Page | 1
Chapter 1 Introduction
The roles of nurses in the Intensive Care Unit (ICU) are of the same importance as medical
tasks, and complementary to them. The medical responsibilities of doctors and specialists
mainly comprise the diagnosis and treatment decisions necessary to preserve life and treat the
patient’s condition. In contrast, nurses develop the plan of care, working collaboratively with
physicians, therapists, the patient, the patient's family, and other team members. Their goals
focus on the regular care and treatment of patient illness to improve quality of life [1]. Nurses
coordinate patient care across an interdisciplinary health care team, providing both
interdependent and independent care [1].
Patients in the ICU are critically ill and are thus under constant and continuous nursing
observation. Figure 1.1 shows a typical ICU patient, and the range of therapies and sensors
used treatment and for 24-hour observation. A monitor mounted on the wall shows a patient’s
vital signs, such as blood pressure and heart rate. A mechanical ventilator provides breathing
support to patients with respiratory failure. Intravenous (IV) fluid and medicines are supplied
through a central venous catheter or other IV lines. Urine output is collected in a drainage
bag. Nasogastric and intubation tubes require regularly cleaning using suction. All of these
aspects, and more, are monitored full time and required for monitoring and/or treating
evolving patient condition.
In addition to the patient workload demand shown in Figure 1.1, a patient’s neurological
condition is checked every few hours, including eye, verbal and motor response. Patient
blood gases are also collected in every few hours. Dialysis machine, X-ray computed
Page | 2 patient condition. All these patient demands for nursing effort are considered as direct
nursing activities that are a part of overall nursing workload.
Nurses also carryout activities indirectly related to patient care, such as administration,
communication with doctors and physiologists, consultation with a patient’s family, training,
researching, and recording notes. These ‘softer’ activities comprise a significant proportion of
time during a typical working day. Both direct and indirect nursing activities make up the
entire nursing intervention time, where direct activities may vary with patient condition and
[image:22.595.94.503.348.679.2]its evolution [2].
Page | 3 1.1 Nursing workload, ICU operating cost and patient outcome
Nursing is complex and involves a wide range of disciplines. It is also the main bridge
between critically ill patients and their therapy. Thus, it is important to provide adequate
nursing resources to satisfy patient demand. However, studies have shown that there is a
mismatch between planned level of care (LOC) and practice, resulting in potentially huge
losses of nursing resource, affecting patient outcome and the entire ICU [4-6]. Thus, it is
important to optimally allocate nursing workload, as it should benefit nurses, patients and
ICUs.
1. Benefit to nurses.
Nurses working in the ICU are exposed to considerable work related stress [7-9], and distress
symptoms among staff have been described as being frequent [10, 11]. Studies have also
identified high levels of burnout symptoms among ICU nurses [12-16]. In a study of nurses
from 9 countries, Aiken et al. [17] reported that 33-60% of nurses reported high levels of
burnout in 8 of the 9 counties. Many other counties have experienced similar burnout and job
dissatisfaction issues [18-20].
It has been reported that 40% of hospital nurses have burnout levels exceeding the norms for
health care workers. Job dissatisfaction among hospital nurses is four times greater than the
average for all US workers [21]. The clinical impact of burnout may involve decreased
well-being and increased sick leave among staff [22], which affects care. A high degree of
emotional exhaustion among nurses has been shown to predict lower self-rated performances
Page | 4 Burnout can be as result of too much work and/or too little time for recovery [25]. It has been
shown that in hospitals with low nurse-to-patient ratio, nurses are more likely to experience
burnout and job dissatisfaction [26]. High burnout scores are correlated with vulnerable
personality, low job satisfaction, and high degree of job stress [27, 28]. Thus, allocating
optimal nursing resources can avoid uneven workload, preventing nurse burnout and
dissatisfaction.
2. Benefit to patients
Reduced nursing staffing in hospitals led to higher mortality rates after common surgeries
[29, 30]. Research in Belgium found that the hospital mortality after cardiac surgery was
significantly lower in hospitals with higher patient to nurse staffing ratios [31]. Likewise,
data from a Swiss and North American studies suggested significant increased surgical
mortality was associated with inadequate nursing staffing [32, 33]. In short, when patients
receive adequate nursing care, there is less chance of developing infections and surgical
complications, thus reducing LOS and mortality.
Research has also shown that adequate nursing care levels can improve ICU patient care. It
was found that adding one patient per nurse was associated with a 7 % increase in the risk of
death in the 30 days after admission, and a 7% increase in the risk of death by complications
[34]. Increased staffing ratio was also associated with reduced deaths, LOS and surgical
complications [35]. Some investigations have shown an inverse and statistically significant
relationship between the percentage of nursing hours recorded and the development of
pressure ulcers, urinary tract infection and postoperative infection [36], as well as between
nursing hours recorded and medication errors, pressure ulcers, death and patient complaints,
Page | 5 3. Benefit to the ICU.
The ICU represents the largest clinical cost centre in a hospital, with expenses estimated
reach up to 20% of the hospital’s budget [39-43]. For each patient in the ICU, their costs
cover nursing, disposables, drugs, enteral nutrition, parenteral nutrition, beds hiring,
haemofiltration, blood products, linen, physiotherapy, pathology and microbiology tests, and
radiology investigations [44]. However, nursing staff represent the single largest fixed cost in
the ICU (> 50%) [45]. Internationally, costs for personnel make up 30-69% of the total cost
per patient [46-56]. Hence, getting staffing levels right is important clinically and
economically, where today’s demographic trends are increasing the tension between cost and
quality of care.
The total cost per ICU patient also highly depends on the severity of illness and the length of
ICU stay [57-60]. On study showed that a nurse staffing model with a higher number of
registered nurses (RNs) led to an increase in the health personnel cost per patient day [61].
However, a greater number of RNs was also associated with improved patient safety and
efficiency, thereby reducing patient length of stay and the costs of care in the long term [61].
Researchers have found that increasing the number of hours provided by RNs reduced
mortality and yielded cost savings resulting from a reduced length of stay [62-64]. Therefore,
inadequate nursing resources can lead to extended LOS, and increased infections,
complications, need for mechanical ventilation, diagnostic procedures, invasive monitoring,
and amount of drugs and blood products. These increases thus lead to an increase in daily
cost per patient [65-69]. Additionally, considering fluctuations nursing workload over time, it
Page | 6 could cause more harm to patient recovery and extend patient LOS, which would increase
ICU cost. Hence, it may be more reasonable in the long run to be slightly over-staffed than to
have inadequate numbers of nurses.
The basic observed relation between nursing workload, patient outcome, and ICU cost in
these studies is shown in Figure 1.2, where nurse-to-patient ratio is the main parameter. An
optimized nurse-to-patient ratio could reduce patient mortality, increase nurse job
satisfaction, and reduce ICU cost, since ICU cost is significantly determined by patient LOS
and the number of nurses. Nurses with higher job satisfaction are also less likely to make
clinical errors [71], which could also further reduce patient mortality and LOS.
Figure 1.2: Correlation between nursing workload, patient mortality, nurse job satisfaction, ICU cost, and nurse-to-patient ratio.
1.2 Nurse workload is difficult to quantify.
Quantifying nursing workload could lead to generating an optimal nurse-to-patient ratio. It
would thus be possible to allocate the right amount of nursing manpower to individual
patients, benefiting patients, nurses, and the ICU. However, nurse workload is difficult to
Page | 7 1. Workload is difficult to conceptualized [73, 74].
Lysaght et al. [75] stated that workload can be defined as ‘the relative capacity of respond’.
Backs et al. [76] stated that workload is a construct used to describe the extent to which an
operator has engaged the cognitive and physical resources required for a task performance.
Weinger et al. [77] stated that workload is a multidimensional and complex construct, that is
affected by external task demands, environmental, organizational and psychological factors,
and perceptive and cognitive abilities. All three statements show that workload is a difficult
concept to define. In addition, factors, such as environmental, organizational, and
psychological factors also play a role in defining nursing workload.
2. Nursing is multi-task work.
Researchers have categorised nursing activities [2, 78-80]. In particular, most nursing
activities can be divided as ‘directly related to patient’ and ‘indirectly related to patient’.
These ‘directly related to patient activities’, or direct interventions, refer to nursing work that
can directly affect patient recovery and mortality. These activities are summarised and listed
in Table 1.1 [2]. The ‘indirectly related to patient activities’, or indirect interventions, refer to
nursing work that is not directly related to patient recovery, but supports nursing procedures
and patient care. These indirect interventions are summarized in Table 1.2.
Nursing is clearly a multi-task form of work that requires the nurse to perform multiple
activities simultaneously. For example, when a nurse checks body temperature, he/she may
also be engaged with drug delivery. This complexity inherently makes quantifying nursing
Page | 8 Table 1.1: Nursing work direct related to patient
1 Standard
monitoring
Hourly vital signs; Electrocardiographic monitoring; Routine 24-hour fluid balanced and hourly neurologic checks.
2 Laboratory Arterial blood gases and biochemistry studies.
3 Medication Intravenous antibiotics; Parenteral chemotherapy; Intravenous medication; Potassium infusion; Acute digitalization; Anticoagulation; Vasoactive drugs.
4 Routine dressings Dressing changes and extensive wound treatments. 5 Ventilation,
supplementary ventilator care, and airway care
Controlled ventilation with or without positive end-expiratory pressure (PEEP); Supplemental oxygen; Spontaneous respiration via endotracheal tube; Care of artificial airways; Suctions.
6 Fluid replacement Frequent infusions of blood; Replacement of excessive fluid loss.
7 Dialytic
techniques
Check dialysis machine; Change dialysis machine parameter; Cleaning machine.
8 Single or multiple interventions in and out ICU
Pacemaker; Nasotracheal or orotracheal intubation; Emergency endoscopy or bronchoscopy; Cardioversion; Lavage of acute gastrointestinal bleeding.
9 Patient support Helping the patient to understand and accept his/her clinical condition. 10 Patient
communication
Communication with the patient; Informing, Observation and maintenance of the psychic condition; Taking measures to maintain or improve the capacity of communication.
11 Safety Hourly vital signs; Electrocardiographic monitoring; Routine 24-hour fluid
balanced and hourly neurologic checks.
12 Comfort Arterial blood gases and biochemistry studies.
13 Lifting Intravenous antibiotics; Parenteral chemotherapy; Intravenous medication; potassium infusion; Acute digitalization; Anticoagulation; Vasoactive drugs.
14 Assisting Dressing changes and extensive wound treatments.
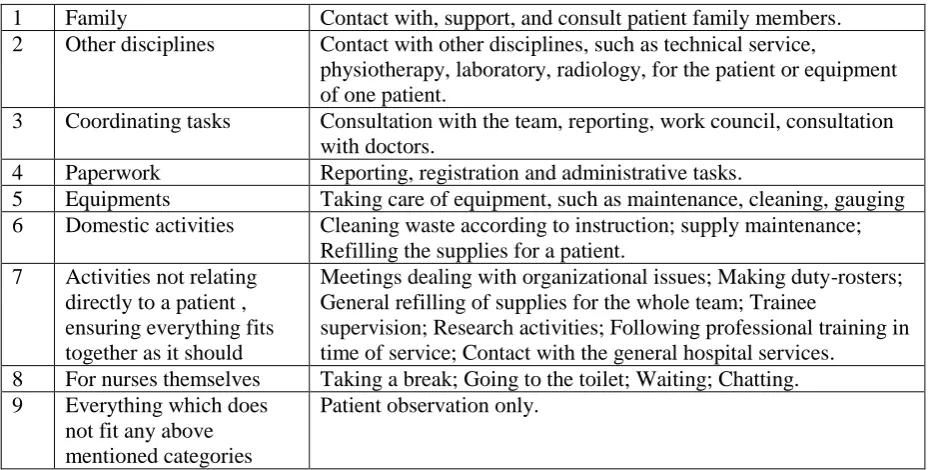
Table 1.2: Nursing work indirect related to patient
1 Family Contact with, support, and consult patient family members.
2 Other disciplines Contact with other disciplines, such as technical service,
physiotherapy, laboratory, radiology, for the patient or equipment of one patient.
3 Coordinating tasks Consultation with the team, reporting, work council, consultation with doctors.
4 Paperwork Reporting, registration and administrative tasks.
5 Equipments Taking care of equipment, such as maintenance, cleaning, gauging
6 Domestic activities Cleaning waste according to instruction; supply maintenance; Refilling the supplies for a patient.
7 Activities not relating directly to a patient , ensuring everything fits together as it should
Meetings dealing with organizational issues; Making duty-rosters; General refilling of supplies for the whole team; Trainee
supervision; Research activities; Following professional training in time of service; Contact with the general hospital services.
8 For nurses themselves Taking a break; Going to the toilet; Waiting; Chatting.
9 Everything which does
not fit any above mentioned categories
Page | 9 3. Many possible factors could affect nursing workload.
Nursing involves many aspects including interaction with patients, other disciplines, and
equipment. In particular, indirect nursing work is similar from patient to patient, and
consumes a smaller portion of all nursing care [2]. Thus, the purpose of this research is to
find the correlation between nursing workload and patient oriented factors, generating a
guideline to help allocate optimized nursing resources to specific patients.
1.3 Current workload assessment tools
Quantifying nursing workload and the optimal allocation of nursing resource in the ICU can
benefit patients, benefit nurses, and benefit the ICU. Several studies were carried out and
tools were developed in the last few decades to quantify nursing workload. Their goal was to
better allocate nursing resources, and better understand what contribute to nursing workload.
The therapeutic intervention scoring system (TISS) was created in 1974 [81], and updated in
1983 [82]. It was designed to evaluate patient severity. The project research of nursing (PRN)
score was elaborated during 1980-87, and was designed to assess nursing workload [83].
OMEGA [84] was developed in 1986, and describes 86 therapeutic interventions, grouped in
3 categories, measured at the end of ICU stay, thus representing a measure of global
workload and use of resources.
The time oriented score system (TOSS) [79] was created in 1991 and represents a direct
temporal evaluation of nursing workload. EURICU-1 [85] aims to categorize patient into 4
groups, and each patient category is assigned a correlated nurse-to-patient ratio. TISS-28 [2]
Page | 10 nurse can deliver work equal to 46 points per 8-hour shift, which transfers each TISS-28
point to 10.6 minutes of each 8-hour shift. Nine equivalents of nursing manpower (NEMS)
[86] further simplified TISS-28 to 9 equivalent therapeutic interventions, where each nurse
can deliver 45-50 points per day. Both TISS-28 and NEMS are patient oriented score
systems, evaluating nursing workload based on patient potential demands and relative
severity level. The nursing activity score (NAS) [78] is derived from TISS-28, and added 5
new items that are more nurse oriented, aiming to describe nursing activities not necessarily
correlated to severity of illness. It captures 81% of nursing time, while TISS-28 only captures
46% of nursing time. However, these 5 new added items are not accessible from patient daily
24-hour charts, and requires subjective nurse survey feedback during each shift, which is
subject to variability and thus not possible in real-time.
These current nursing workload assessment tools can gather information explaining the
intensity of nursing work. However, they are subjective, requiring nurses or researchers to
collect nursing information hourly or daily. Thus, there is a need to develop an automatic
system that can objectively collect nursing work information.
1.4 The possibility of automatic system to quantify nursing workload
In a recent study, Adomat et at. [87] used a video camera to record nurse activity in ICU.
They provide a novel method to classify patient-nurse interaction. However, this technique
remains subjective, requires experienced nurses to classify the nursing activity and behaviour,
and thus demands significant manual labour that is not available. In addition, it may involve
ethical issues on patient and nurse privacy. Thus, there is clear need of an automated system
that can measure activity non-invasively and preserving patient and nurse privacy to
Page | 11 Thanks to the development of tracking technology and computer vision, continuously
tracking is possible to be applied for observing nurse work in ICU. Global positioning system
(GPS) and local position measurement (LPM) are two commonly known positioning systems
being widely used in navigation and workload tracking [88, 89]. GPS and LPM use a tracking
device to send signals of the current location of the device to a satellite or base station to
point the current location [90]. LPM is more widely used in industrial tracking applications
and indoor tracking usage [91]. In addition, the following technologies all have been used in
tracking and positioning: 1) Radio frequency identification (RFID) [92]; 2) Cellular-Based,
which is widely used for indoor mapping and localization applications [93]; 3) Ultra-wide
band (UWB) technology [94]; 4) Wireless Local Area Network (WLAN) [95]; 5) Bluetooth,
which can be applied for indoor positioning situations too [96]; 6) Ultra high frequency
(UHF) technology [97, 98]; 7) Infrared (IF) detection [99]; and 8) Computer vision (CV)
[100]. These systems have shown the basic potential to quantify nursing workload in an
automated fashion.
1.5 Research objectives
In this research, the first part focuses on the development of a novel automatic system that
can objectively quantify nursing workload. This new system offers the ability to continuously
collect nursing workload in the ICU or any similar acute bed space. In particular, it includes
system hardware and software developments, system simulation in an experimental
environment, system set up in the clinical environment, and system validation in clinical
Page | 12 The second part focuses on its clinical application. It generates a novel approach to analyze
what specific clinical or patient factors could possibly impact the intensity of nursing work.
In particular, it explains the procedure of patient data collection and current patient severity
assessment tools. It then compares nursing workload with these patient clinical indicators,
such as their illness acuity, age, gender, LOS, and diagnostic code.
1.6 Structure of thesis
This thesis is separated into two main parts. The first part, Chapters 2 to 6, discusses the
development of this novel automatic system, the clinical activity tracking system (CATS). It
also includes system laboratory simulation, installation in the ICU, and system validation in
clinical trials. The second part includes Chapters 7 to 10, which discuss data from 10 months
of clinical data collection using CATS and analysis in the Christchurch Hospital ICU.
Correlation between nursing workload and patient clinical data are studied. The structure of
thesis is presented as follows:
Chapter 1: Introduction. This chapter presents the background knowledge, research objectives
and the structure of this thesis.
Chapter 2: Comparison of Different Tracking Systems to Apply in Intensive Care Unit. This
chapter focuses on evaluating 4 possible methodologies to automate nursing workload
quantification and selects the optimal methodology for further development.
Chapter 3: Design and Development of Clinical Activity Tracking System (CATS). This
chapter further discusses the development of the clinical activity tracking system (CATS),
Page | 13 Chapter 4: CATS Performance in an Experimental Environment. This chapter presents the
test of system reliability and consistency in a simulation environment. Specific tests were
designed for the CATS system testing. Results showed that the CATS can be used in a
clinical environment for nursing workload quantification.
Chapter 5: CATS Setup in Clinical Situation and Its Performance after Data Post-Processing.
This chapter presents CATS setup for clinical application in the Christchurch Hospital.
Different filtering algorithms were developed to reduce noise. It shows that the algorithms
were able to reduce noise signals that are not relevant to nursing interventions.
Chapter 6: Validation and Preliminary Results. This chapter validates CATS ability to
quantify bedside workload. The workload quantified by CATS is validated with manual
clinical observation. A preliminary study for the first 30 days and 60 days of nursing
intervention distribution is also presented.
Chapter 7: Comparison of different clinical scoring systems and relative results. This chapter
presents the different patient severity assessment tools and nursing workload assessment
tools, TISS-28, NEMS, APACHE-III, SAPS-II, APACHE-II, and SOFA. These scores were
generated from patients included in the CATS study. Results showed that it is possible to use
patient severity scores to predict nursing requirement and corresponding nurse-to-patient
ratio.
Chapter 8: Correlation between CATS calculated nursing intervention and patient sedative
Page | 14 indicating the different sedative level during daytime and night time. In addition, it compares
nursing workload with different sedative scores and different sedative drugs, testing patient
nursing demands based on sedative conditions.
Chapter 9: Correlation between CATS calculated nursing intervention and different patient
clinical conditions. In this chapter, nursing workload is compared with different factors that
could affect patient nursing demands, including time of a day, patient severity scores,
TISS-28, NEMS, patient age, gender, type of admission, intubation condition, and FiO2 level.
Chapter 10: Patient specific study and recommended nurse-to-patient ratio. In this chapter, 6
patients are selected to analyse variation of nursing demand, and possible factors influencing
patient nursing demands are tested. In addition, a recommendation is made for
nurse-to-patient ratio based on different time of the day and different nurse-to-patient illness severity levels.
Chapter 11: Conclusions, limitations and Future work. This chapter summarizes all the
conclusion of previous chapter, points the limitations of system application, and lists future
Page | 15
Chapter 2 Comparison of Possible Tracking
Systems to Apply in Intensive Care Unit
Quantify nursing interventions and workload near the patient bedside area in the Intensive
Care Unit (ICU) is a very challenging task. Traditional scoring systems have been developed
to assess nursing intensity, such as the therapeutic intervention score system-28 (TISS-28) [2,
81, 82, 101, 102] and nurse activities score (NAS) [70, 78, 80, 103, 104]. Each TISS-28 point
is theoretically equivalent to 10.6 minutes of nursing work in an 8-hour shift, and each NAS
point corresponds to 14.4 minutes nursing work in a 24-hour shift [102]. However, both
scoring systems require experienced researchers or nurses to complete specific form every 24
hours to account for changing patient condition. They are thus subject to variability and may
not be able to capture specific trends. Finally, they have not changed in many years, and thus
may not be as relevant or calibrated to the modern ICU environment. In addition, their
applicability across different clinical practice may also be questioned. Hence, an automatic
system that can objectively quantify nursing activity or workload in site is required.
To develop an automatic nursing workload detection system at the patient bedside, there are a
few important issues that need to be considered and addressed. For example, the system,
while capable of calculating the nursing workload automatically, must also protect both
patient and nurse privacy [105-109]. In addition, the system should be robust and relatively
noise free, separating what could be true workload from other inputs or forms of noise.
Another requirement is that the system should be minimally obstructive or invasive of current
Page | 16 system must not only fulfil the ability to automate calculation of activity and workload, but
also consider other factors revolving around the project.
In this chapter, several potential approaches to continuously track nurse movement are
presented and compared. These proposed approaches are reviewed and ranked based on the
overall requirements enunciated. The system that ranked highest in the specific-scoring is
further investigated and developed into the clinical activity tracking system (CATS) that is
used in this research.
2.1 Introduction
Currently, there is no standard, automated method to consistently quantify patient and
bedside nurse interaction. Adomat et al. used a video camera to record ICU nursing activity
[87] and concluded that existing nurse-to-patient ratio classification methods are
inappropriate. This video recording method does provide a general outline to optimize
nurse-to-patient ratio. However, it is laborious, and subject to variability as it required experienced
nurses to classify the recorded nursing activity and behaviour manually. Thus, there is a need
for a clinically feasible approach to automatically record nursing movement around the
bedspace, to enable analysis of the correlation between nursing activity and patient outcome.
Object positioning and tracking have been widely used in other research fields, such as
human ergonomics and workspace management related studies [112-114]. Global Positioning
System (GPS) and Local Position Measurement (LPM) are the most commonly known
positioning systems being widely used in navigation and tracking [115-119]. GPS uses a
tracking device to send signals of the current location of the device to a satellite to pin point
Page | 17 widely used in industrial tracking applications and indoor tracking usage, which is often
required to know the position of a target within a locally restricted area [120-125]. However,
all these systems require the nurse or other users to wear a tracking device, which can be
invasive of privacy outside the bedspace.
According to the technology being used, positioning and tracking systems include the
following categories: 1) Radio frequency identification (RFID), for example, SpotON,
LANDMARC and RADAR are well-designed indoor location sensing systems based on RF
signal technology [126-130]; 2) Cellular-Based systems, which are widely used for indoor
mapping and localization applications [93, 131]; 3) Ultra-wide band (UWB) technology,
which is used for precision localization applications for tracking high valued asset in hospital
and factories [132-134]; 4) Wireless Local Area Network (WLAN), which is utilized in
location determination and estimation [135-140]; 5) Bluetooth applied for indoor positioning
situations [141-144]; 6) Ultra high frequency (UHF) technology that is also used for finding
indoor objects [145, 146]; 7) Infrared (IF) detection, which can be used for specific target
detection and fire detection [99, 147-149]; and 8) Computer vision (CV), which is widely
used in facial reorganization, traffic optimization, color filtering and skeleton detection along
with a wide range of security applications [100, 150-154]. All these positioning and tracking
technologies have their unique usage in all sorts of different situations. Several, but not all,
require the end users (nurses) to wear a tracking sensor of some form.
2.2 Requirements for the tracking system
In this study, the detection area focuses on patient bedside and does not extend beyond that
area. An example of the ICU patient bedside layout is shown in Figure 2.1. This area of
Page | 18 place. Such clinical nursing activities include cleaning patient wounds, daily cleaning,
administration of intra-venous drugs or fluids, managing mechanical ventilation, and
observing and recording vital signs.
Figure 2.1: Left: Layout of one unit in ICU; Right: a typical Christchurch ICU unit.
Thus, potential or proposed automated activity monitoring systems are required to
fulfil several criteria:
1) Accuracy: The ability to accurately detect clinical staff, especially when there is
noise or other objects.
2) Continuity: The ability of the system to continuously track the candidates. This criterion is important, as clinical activities at the bedside are not necessarily routine
and can be quite variable in activity and intensity depending on patient condition.
3) Multiple tracking: The ability to track multiple people or activities from two or more
people in the area of interest. Clinical activities that are labor intense require more
clinical staff.
4) Covered area: The amount of detection area the can be covered by the system.
Larger areas with higher resolution are preferable, although still limited to the
Page | 19 5) Positioning: Positioning is an important feature, where the location of each tracked
activity may provide information of the detail clinical activity. Higher accuracy of
position detection will be given a higher score, as it will allow greater precision in
grading the clinical intensity of monitored activity.
6) Privacy: One important criterion to evaluate is whether the system needs to gather a nurse’s personal information or position via a sensor on the nurse. A system that
protects the nurses working environment privacy will thus have a higher score.
7) Potential cost: This criterion evaluated the cost involved based on the equipment required per bed and a lower cost will have a higher score.
The proposed systems are scored using a decision making based Weighting and Scoring
Method [155].
2.3 Different tracking system designs
In this research, 4 detection methods were evaluated, of which 3 use a video recording and 1
requires the nurse to wear a signal transmitting device. The methods using any form of video
camera are: 1) Facial detection; 2) Uniform/color detection; 3) A novel tracking system used
Kinect. The method with signal transmitting device is 4) Local Position Measurement (LPM).
The principle of each method is introduced and the advantages and disadvantages of each
method are compared and checked against the requirements stated.
2.3.1 Facial detection
The application of facial detection and facial recognition is widely used for biometric
identification, video conferencing, indexing of image and video databases, security systems,
Page | 20 patterns have been developed to efficiently recognize, categorize, and track a human face
[160-164]. Using a video camera and a detection algorithm, a human face can be recognized
based on several features, such as eyes balls, skin color, and face shape. In this particular
application, a facial detection method was implemented in C++, where the procedure is
explained in detail in Appendix 2.1.
Facial recognition can accurately monitor nurses when they are in range of the monitoring
and facing the camera. However, these methods require partial or full facial features for
detection. In reality, facial features are not always present at the ICU bedside. For example,
the nurses may be facing away from the camera while performing clinical activities. Thus,
this method is significantly limited to the distinct facial features. It also poses privacy and
compliance risks as specific nurses are identified.
2.3.2 Color detection
There are many applications using color detection techniques in computer vision, such as skin
color detection, traffic light detection, and flame detection [165-169]. The combination of
color detection and other algorithms is widely used in other applications, such as herbaceous
crop detection, detecting groups of people, and human gesture detection [150, 154, 170-172].
In this application, nursing staff in ICU would have to wear distinct colored uniforms. Thus,
color detection can be applied to track nursing activity without specific individual detection.
In this application, the system implements ‘OpenCV’ [100, 173] and ‘OpenCVBlobsLib’
libraries [174] for image processing. System detected nurse uniform color (blue) can be
highlighted in a ‘Black&White’ image to protect nurse privacy. Tracking this color cluster, as
shown in Figure 2.2, enables tracking of nurse activity. This procedure is demonstrated in
![Figure 1.1: A typical intensive care unit patient. [3]](https://thumb-us.123doks.com/thumbv2/123dok_us/9931903.495206/22.595.94.503.348.679/figure-a-typical-intensive-care-unit-patient.webp)