Hate crime report
CONTENTS
Contents
Executive Summary 3
Introduction 5
Hate crime: key findings 7
Racist and religious hate crime 16
Racist and religious hate crime: key findings 18
Homophobic and transphobic hate crime 26
Homophobic and transphobic hate crime: key findings 27
Disability hate crime 35
Disability hate crime: key findings 36
Annex 1: Prosecutions by Area 45
EXECUTIVE SUMMARY
Executive summary
This is the first Crown Prosecution Service (CPS) Annual Hate Crime Report, and brings together information on CPS performance in prosecuting racist and religious hate crime, transphobic and homophobic crime, disability incidents and domestic violence. Until this year, CPS included domestic violence within its hate crime measure, but now groups these offences within the separate violence against women measure. A full analysis of CPS performance in relation to domestic violence is included in the 2007-08 Violence Against Women Report.
Hate crime – overall key findings
• In the three years ending March 2008, over 200,000 defendants were prosecuted for hate crimes.
• During this period, the conviction rate rose from 62% in 2005-6 to 71% in 2007-08.
• Guilty pleas increased from 59% to 63%.
• The target to reduce unsuccessful outcomes to 28% by the fourth quarter of the year was exceeded at 27.6%.
• The proportion of cases failing due to issues such as victim retraction, and cases where the victims fails to attend a court hearing remained stable at 55% of all unsuccessful outcomes. However while victim issues are particularly relevant to domestic violence cases, other reasons for failure such as acquittals after trial are more common for other hate crime strands.
• The vast majority of hate crime defendants across the strands were men.
• While the data on victim demographics is less reliable and still under development, there are significant differences in gender across the strands. In domestic violence cases, victims are overwhelmingly women (86%), whereas women were victims in 38-48% of cases in other hate crime strands.
• Offences against the person were the most commonly prosecuted offences in domestic violence (around 72%). Offences in racist and religious and homophobic cases were split between offences against the person and public order offences. Disability incident cases also involved more offences against the person as well as thefts and handling offences.
• In 78% of hate crime defendants were identified as belonging to the White British Category, and 81% were categorized as White.
Racist and religious crime – key findings
• In the three years ending March 2008, over 33,000 defendants were prosecuted for crimes involving racial or religious aggravation.
• Convictions rose from 74% in 2005-6 to 80% in 2007-08.
• Guilty pleas increased from 64% to just under 67%.
• In the final quarter of 2007-08, the CPS target to reduce unsuccessful prosecutions to 20% was exceeded at 19.7%.
Homophobic and transphobic crime – key findings
• In the three years ending in March 2008, over 2,400 defendants were prosecuted for homophobic or transphobic crimes.
• In this period, convictions rose from 71% to 78% in 2007-08.
• Guilty pleas increased from 58% to 67%.
• The 2007-08 target was to reduce unsuccessful outcomes to 20%. Outcomes were outside the target at 22.6% by the fourth quarter.
• Acquittals and essential legal element missing accounted for the majority of unsuccessful outcomes
• While the number of unsuccessful outcomes due to victim difficulties increased from 06-07 to 07-08, they fell slightly in proportional terms, from 5% to less than 4%.
• The majority of defendants were men (87%).
• Offences against the person were the most common offences.
• In 2007-08 76% of defendants were identified as belonging to the White British category.
Disability hate crime – key findings
• 2007-08 is the first year that performance information on disability incidents has been captured.
• In the year ending March 2008, 183 defendants were prosecuted for disability incidents.
• In 2007-08, 77% of cases resulted in a conviction.
• In 2007-08, the guilty plea rate was 72%.
• Acquittals accounted for more unsuccessful outcomes than victim issues, similar to racist and religious incidents and homophobic and transphobic crimes. 82% of defendants prosecuted were men.
• Offences against the person were the most common offences. Burglary, theft and handling were also common.
• In 2007-08, 83% of defendants were identified as belonging to the White British category.
Domestic violence – key findings
• In the three years ending in March 2008, over 170,000 defendants were prosecuted for domestic violence;
• 94% of defendants were men in 2007-08 (only 1% less than in 2006-07);
• 86% of victims were women in 2007-08 (only 1% more than in 2006-07);
• the number of DV cases charged1increased from 62% in 2006-07 to 65% in 2007-08; • unsuccessful prosecutions fell from 40% in 2005-06 to 31% in 2007-08;
• guilty pleas increased from 58% in 2006-07 to 62% in 2007-08;
• unsuccessful outcomes due to victim issues accounted for 17% of all domestic violenceoutcomes in
INTRODUCTION
Introduction
Hate crimes recording on CPS for 2007-08 included racist and religious hate crimes, homophobic and transphobic crimes, disability incidents and domestic violence. Safety and security, and the right to live free from the fear of crime, are fundamental human rights and go to the core of people’s priorities. Feeling and being unsafe have a significant impact on people’s health and sense of wellbeing and can leave them isolated and unable to participate socially and economically in their communities. We want victims of hate crime, their families, communities and the general public, to be confident that the CPS understands the serious nature of crimes against them.
Part of this reassurance comes from being transparent about our performance in prosecuting hate crime. Until this year, the Crown Prosecution Service has reported its performance on domestic violence, racist and religious hate crime and homophobic and transphobic hate crime in a number of ways. Data on racist offences was published in the Racist Incidents Monitoring Scheme report for seven years and, more recently, included data on religious offences.2Domestic violence performance has been published in the form of
yearly ‘snap shots’ of a month’s domestic violence data, and in 2007 CPS released information about performance on prosecuting homophobic and transphobic hate crime in the form of a press release. This report brings together information on CPS performance in prosecuting all hate crime strands. Where possible, 2007-08 performance in prosecuting racist and religious hate crime and homophobic and transphobic crime is compared with performance during 2006-07. Disability hate crime is included for the first time, based on performance information for the year 2007-08 alone.
The Violence Against Women Strategy, published in April 2008, provides the framework to effectively coordinate CPS policy and performance on domestic violence and other violence against women offences, and moves the measurement of performance in prosecuting domestic violence into the new Violence Against Women indicator. In order to begin our annual reporting in line with this strategy, and to avoid the duplication of information in reports, a full analysis of information on domestic violence can be found in the CPS Violence Against Women report, published alongside the present report.
Hate Crime – the wider government context
The government recognises that serious violence can be a major cause and consequence of inequality; hate crime in particular has a disproportionate impact on women3and minority groups.4Our focus on improving
hate crime performance, monitoring and reporting ensures that the CPS is playing its part in achieving Public Service Agreement 23 – Make communities safer.
We know that hate crime cases suffer higher levels of attrition due to victim and witness difficulties. This is why all of our public policy statements clearly set out how we go about supporting victims and witnesses in hate crime cases. We have also worked to strengthen our community engagement processes and activities. We have set up hate crime scrutiny panels which look at how the CPS dealt with recent cases of hate crimes. We will use the panels to inform how we improve prosecution outcomes and our handling of cases generally. The Hate Crime Scrutiny Panels include the CPS, community stakeholders, and an independent facilitator. The community stakeholders are drawn from community groups which have direct experience of hate crime. The panels are an important testament to our commitment to be transparent in our decision making. They consider what went well and not so well, and, if there are any lessons to be learned for the future. We have also established Community involvement panels. They are on a more regional basis and have a more general focus on CPS business, performance and strategy. We very much see the Community Involvement Panels having an important role in monitoring and improving CPS performance.
Race for Justice
CPS contributes to the delivery of Race for Justice (RFJ), the Attorney General’s Hate Crime Strategy which has the support of the Home Secretary and the Secretary of State for Justice. A number of work streams are in place, including the development of occupational standards for practitioners working in the field of hate crime, introducing an online reporting facility of hate crime, work with the equal treatment committee at the Judicial Studies Board and work with other government departments to raise awareness of and improve the recording of hate incidents in schools and the local community. A delivery board made up of officials from across the CJS and an advisory group made up of representatives from victim support organisations oversee the implementation of the recommendations.
Hate crime – the CPS context
The CPS views the effective prosecution of hate crimes as a high priority which directly contributes to its corporate aims: strengthening the prosecution process; championing justice and the rights of victims; and inspiring confidence in the communities we serve. The successful prosecution of hate crime is also central to achieving the goals of our Single Equality Scheme.
Performance management framework
From 2008-09 domestic violence will move out from Hate Crimes to be managed under the Violence against Women (VAW) Strategy, with a specific VAW Indicator. The VAW Indicator has an overall target of reducing unsuccessful prosecutions to 29% by April 2009; with a separate target of 28% for domestic violence and sexual offences and of 41% for rape. In 2009-2010 the domestic violence target will reduce to 26% unsuccessful outcomes.
The Hate Crime Indicator has a single target for unsuccessful outcomes of 18% applied to all current hate crime strands (racist, religious, homophobic and disability hate crimes). In 2009-10 this target will be reduced to 17% unsuccessful outcomes. In 2010-11 it will be further reduced to 16%.
HATE CRIME: KEY FINDINGS
Hate crime: key findings
Since April 2005 the Crown Prosecution Service has reported on its performance in relation to the prosecution of hate crimes as part of the CPS Area performance review process. Hate crimes comprise racially and religiously motivated crimes, homophobic and transphobic crimes, and crimes motivated by a person’s disability. Additionally, up until March 2008 offences of domestic violence were also treated as hate crimes, although with effect from April 2008 they are now reported separately as part of the Violence Against Women (VAW) strategy, with a new VAW Indicator. Performance data on hate crimes is recorded within the Compass Case Management System, and extracted from the related Compass Management Information System.
Completed prosecutions fall into two categories: convictions, consisting of guilty pleas, convictions after trial and cases proved in the absence of the defendant; and unsuccessful outcomes, comprising all other outcomes including discontinuances, administrative finalisations, discharged committals, dismissals after trial and dismissals no case to answer, judge directed acquittals and jury acquittals.
Charging
Statutory charging of defendants by CPS was fully rolled out in April 2006. In the two years following that date 158,000 cases identified as involving hate crimes were referred to the CPS for a charging decision. The table and chart below (1) show that over 100,000 of these, or 65%, were charged during the two year period.
Table 1: Pre-charge decisions*
100%
80%
60%
40%
20%
0%
Charged
Not charged
2006-07 2007-08
All defendants 2006-07 2007-08
Volume % Volume %
Charged 45,347 62.6% 57,175 66.5%
Request for further evidence 1,084 1.5% 660 0.8%
No prosecution 21,059 29.1% 22,861 26.6%
All other decisions 4,971 6.9% 5,336 6.2%
Total 72,461 86,032
*Statutory Charging was fully rolled out on 3 April 2006
Convictions
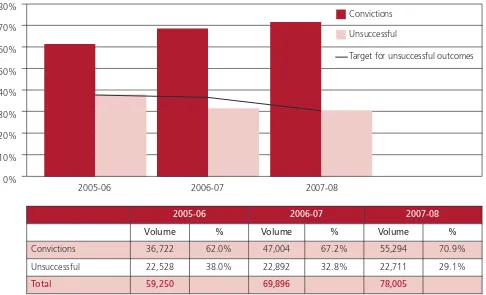
In the three years ending March 2008, over 200,000 defendants were prosecuted for hate crimes. Table and chart 2 below provide a breakdown of prosecutions over the three year period, showing that convictions rose from 62% in 2005-06 to 71% in 2007-08.
Table 2: Completed prosecutions by outcome
60% 80%
70%
50%
40%
30%
20%
10%
0%
Convictions
Unsuccessful
2005-06 2006-07 2007-08
2005-06 2006-07 2007-08
Volume % Volume % Volume %
Convictions 36,722 62.0% 47,004 67.2% 55,294 70.9%
Unsuccessful 22,528 38.0% 22,892 32.8% 22,711 29.1%
Total 59,250 69,896 78,005
[image:10.595.56.542.495.790.2]HATE CRIME: KEY FINDINGS
The table and charts below show a detailed breakdown of prosecution outcomes for hate crimes in 2006-07 and 202006-07-08. Guilty pleas increased from 59% to 63%, contributing to an improved conviction rate of 71% overall in 2007-08. Prosecutions dropped by CPS, discontinuances and cases in which no evidence was offered, fell from 26% to less than 23%.
[image:11.595.66.557.483.700.2]In 2007-08 the target was to reduce unsuccessful outcomes for hate crime to 28% by the fourth quarter of the year. This target was exceeded at 27.6% in the fourth quarter. Within the overall hate crime target each strand had a separate sub-target. For domestic violence the target was 30%, which was also exceeded in the final quarter. For all other hate crime strands the target was 20%. Performance for racially and religiously aggravated crimes exceeded this target in the final quarter at 19.7%, as did performance for disability incidents, at 16.9%. Performance for homophobic crime did not meet the target, reaching 22.6% in the final quarter.
Table 3:Prosecution outcomes
Convictions
60% 80%
70%
50%
40%
30%
20%
10%
0%
Conviction after trial
Guilty plea
2006-07 2007-08
Unsuccessful outcomes
30% 40%
35%
25%
20%
15%
10%
5%
0%
Acquitted
All other discontinuances
Offered no evidence
2006-07 2007-08
Volume % Volume %
Administrative finalisation 849 1.2% 966 1.2%
Discharged committal 220 0.3% 200 0.3%
Prosecutions droppedinc discontinued, no evidence offered & withdrawn
17,859 25.6% 17,583 22.5%
of which – no evidence offered 8,681 12.4% 9,530 12.2%
Dismissed after full trial 2,821 4.0% 2,902 3.7%
No case to answer 364 0.5% 326 0.4%
Judge directed acquittal 127 0.2% 125 0.2%
Jury acquittal 652 0.9% 609 0.8%
Unsuccessful outcomes 22,892 32.8% 22,711 29.1%
Guilty plea 41,044 58.7% 48,767 62.5%
Conviction after trial 5,785 8.3% 6,384 8.2%
Proved in absence 175 0.3% 143 0.2%
Convictions 47,004 67.2% 55,294 70.9%
Total prosecutions 69,896 78,005
Prosecution by hate crime type
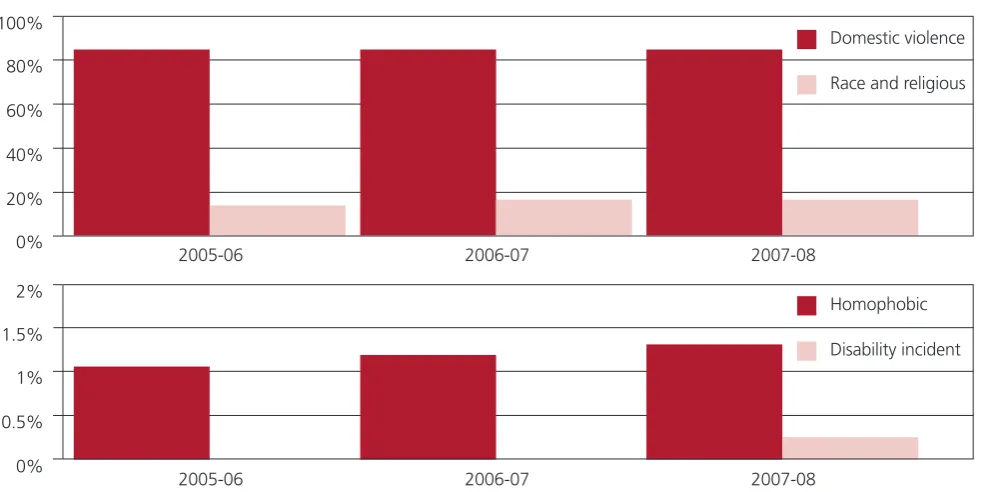
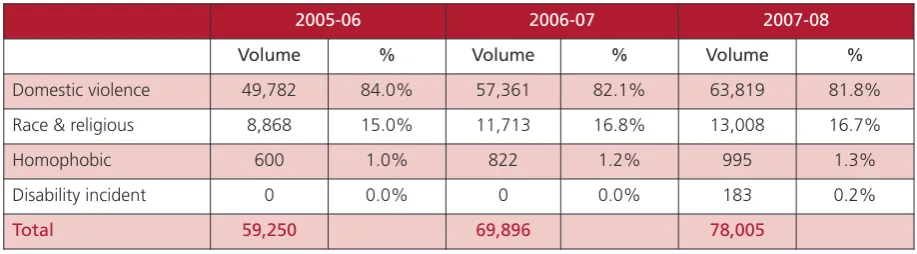
[image:12.595.51.543.480.726.2]The table and charts below (4) show prosecutions by hate crime type from 2005-06 to 2007-08. Domestic violence comprised the largest proportion of the total at 84% in 2005-6 and 82% in 2007-08. The collection of data for disability incidents commenced in April 2007.
Table 4: Completed prosecutions by hate crime type
100%
80%
60%
40%
20%
0%
Domestic violence
Race and religious
Homophobic
Disability incident 2005-06
1.5% 2%
1%
0.5%
0%
Rape
2006-07 2007-08
HATE CRIME: KEY FINDINGS
Unsuccessful prosecutions
[image:13.595.95.554.55.182.2]Cases may fail through evidential reasons, public interest reasons, because a case is unable to proceed, because proceedings are subject to an administrative finalisation, and for other reasons. The proportions falling within each category remained similar from 2005-6 to 2007-08. In 2007-08, 4.3% were unsuccessful for administrative reasons; 35.2% for evidential reasons; 7.7% for public interest; 32.9% were unable to proceed, and 20% fell into other reasons.
Table 5 gives a more refined analysis, showing the proportion failing due to victim issues (including victim retraction and cases in which a victim fails to attend a court hearing), those resulting in a bindover, and those in which the defendant was cautioned. Within these key reasons, victim retraction remained the largest single category, changing little over the period under review at 19% to 20%, while there was a gradual rise in the proportion failing owing to non attendance of the victim and in the proportion in which the evidence of victims did not support the prosecution case. The proportion failing because of key reasons remained stable, at 55% of all unsuccessful outcomes.
2005-06 2006-07 2007-08
Volume % Volume % Volume %
Domestic violence 49,782 84.0% 57,361 82.1% 63,819 81.8%
Race & religious 8,868 15.0% 11,713 16.8% 13,008 16.7%
Homophobic 600 1.0% 822 1.2% 995 1.3%
Disability incident 0 0.0% 0 0.0% 183 0.2%
Total 59,250 69,896 78,005
Table 5: Key reasons for unsuccessful prosecutions
60%
50%
40%
30%
20%
10%
0%
Bindover
Caution
Evidence of victim does not support case
Victim non-attendance
Victim retraction
[image:13.595.69.554.439.592.2]2005-06 2006-07 2007-08
Volume % Volume % Volume %
Victim retraction 4,331 19.2% 4,616 20.2% 4,387 19.3%
Victim non-attendance 1,734 7.7% 2,132 9.3% 2,670 11.8%
Evidence of victim does not
support case 2,723 12.1% 3,319 14.5% 3,597 15.8%
Caution 346 1.5% 355 1.6% 291 1.3%
Bindover 3,190 14.2% 2,111 9.2% 1,475 6.5%
Total key reasons 12,324 54.7% 12,533 54.7% 12,420 54.7%
All other reasons 9,262 41.1% 9,510 41.5% 9,325 41.1%
Administrative finalisations 942 4.2% 849 3.7% 966 4.3%
Total 22,528 22,892 22,711
[image:14.595.80.541.57.287.2]The analysis of reasons for each individual strand of hate crime is reported in the relevant section of this report. There are clear differences in key victim issues across the strands. The high volume of victim issues in relation to domestic violence affects the picture for hate crime outcomes overall. However, victim issues are a less predominant element of unsuccessful outcomes for other hate crime strands, where acquittals and essential legal element missing were responsible for more unsuccessful outcomes.
Table and chart 6 show the volume and proportion of victim issues in relation to all outcomes. While the volume of those unsuccessful due to victim difficulties increased, from 8,788 in 2005-6 to 10,654 in 2007-08, they fell slightly in proportion to total hate crime outcomes, from 15% to less than 14%. Total unsuccessful outcomes fell from 38% in 2005-6 to 29% in 2007-08.
Again, victim issues were sufficiently numerous for cases of domestic violence to weight the picture for hate crime overall. Victim issues accounted for 16.9% of domestic violence outcomes in 2005-6, falling to 15.7% in 2007-08.
Table 6: Comparison of key victim issues
Victim issues in relation to all outcomes
15.0%
14.5%
14.0%
13.5%
13.0%
12.5%
12.0%
of all hate crime cases – % unsuccessful due to victim difficulties
[image:14.595.46.539.582.728.2]HATE CRIME: KEY FINDINGS
2005-06 2006-07 2007-08
Volume % Volume % Volume %
Total unsuccessful due
to victim issues 8,788 14.8% 10,067 14.4% 10,654 13.7%
Total unsuccessful 22,528 38.0% 22,892 32.8% 22,711 29.1%
Total convictions 36,722 62.0% 47,004 67.2% 55,294 70.9%
Total prosecutions 59,250 69,896 78,005
Principal offence category
At the conclusion of proceedings, each defendant case is allocated a Principal Offence Category to indicate the type and the seriousness of the charges brought.
Offences against the person were the most numerous category, representing 67% of hate crime prosecutions in 2007-08. Criminal damage and public order accounted for a further 11% and 12% respectively. A similar pattern was recorded for men, with 68% being categorised as offences against the person, 12% as criminal damage, and 12% as public order. There was a slightly different pattern for women, offences against the person being lower at 63% and criminal damage lower at 9%, while public order was higher at 19%. Men comprised 93% of defendants whose principal offence was identified as offences against the person. In domestic violence cases, offences against the person were the most
numerous for both men and women, at 73% and 72% respectively. A similar pattern was noted in cases of disability incidents, with men and women recording 53% and 56% respectively for offences against the person; although there was also a proportion of burglary offences (9%) and theft and handling offences (8%). Offences in racial and religiously aggravated and homophobic cases were split between offences against the person (42% and 50%) and public order (42% and 34%) respectively for all defendants.
Retraction
While the facility to collect information on the issue of retraction has been in place since April 2007, the completeness and reliability of the data remains under development. Work is planned for 2009-2010 to improve data collection and quality.
Sentence uplifts
Equalities
(i) Defendants
Gender
Table 7 provides a breakdown of the gender of defendants. The proportion of men prosecuted has remained virtually the same at 93% in 2005-6 and 92% in 2007-08. In the latter period, 94% of defendants in domestic violence prosecutions were men, along with 85% in racially and religiously aggravated crimes, 87% in homophobic crimes and 82% in disability crimes.
90,000
60,000
30,000
0
Women
Men
[image:16.595.46.540.215.433.2]2005-06 2006-07 2007-08
Table 7: Completed prosecutions by gender of defendant
2005-06 2006-07 2007-08
Volume % Volume % Volume %
Women 3,903 6.6% 4,843 6.9% 5,907 7.6%
Men 55,341 93.4% 65,041 93.1% 72,084 92.4%
Unknown 6 0.0% 12 0.0% 14 0.0%
Total 59,250 69,896 78,005
Ethnicity
Ethnicity data on defendants is collected by the CPS in accordance with the agreed Criminal Justice System definitions for the 16+1 ethnic categories. In 2007-08, 78% of hate crime defendants were identified as belonging to the White British category, and 81% were categorised as White. 5% of defendants were identified as Asian, and a further 5% were identified as Black. 4% of defendants did not state an ethnicity on arrest.
Other equality data
Data on the religion or belief and disability of defendants has been collected since April 2007 and the completeness and accuracy of this data remains under development.
(ii) Victims
Gender
Table 8 provides a breakdown of the gender of victims. Data on victims is extracted from the Witness Management System, and is available only from April 2006. The completeness and accuracy of this information remains under development. Of those victims whose gender has been identified the highest proportion were women, at 77% in 2006-07 and 78% in 2007-08. Where gender has been identified, 86% of domestic violence victims were women, while 38% were women in racial and religiously
HATE CRIME: KEY FINDINGS
Table 8: Gender of victims*
40% 50% 60% 70% 80% 90% 100%
30%
20%
10%
0%
Men
2006-07 2007-08
2006-07 2007-08
Volume % Volume %
Women 7,901 26.6% 19,649 34.1%
Men 2,374 8.0% 5,580 9.7%
Unknown 19,378 65.3% 32,348 56.2%
Total 29,653 57,577
Unknown
Women
*Data from 2006-07 was reported for all victims whether civilian or not, 2007-08 data only reports civilian victims.
Other equality data
Data on victims is extracted from the Witness Management System. Data on ethnicity is available from April 2006, and data on religion or belief and disability from April 2007. The completeness and accuracy of this information remains under development and figures have not been included in the present report. Work is planned for 2009-2010 to improve data collection and quality.
Hate crime services
Racist and religious hate crime
Policy background and future work
The first editions of the CPS public policy statement on racially and religiously aggravated crime and the accompanying guidance for prosecutors were published in July 2003. Since this time there have been a number of developments in the law, and changes to CPS practices and procedures – particularly in the way in which we deal with victims and witnesses and engage with the community. The second editions,
published in March 2008 reflect these developments. The essence of the Policy and Guidance, however, remain unchanged, and it is for this reason that the second editions were ‘refreshed’ rather than completely re-written.
In preparing the second editions, we consulted with people from Black and minority ethnic communities and faith communities and we took their comments into account. Their contributions helped us to have a better understanding of the things that are important to them and that we need to know about when we deal with racist and religious crime.
A CPS research report into antisemitic crime was launched at a public event on May 2008. The purpose of the report was to respond to the The All-Party Parliamentary Group against Antisemitism report published in September 2006 which made the following two recommendations to the CPS: that the CPS investigates the reasons for the low number of prosecutions and reports back to Parliament; that the CPS conducts a review of cases where prosecutions for incitement to racial hatred have been brought, in order to see what lessons can be learned.
The CPS’ investigation into reported antisemitic incidents and their respective prosecution outcomes led to the production of an action plan on antisemitic crime, which sets out the following steps to be taken by CPS:
• provide prosecutors with better guidance to help them identify and refer appropriate cases to the CPS’ Counter Terrorism Division;
• ensure a proactive approach when working with the police so that the strongest possible cases are built;
• improve the level of support for victims of antisemitic crime, and encourage victims to support a prosecution; and
• increase and improve community engagement.
The Antisemitic Crime Action Plan has now been circulated to Jewish Community Groups and to the
RACIST AND RELIGIOUS HATE CRIME
Case Study:Religious incident
The victim was a 17 year old female who wears a Hijab (a head scarf concealing her hair and neck) and Jilbab (an outer garment covering her from head to toe). On occasions she also wears a Niqab (a face veil covering the lower part of her face up to the eyes). On seven occasions whilst walking to school the victim complained of verbal abuse committed by the driver of a specifically identified vehicle who on each occasion shouted religious and racist insults. The defendant upon arrest was identified by way of video identification procedure and by association to the car. He was indicted for an offence of religiously aggravated harassment. The defendant denied any abuse but accepted that he was the driver of the car.
Prior to trial the sensitive issue of the consequential impact on the evidence, should the victim wish to give evidence whilst her face remained covered, was discussed with the victim. The concern was that in the absence of any corroborative evidence, the jury’s ability to assess the veracity of the witness in comparison to the defendant might have been curtailed due to their inability to observe her facial expressions. This was explained to the victim who was asked for her own preference and chose to give evidence without the use of her veil.
Special measures were applied for. The use of screens was granted to allow the victim the comfort of giving evidence without further embarrassment or distress. A dedicated Witness Care Officer was allocated to the case, who made regular contact with the victim at all stages up to the trial date and afterwards informed the victim of the sentence.
The defendant pleaded not guilty. After the trial, the jury returned a guilty verdict and the defendant received a 9 month custodial sentence.
Case Study:Racist incident
This was an incident on a bus where the white defendant was a passenger and got into an argument with the Afro/Caribbean bus driver. The defendant punched the screen around the driver and then punched the driver in the face several times preceded by shouting extremely racist insults.
Racist and religious hate crime:
key findings
Since April 2005 the Crown Prosecution Service has reported on the prosecution of racially and religiously aggravated crimes as part of the CPS Area performance review process. Data on crimes with a racial or religious motivation were formerly recorded manually through the Racist Incident Monitoring Scheme (RIMS), but the more recent figures included in the present report were recorded within the Compass Case Management System, and extracted from the related Compass Management Information System. Compass has enabled more consistency of recording practices, and wider compliance with the requirement to identify and record these offences. The present figures are therefore considered more complete, and more reliable, than those formerly published in annual RIMS reports.
Completed prosecutions fall into two categories: convictions, consisting of guilty pleas, convictions after trial and cases proved in the absence of the defendant; and unsuccessful outcomes, comprising all other
outcomes including discontinuances, administrative finalisations, discharged committals, dismissals after trial and dismissals no case to answer, judge directed acquittals and jury acquittals.
Charging
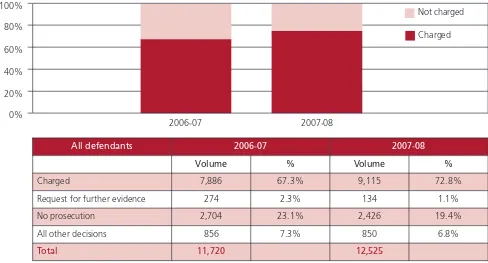
[image:20.595.50.538.511.774.2]The CPS decision that a defendant should be charged rose from 67.3% of racially or religiously aggravated cases referred to the Service in 2006-07 to 72.8% in 2007-08.
Table 1: Pre-charge decisions
100%
80%
60%
40%
20%
0%
Charged Not charged
2006-07 2007-08
All defendants 2006-07 2007-08
Volume % Volume %
Charged 7,886 67.3% 9,115 72.8%
Request for further evidence 274 2.3% 134 1.1%
No prosecution 2,704 23.1% 2,426 19.4%
All other decisions 856 7.3% 850 6.8%
Total 11,720 12,525
RACIST AND RELIGIOUS HATE CRIME: KEY FINDINGS
Convictions
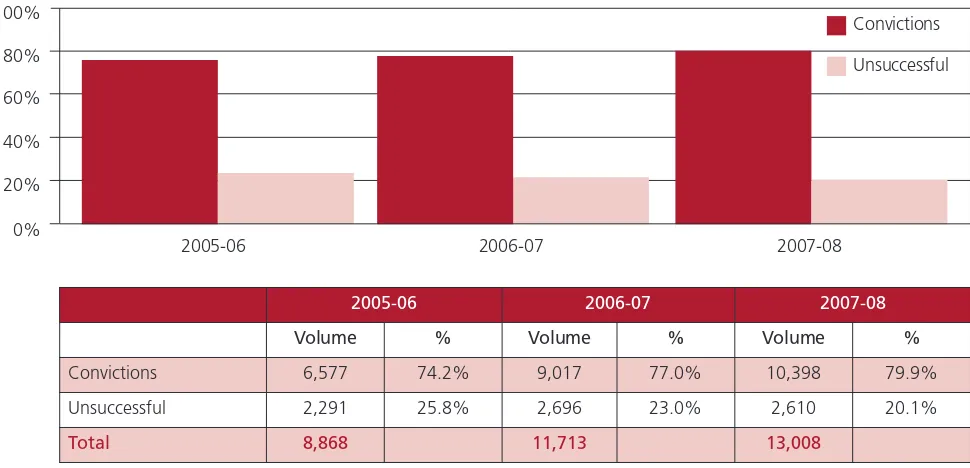
[image:21.595.67.552.168.402.2]In the three years ending March 2008, over 33,500 defendants were prosecuted for crimes involving racial or religious aggravation. Table and chart 2 below provide a breakdown of prosecutions over the three year period, showing that convictions rose from 74% in 2005-6 to 80% in 2007-08.
Table 2: Completed prosecutions by outcome
100%
80%
60%
40%
20%
0%
Convictions
Unsuccessful
2005-06 2006-07 2007-08
2005-06 2006-07 2007-08
Volume % Volume % Volume %
Convictions 6,577 74.2% 9,017 77.0% 10,398 79.9%
Unsuccessful 2,291 25.8% 2,696 23.0% 2,610 20.1%
Total 8,868 11,713 13,008
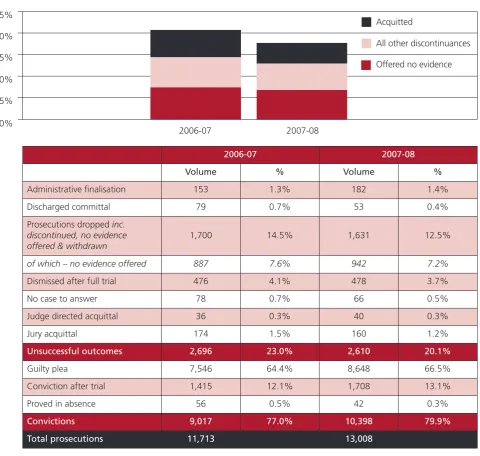
The table and charts below show a detailed breakdown of prosecution outcomes for racial or religiously motivated crimes in 2006-07 and 2007-08. Guilty pleas increased from 64% to just under 67%,
contributing to an improved conviction rate of 80% overall in 2007-08. Prosecutions dropped by the CPS, including discontinuances and cases in which no evidence was offered, fell from almost 15% to less than 13%.
Table 3:Prosecution outcomes
Convictions
100%
80%
60%
40%
20%
0%
Guilty plea
Conviction after trial
2006-07 2007-08
Unsuccessful outcomes
25%
20%
15%
10%
5%
0%
Offered no evidence All other discontinuances Acquitted
2006-07 2007-08
2006-07 2007-08
Volume % Volume %
Administrative finalisation 153 1.3% 182 1.4%
Discharged committal 79 0.7% 53 0.4%
Prosecutions droppedinc. discontinued, no evidence offered & withdrawn
1,700 14.5% 1,631 12.5%
of which – no evidence offered 887 7.6% 942 7.2%
Dismissed after full trial 476 4.1% 478 3.7%
No case to answer 78 0.7% 66 0.5%
Judge directed acquittal 36 0.3% 40 0.3%
Jury acquittal 174 1.5% 160 1.2%
Unsuccessful outcomes 2,696 23.0% 2,610 20.1%
Guilty plea 7,546 64.4% 8,648 66.5%
Conviction after trial 1,415 12.1% 1,708 13.1%
Proved in absence 56 0.5% 42 0.3%
Convictions 9,017 77.0% 10,398 79.9%
RACIST AND RELIGIOUS HATE CRIME: KEY FINDINGS
Unsuccessful prosecutions
[image:23.595.70.556.354.792.2]Cases may fail through evidential reasons, public interest reasons, because a case is unable to proceed, because proceedings are subject to an administrative finalisation, and for other reasons. The proportions falling within each category showed some differences from 2005-6 to 2007-08. In 2007-08, 7% were unsuccessful for administrative reasons (similar to 2005-6); 33.8% for evidential reasons, reduced from 39%; 10.7% for public interest (increased from 7.9%); 21.1% were unable to proceed (up from 16.7%), and 27.4% fell into other reasons, almost 2 percentage points lower than in 2005-06. Table 4 gives a more refined analysis, showing the proportion failing due to victim issues (including victim retraction and cases in which a victim failed to attend a court hearing), those resulting in a bindover, and those in which the defendant was cautioned. Within these key victim reasons, victim retraction increased from 5% to 7% during the period under review. There was also a marked rise in the proportion failing owing to non attendance of the victim (from 6% to 9%) and in the proportion in which the evidence of victims did not support the prosecution case (from 4% to 7%). Bindovers reduced over the period from 8% to 6%. The proportion failing because of key reasons (comprising victim and witness issues and cases in which a caution or bindover was considered suitable) rose from 24% to 30% of all unsuccessful outcomes. Acquittals (21%) and essential legal element missing (11%) accounted for more unsuccessful outcomes, than victim issues, as for disability incidents and homophobic crimes.
Table 4:Key reasons for unsuccessful prosecutions
30% 35%
25%
20%
15%
10%
5%
0%
Bindover
Caution
Evidence of victim does not support case
Victim non-attendance
Victim retraction
2005-06 2006-07 2007-08
2005-06 2006-07 2007-08
Volume % Volume % Volume %
Victim retraction 107 4.7% 161 6.0% 170 6.5%
Victim non-attendance 131 5.7% 205 7.6% 240 9.2%
Evidence of victim does not
support case 100 4.4% 164 6.1% 176 6.7%
Caution 45 2.0% 75 2.8% 43 1.6%
Table and chart 5 show the volume and proportion of victim issues in relation to all outcomes. The volume and proportion of those unsuccessful due to victim difficulties increased, from 338 (4%) in 2005-6 to 586 (5%) in 2007-08. Total unsuccessful outcomes, however, fell from 26% in 2005-6 to 20% in 2007-08.
Table 5: Comparison of key victim issues
Victim issues in relation to all outcomes
12,000
10,000
8,000
6,000
4,000
2,000
0
Total unsuccessful due to victim issues Total unsuccessful
Total convictions
2005-06 2006-07 2007-08
% victim issues
2% 4%
3% 6%
5%
1%
0%
Of all RARA crime cases - % unsuccessful due to victim difficulties
2005-06 2006-07 2007-08
2005-06 2006-07 2007-08
Volume % Volume % Volume %
Total unsuccessful due
to victim issues 338 3.8% 530 4.5% 586 4.5%
Total unsuccessful 2,291 25.8% 2,696 23.0% 2,610 20.1%
Total convictions 6,577 74.2% 9,017 77.0% 10,398 79.9%
Total convictions 8,868 11,713 13,008
Principal offence category
At the conclusion of proceedings, each defendant case is allocated a Principal Offence Category to indicate the type and seriousness of the charges brought.
RACIST AND RELIGIOUS HATE CRIME: KEY FINDINGS
higher at 47% and public order and criminal damage slightly lower at 41% and 5% respectively. Men comprised 84% of defendants whose principal offence was identified as offences against the person or as public order.
Retraction
While the facility to collect information on the issue of retraction has been in place since April 2007, the completeness and reliability of the data remains under development. Work is planned for 2009-2010 to improve data collection and quality.
Sentence uplifts
This information has been collected since April 2007, but again remains under development. Sentence uplifts apply to racial or religiously motivated crime, homophobic crime, and disability incidents only. Work is planned for 2009-2010 to improve data collection and quality.
Equalities
(i) Defendants
Gender
Table 6 provides a breakdown of the gender of defendants. The proportion of defendants who were men has remained virtually the same at around 85%.
15,000
10,000
5,000
0
Women
Men
[image:25.595.62.556.441.645.2]2005-06 2006-07 2007-08
Table 6: Completed prosecutions by gender of defendant
2005-06 2006-07 2007-08
Volume % Volume % Volume %
Women 1,264 14.3% 1,792 15.3% 1,970 15.1%
Men 7,603 85.7% 9,918 84.7% 11,036 84.8%
Unknown 1 0.0% 3 0.0% 2 0.0%
Ethnicity
Ethnicity data on defendants is collected by the CPS in accordance with the agreed Criminal Justice System definitions for the 16+1 ethnic categories. In 2007-08, 76% of racially and religiously aggravated crime defendants were identified as belonging to the White British category, and 80% were categorised as White. 5% of defendants were identified as Asian, and just under 5% were identified as Black. 5% of defendants did not state an ethnicity on arrest.
Other equality data
Data on the religion or belief and disability of defendants has been collected since April 2007 and the completeness and accuracy of this data remains under development.
(ii) Victims
Gender
[image:26.595.50.542.415.659.2]Table 7 provides a breakdown of the gender of victims. Data on victims is extracted from the Witness Management System, and is available only from April 2006. The completeness and accuracy of this information remains under development. Of those victims whose gender was been identified, the highest proportion were men, at 72% in 2006-07 and 68% in 2007-08. Domestic violence is the only strand of hate crimes where the majority of victims are women. The majority of victims in all hate crimes, apart from domestic violence, are men.
Table 7: Gender of victims
80% 100%
60%
40%
20%
0%
Men
2006-07 2007-08
2006-07 2007-08
Volume % Volume %
Women 381 9.9% 1,055 13.9%
Men 966 25.1% 2,278 30.0%
Unknown 2,501 65.0% 4,250 56.0%
Total 3,848 7,583
Unknown
RACIST AND RELIGIOUS HATE CRIME: KEY FINDINGS
Other equality data
Data on victims is extracted from the Witness Management System. Data on ethnicity is available from April 2006, and data on religion or belief and disability from April 2007. The completeness and accuracy of this information remains under development and figures have not been included in the present report. Work is planned for 2009-2010 to improve data collection and quality.
Racially and religiously aggravated crime services
Homophobic and transphobic
hate crime
Policy background and future work
The Policy and Guidance for Prosecuting Cases with a Homophobic Element were published in November 2002. Both documents were refreshed and published in November 2007 to reflect changes in legislation and procedures since their initial publication and also to bring them in line with the Disability Hate Crime Policy and Guidance published in January 2007.
The documents provide a clear public statement that homophobic and transphobic crimes are not acceptable and, where appropriate, will be prosecuted through the criminal courts.
The Criminal Justice and Immigration Act 2008 received Royal Assent on 8 May 2008. Section 74 and Schedule 16 of the Act make amendments to the Public Order Act 1986 to create new offences of stirring up hatred on the grounds of sexual orientation. The offences deal with conduct – namely words or
behaviour – or material which is threatening in nature and which is intended to stir up hatred against a group of people who are defined by their sexual orientation.
Section 74 and Schedule 16 will be brought into force by Order which is expected in autumn 2008 and guidance will be prepared and issued to prosecutors.
Case Study:Homophobic and transphobic
The defendant sent homophobic hate mail using lettering cut from magazines to an openly gay couple, which was highly offensive and contained threats to kill. One of the couple committed suicide and his partner believed that the letters were a significant contributing factor.
The case was dealt with by a Crown advocate and the defendant received 18 months for a conviction of harassment. The homophobic hate crime champion and the witness care unit kept in regular content with the victim. He was kept fully updated with the progress of the case. CPS drew the court’s attention to the relevant sentencing provisions set down by section 146 CJA 2003. The Court spent some time referring to the fact that the homophobic motivation was an aggravating feature and that this type of harassment is not something that citizens in Lincolnshire should have to endure.
The victim’s victim personal statement was read out in open court, with his permission.
HOMOPHOBIC AND TRANSPHOBIC HATE CRIME: KEY FINDINGS
Homophobic and transphobic
hate crime: key findings
Since April 2005 the Crown Prosecution Service has reported on the prosecution of homophobic and transphobic crimes as part of the CPS Area performance review process. While we recognise the distinct nature of these crimes, within this report homophobic and transphobic crimes are grouped under the categoryhomophobic. Data on crimes of homophobia are recorded within the Compass Case
Management System, and extracted from the related Compass Management Information System. Completed prosecutions fall into two categories: convictions, consisting of guilty pleas, convictions after trial and cases proved in the absence of the defendant; and unsuccessful outcomes, comprising all other outcomes including discontinuances, administrative finalisations, discharged committals, dismissals after trial and dismissals no case to answer, judge directed acquittals and jury acquittals.
Charging
[image:29.595.70.554.472.733.2]The CPS decided that a defendant should be charged in 61.5% of homophobic crime cases referred to the Service in 2006-07, rising to 64.6% in 2007-08.
Table 1: Pre-charge decisions
100%
80%
60%
40%
20%
0%
Charged
Not charged
2006-07 2007-08
All defendants 2006-07 2007-08
Volume % Volume %
Charged 504 61.5% 758 64.6%
Request for further evidence 23 2.8% 14 1.2%
No prosecution 215 26.2% 272 23.2%
Convictions
[image:30.595.53.541.157.389.2]In the three years ending March 2008, over 2,400 defendants were prosecuted for crimes involving homophobia. Table and chart 2 below provide a breakdown of prosecutions over the three year period, showing that convictions rose from 71% in 2005-6 to 78% in 2007-08.
Table 2: Completed prosecutions by outcome
100%
80%
60%
40%
20%
0%
Convictions
Unsuccessful
2005-06 2006-07 2007-08
2005-06 2006-07 2007-08
Volume % Volume % Volume %
Convictions 426 71.0% 604 73.5% 778 78.2%
Unsuccessful 174 29.0% 218 26.5% 217 21.8%
Total 600 822 995
The table and charts below show a detailed breakdown of prosecution outcomes for homophobic crimes in 2006-07 and 2007-08. Guilty pleas increased from 58% to 67%, contributing to an improved overall conviction rate of 78% in 2007-08. Prosecutions dropped by the CPS, including discontinuances and cases in which no evidence was offered, fell from 17% to less than 14%.
In 2007-08 the target was to reduce unsuccessful homophobic motivated crimes to 20%. Outcomes were outside the target at 22.6% in the fourth quarter.
Table 3:Prosecution outcomes
Convictions
60% 70% 80%
50%
40%
30%
20%
10%
0%
Guilty plea
Conviction after trial
[image:30.595.53.543.563.750.2]HOMOPHOBIC AND TRANSPHOBIC HATE CRIME: KEY FINDINGS
Unsuccessful outcomes
25% 30%
20%
15%
10%
5%
0%
Offered no evidence All other discontinuances Acquitted
2006-07 2007-08
2006-07 2007-08
Volume % Volume %
Administrative finalisation 7 0.9% 12 1.2%
Discharged committal 4 0.5% 0 0.0%
Prosecutions droppedinc. discontinued, no evidence offered & withdrawn
136 16.5% 137 13.8%
of which – no evidence offered 64 7.8% 67 6.7%
Dismissed after full trial 43 5.2% 53 5.3%
No case to answer 12 1.5% 7 0.7%
Judge directed acquittal 4 0.5% 2 0.2%
Jury acquittal 12 1.5% 6 0.6%
Unsuccessful outcomes 218 26.5% 217 21.8%
Guilty plea 478 58.2% 662 66.5%
Conviction after trial 124 15.1% 114 11.5%
Proved in absence 2 0.2% 2 0.2%
Convictions 604 73.5% 778 78.2%
Unsuccessful prosecutions
[image:32.595.56.543.314.749.2]Cases may fail through evidential reasons, public interest reasons, because a case is unable to proceed, because proceedings are subject to an administrative finalisation, and for other reasons. The proportions falling within each category showed some differences from 2005-6 to 2007-08. In 2007-08, 5.5% were unsuccessful for administrative reasons, little changed from 2005-06; 40.1% for evidential reasons, significantly increased from 33.3% in 2005-06; 11.1% for public interest, increased from 8.6%; 13.8% were unable to proceed, improved from 20.7% in the earlier period, and 29.5% fell into other reasons, 2 percentage points lower than in 2005-06. Table 4 gives a more refined analysis, showing the proportion failing due to victim issues (including victim retraction and cases in which a victim failed to attend a court hearing), those resulting in a bindover, and those in which the defendant was cautioned. Within these key reasons, bindovers remained the largest single category, although they fell over the period under review from 9% to 7%. There was also a marked fall in the proportion failing owing to victim retraction, from 6% to 2%, while those failing because of victim non attendance rose from 6% to 9%. The proportion failing because of key reasons remained stable, at around 30% of all unsuccessful outcomes. Acquittals (22%) and essential legal element missing (15%) accounted for more unsuccessful outcomes, than victim issues, as for disability incidents and racist and religious hate crimes.
Table 4: Key reasons for unsuccessful prosecutions
30% 35%
25%
20%
15%
10%
5%
0%
Bindover
Caution
Evidence of victim does not support case
Victim non-attendance
Victim retraction
2005-06 2006-07 2007-08
2005-06 2006-07 2007-08
Volume % Volume % Volume %
Victim retraction 10 5.7% 14 6.4% 5 2.3%
Victim non-attendance 10 5.7% 13 6.0% 19 8.8%
Evidence of victim does not
support case 10 5.7% 13 6.0% 13 6.0%
Caution 5 2.9% 6 2.8% 13 6.0%
Bindover 16 9.2% 22 10.1% 16 7.4%
Total key reasons 51 29.3% 68 31.2% 66 30.4%
All other reasons 113 64.9% 143 65.6% 139 64.1%
Administrative finalisations 10 5.7% 7 3.2% 12 5.5%
Total unsuccessful due to victim issues HOMOPHOBIC AND TRANSPHOBIC HATE CRIME: KEY FINDINGS
[image:33.595.69.558.222.709.2]Table and chart 5 show the volume and proportion of victim issues in relation to all outcomes. While the volume of those unsuccessful due to victim difficulties increased, from 30 in 2005-06 to 37 in 2007-08, they fell slightly in proportional terms, from 5% to less than 4%. Total unsuccessful outcomes fell from 29% in 2005-06 to 22% in 2007-08.
Table 5: Comparison of key victim issues
Victim issues in relation to all outcomes
600 700 800 900
500
400
300
200
100
0
Total unsuccessful Total convictions
2005-06 2006-07 2007-08
% victim issues
2% 4%
3% 6%
5%
1%
0%
Of all homophobic crime cases – % unsuccessful due to victim difficulties
2005-06 2006-07 2007-08
2005-06 2006-07 2007-08
Volume % Volume % Volume %
Total unsuccessful due
to victim issues 30 5.0% 40 4.9% 37 3.7%
Total unsuccessful 174 29.0% 218 26.5% 217 21.8%
Total convictions 426 71.0% 604 73.5% 778 78.2%
Principal offence category
At the conclusion of proceedings, each defendant case is allocated a Principal Offence Category to indicate the type and seriousness of the charges brought.
Offences against the person were the most numerous category, representing 50% of homophobic crime prosecutions in 2007-08. Criminal damage and public order accounted for a further 6% and 34% respectively. A similar pattern was recorded for men, with 51% being categorised as offences against the person, 6% as criminal damage, and 33% as public order. There was a slightly different pattern for women, offences against the person being lower at 45% and criminal damage slightly lower at 5%, while public order was higher at 40%. Men comprised 87% of defendants whose principal offence was identified as offences against the person.
Retraction
While the facility to collect information on the issue of retraction has been in place since April 2007 the completeness and reliability of the data remains under development. Work is planned for 2009-2010 to improve data collection and quality.
Sentence uplifts
This information has been collected since April 2007, but again remains under development. Sentence uplifts apply to racial or religiously motivated crime, homophobic crime, and disability incidents only. Work is planned in 2009-2010 to improve data collection and quality.
Equalities
(i) Defendants
Gender
Table 6 provides a breakdown of the gender of defendants. The proportion of defendants who were men fell slightly from 90% in 2005-6 to 87% in 2007-08.
750 1,000 1,250
500
250
0
Women
Men
[image:34.595.53.541.559.806.2]2005-06 2006-07 2007-08
Table 6: Completed prosecutions by gender of defendant
2005-06 2006-07 2007-08
Volume % Volume % Volume %
Women 60 10.0% 95 11.6% 134 13.5%
Men 540 90.0% 727 88.4% 861 86.5%
HOMOPHOBIC AND TRANSPHOBIC HATE CRIME: KEY FINDINGS
Ethnicity
Ethnicity data on defendants is collected by the CPS in accordance with the agreed Criminal Justice System definitions for the 16+1 ethnic categories. In 2007-08, 76% of homophobic crime defendants were identified as belonging to the White British category, and 79% were categorised as White. Just under 3% of defendants were identified as Asian, and a further 4% were identified as Black. 4% of defendants did not state an ethnicity on arrest.
Other equality data
Data on the religion or belief and disability of defendants has been collected since April 2007 and the completeness and accuracy of this data remains under development.
(ii) Victims
Gender
Table 7 provides a breakdown of the gender of victims. Data on victims is extracted from the Witness Management System, and is available only from April 2006. The completeness and accuracy of this information remains under development. Of those victims whose gender has been identified the highest proportion were men, at 61% in 2006-07 and 65% in 2007-08.
60% 80% 100%
40%
20%
0%
Women
Men
Unknown
[image:35.595.65.558.403.648.2]2006-07 2007-08
Table 7: Gender of victims
2006-07 2007-08
Volume % Volume %
Women 43 14.6% 103 16.7%
Men 67 22.8% 191 31.0%
Unknown 184 62.6% 322 52.3%
Other equality data
Data on victims is extracted from the Witness Management System. Data on ethnicity is available from April 2006, and data on religion or belief and disability from April 2007. The completeness and accuracy of this information remains under development and figures have not been included in the present report. Work is planned in 2009-2010 to improve data collection and quality.
Homophobic crime services
DISABILITY HATE CRIME
Disability hate crime
The CPS Policy for prosecuting disability hate crime cases was published in February 2007. CPS worked closely with disabled people themselves and organisations supporting disabled people in developing the policy statement and guidance for prosecutors. Following publication, a monitoring flag for disability incidents was introduced into the CPS case management system in April 2007. The CPS has also actively raised awareness of the new policy and monitoring requirements through a poster and postcard campaign raising awareness by creating a Co-ordinators’ Network, training prosecutors and reviewing the systems for flagging and monitoring of cases.
Future work in this area will focus on supporting Areas to understand how to identify and build robust disability hate crime cases in the form of new Guidance and working with Areas to produce action plans in response to the planned disability hate crime review which is ongoing until 2011.
Over the past year, analysis of disability incident data has revealed challenges and shortcomings in CPS recording. Work is underway to tackle these issues, and we are confident of achieving clear improvements in data quality.
Case Study:Disability hate crime
A disabled man was in an internet café when he was repeatedly threatened and insulted based on his disabilities. The owner of the café called the police and the victim gave a statement.
Disability hate crime:
key findings
Since April 2007 the Crown Prosecution Service has reported on the prosecution of disability incident crimes as part of the CPS Area performance review process. Data on crimes involving disability incidents are
recorded within the Compass Case Management System, and extracted from the related Compass Management Information System.
Completed prosecutions fall into two categories: convictions, consisting of guilty pleas, convictions after trial and cases proved in the absence of the defendant; and unsuccessful outcomes, comprising all other outcomes including discontinuances, administrative finalisations, discharged committals, dismissals after trial and dismissals no case to answer, judge directed acquittals and jury acquittals.
Charging
[image:38.595.46.548.453.742.2]The CPS decided that a defendant should be charged in 69% of all disability incident cases referred to the Service in 2007-08.
Table 1: Pre-charge decisions
100%
80%
60%
40%
20%
0%
Charged Not charged
2007-08
All defendants 2007-08
Volume %
Charged 187 69.0%
Request for further evidence 2 0.7%
No prosecution 75 27.7%
All other decisions 7 2.6%
Total 271
DISABILITY HATE CRIME: KEY FINDINGS
Convictions
[image:39.595.67.552.166.408.2]In the year ending March 2008, 183 defendants were prosecuted for crimes involving disability incidents. Table and chart 2 below provide a breakdown of outcomes, showing that 77% of completed cases resulted in a conviction in 2007-08.
Table 2: Completed prosecutions by outcome
100%
80%
60%
40%
20%
0%
Convictions
Unsuccessful
2007-08
2007-08
Volume %
Convictions 141 77.0%
Unsucessful 42 23.0%
[image:39.595.64.555.539.759.2]Total 183
Table 3:Prosecution outcomes
Convictions
74.0% 75.0% 76.0% 77.0% 78.0%
73.0%
72.0%
71.0%
Guilty plea
Conviction after trial
Unsuccessful outcomes
25.0%
20.0%
15.0%
10.0%
5.0%
0%
Offered no evidence All other discontinuances Acquitted
2007-08
2007-08
Volume %
Administrative finalisation 0 0.0%
Discharged committal 1 0.5%
Prosecutions droppedinc. discontinued, no evidence offered & withdrawn
27 14.8%
of which – no evidence offered 16 8.7%
Dismissed after full trial 12 6.6%
No case to answer 0 0.0%
Judge directed acquittal 0 0.0%
Jury acquittal 2 1.1%
Unsuccessful outcomes 42 23.0%
Guilty plea 131 71.6%
Conviction after trial 10 5.5%
Proved in absence 0 0.0%
Convictions 141 77.0%
DISABILITY HATE CRIME: KEY FINDINGS
Unsuccessful prosecutions
Cases may fail through evidential reasons, public interest reasons, because a case is unable to proceed, because proceedings are subject to an administrative finalisation, and for other reasons (including cases resulting in bindover and acquittal after trial). In 2007-08 the “other reasons” category was the largest at 42.9%; none were unsuccessful for administrative reasons; 31% were unsuccessful for evidential reasons; 7.1% for public interest reasons and 19% were unable to proceed. Table 4 gives a more refined analysis, showing the proportion failing due to victim issues (including victim retraction and cases in which a victim failed to attend a court hearing), those resulting in a bindover, and those in which the defendant was cautioned. Within these key victim reasons, victim retraction and bindovers were the largest categories, both at 12%, while 12% were due to non attendance of the victim, and there were 5% where the evidence of victims did not support the prosecution case. 36% failed because of key reasons. Acquittals (31%) and instances where a witness or witnesses were unreliable (15%) accounted for more unsuccessful outcomes than victim issues, similar to racist and religious incidents and homophobic crimes.
40.0%
30.0%
20.0%
10.0%
0%
Bindover
Caution
Evidence of victim does not support case
2007-08
2007-08
Volume %
Victim retraction 5 11.9%
Victim non-attendance 2 4.8%
Evidence of victim does not
support case 2 4.8%
Caution 1 2.4%
Bindover 5 11.9%
Total key reasons 15 35.7%
All other reasons 27 64.3%
Administrative finalisations 0 0.0%
Total 42
Table 4:Key reasons for unsuccessful prosecutions
Victim non-attendance
Table and chart 5 show that victim issues represented 9 defendants, or 5%, in 2007-08. Unsuccessful outcomes amounted to 23% of the total in 2007-08.
Table 5: Comparison of key victim issues
Victim issues in relation to all outcomes
100 120 140 160
80
60
40
20
0
Total unsuccessful due to victim issues Total unsuccessful
Total convictions
2007-08
2007-08
Volume %
Total unsuccessful due to
victim issues 9 4.9%
Total unsuccessful 42 23.0%
Total convictions 141 77.0%
Total prosecutions 183
Principal offence category
At the conclusion of proceedings, each defendant case is allocated a Principal Offence Category to indicate the type and seriousness of the charges brought.
Offences against the person were the most numerous category, representing 53% of disability incident crime prosecutions in 2007-08. Public order, burglary and theft and handling accounted for a further 13%, 9% and 8% respectively. A similar pattern was recorded for men, with 52% being categorised as offences against the person, 14% as public order, 10% as burglary and 9% as theft and handling. There was a slightly different pattern for women, offences against the person being higher at 56%, while public order, burglary and theft and handling were all lower at 6%. Men comprised 80% of defendants whose principal offence was identified as offences against the person. A slightly different pattern of offences, compared with other hate crimes, is noted, with less offences against the person overall, and a higher proportion of theft and handling.
Retraction
DISABILITY HATE CRIME: KEY FINDINGS
Sentence uplifts
This information has been collected since April 2007, but again remains under development. Sentence uplifts apply to racial or religiously motivated crime, homophobic crime, and disability incidents only. Work is planned for 2009-2010 to improve data collection and quality.
Equalities
(i) Defendants
Gender
Table 6 provides a breakdown of the gender of defendants. 82% of defendants prosecuted were men.
Table 6: Completed prosecutions by gender of defendant
200
150
100
50
0
Women
2007-08
2007-08
Volume %
Women 33 18.0%
Men 150 82.0%
Unknown 0 0.0%
Total 183
Ethnicity
Ethnicity data on defendants is collected by the CPS in accordance with the agreed Criminal Justice System definitions for the 16+1 ethnic categories. In 2007-08, 83% of disability incident crime defendants were identified as belonging to the White British category, and 86% were categorised as White. 1% of
defendants were identified as Asian, and just over 4% were identified as Black. 3% of defendants did not state an ethnicity on arrest. Of all hate crimes disability incidents were committed proportionally more by White defendants.
Other equality data
Data on the religion or belief and disability of defendants has been collected since April 2007 and the completeness and accuracy of this data remains under development.
(ii) Victims
Gender
[image:44.595.49.540.388.762.2]Table 7 provides a breakdown of the gender of victims. Data on victims is extracted from the Witness Management System, and is available for disability incidents from April 2007: however, the completeness and accuracy of this information remains under development. Of those victims whose gender was identified in 2007-08, 52% were men.
Table 7: Gender of victims
40% 50% 60% 70% 80% 90% 100%
30%
20%
10%
0%
Men
2007-08
2007-08
Volume %
Women 30 20.8%
Men 33 22.9%
Unknown 81 56.3%
Total 144
Unknown
DISABILITY HATE CRIME: KEY FINDINGS
Other equality data
Data on victims is extracted from the Witness Management System. Data on ethnicity is available from April 2006, and data on religion or belief and disability from April 2007. The completeness and accuracy of this information remains under development and has not been included in the present report. Work is planned for 2009-2010 to improve data collection and quality.
Disability incident crime services
ANNEX 1: PROSECUTIONS BY AREA
2007-08
Convictions Unsuccessful
Total
Volume % Volume %
42 Areas 55,294 70.9% 22,711 29.1% 78,005
Avon & Somerset 1,523 73.7% 543 26.3% 2,066
Bedfordshire 450 68.1% 211 31.9% 661
Cambridgeshire 550 69.6% 240 30.4% 790
Cheshire 1,241 72.7% 466 27.3% 1,707
Cleveland 901 70.2% 383 29.8% 1,284
Cumbria 508 78.6% 138 21.4% 646
Derbyshire 1,275 71.6% 505 28.4% 1,780
Devon & Cornwall 998 69.2% 445 30.8% 1,443
Dorset 792 69.7% 344 30.3% 1,136
Durham 828 72.1% 320 27.9% 1,148
Dyfed Powys 409 81.0% 96 19.0% 505
Essex 1,064 70.3% 450 29.7% 1,514
Gloucestershire 692 78.8% 186 21.2% 878
Greater Manchester 4,024 74.4% 1,383 25.6% 5,407
Gwent 650 70.3% 275 29.7% 925
Hampshire 2,113 70.7% 874 29.3% 2,987
Hertfordshire 769 68.8% 349 31.2% 1,118
Humberside 1,084 81.5% 246 18.5% 1,330
Kent 1,358 70.0% 581 30.0% 1,939
Lancashire 3,170 77.4% 924 22.6% 4,094
Leicestershire 1,359 74.5% 466 25.5% 1,825
Lincolnshire 562 75.5% 182 24.5% 744
Merseyside 1,525 64.6% 834 35.4% 2,359
Metropolitan & City 5,467 62.1% 3,332 37.9% 8,799
Norfolk 826 79.9% 208 20.1% 1,034
Northamptonshire 398 76.7% 121 23.3% 519
Northumbria 1,891 66.7% 946 33.3% 2,837
North Wales 902 78.9% 241 21.1% 1,143
North Yorkshire 516 73.4% 187 26.6% 703
Nottinghamshire 1,027 63.1% 600 36.9% 1,627
South Wales 1,356 67.6% 649 32.4% 2,005
South Yorkshire 1,696 73.3% 617 26.7% 2,313
Staffordshire 1,210 68.2% 564 31.8% 1,774
Suffolk 704 83.0% 144 17.0% 848
Surrey 546 67.0% 269 33.0% 815
Sussex 1,287 70.1% 550 29.9% 1,837
Annex 1:Prosecutions by Area
2007-08
Convictions Unsuccessful
Total
Volume % Volume %
42 Areas 10,398 79.9% 2,610 20.1% 13,008
Avon & Somerset 268 81.7% 60 18.3% 328
Bedfordshire 67 73.6% 24 26.4% 91
Cambridgeshire 68 76.4% 21 23.6% 89
Cheshire 164 80.4% 40 19.6% 204
Cleveland 142 82.1% 31 17.9% 173
Cumbria 69 90.8% 7 9.2% 76
Derbyshire 149 75.3% 49 24.7% 198
Devon & Cornwall 143 81.7% 32 18.3% 175
Dorset 129 76.3% 40 23.7% 169
Durham 155 79.9% 39 20.1% 194
Dyfed Powys 53 81.5% 12 18.5% 65
Essex 186 75.0% 62 25.0% 248
Gloucestershire 79 81.4% 18 18.6% 97
Greater Manchester 980 81.7% 219 18.3% 1,199
Gwent 69 71.9% 27 28.1% 96
Hampshire 369 82.0% 81 18.0% 450
Hertfordshire 202 78.6% 55 21.4% 257
Humberside 132 84.1% 25 15.9% 157
Kent 223 83.8% 43 16.2% 266
Lancashire 585 85.7% 98 14.3% 683
Leicestershire 329 86.8% 50 13.2% 379
Lincolnshire 110 83.3% 22 16.7% 132
Merseyside 252 73.5% 91 26.5% 343
Metropolitan & City 1,448 74.2% 503 25.8% 1,951
Norfolk 92 84.4% 17 15.6% 109
Northamptonshire 91 85.0% 16 15.0% 107
Northumbria 327 71.6% 130 28.4% 457
North Wales 150 85.7% 25 14.3% 175
North Yorkshire 75 80.6% 18 19.4% 93
Nottinghamshire 228 74.5% 78 25.5% 306
South Wales 183 78.9% 49 21.1% 232
South Yorkshire 250 85.9% 41 14.1% 291
Staffordshire 173 77.9% 49 22.1% 222
Suffolk 97 85.1% 17 14.9% 114
Surrey 166 75.8% 53 24.2% 219
Sussex 269 79.4% 70 20.6% 339
Thames Valley 292 75.6% 94 24.4% 386
Warwickshire 113 91.1% 11 8.9% 124
West Mercia 202 84.9% 36 15.1% 238
West Midlands 760 82.4% 162 17.6% 922
West Yorkshire 503 85.4% 86 14.6% 589
Wiltshire 56 86.2% 9 13.8% 65
ANNEX 1: PROSECUTIONS BY AREA
2007-08
Convictions Unsuccessful
Total
Volume % Volume %
42 Areas 778 78.2% 217 21.8% 995
Avon & Somerset 18 60.0% 12 40.0% 30
Bedfordshire 4 80.0% 1 20.0% 5
Cambridgeshire 4 100.0% 0 0.0% 4
Cheshire 17 73.9% 6 26.1% 23
Cleveland 6 75.0% 2 25.0% 8
Cumbria 9 52.9% 8 47.1% 17
Derbyshire 17 94.4% 1 5.6% 18
Devon & Cornwall 27 81.8% 6 18.2% 33
Dorset 7 50.0% 7 50.0% 14
Durham 12 75.0% 4 25.0% 16
Dyfed Powys 3 60.0% 2 40.0% 5
Essex 17 65.4% 9 34.6% 26
Gloucestershire 6 75.0% 2 25.0% 8
Greater Manchester 62 86.1% 10 13.9% 72
Gwent 8 88.9% 1 11.1% 9
Hampshire 46 85.2% 8 14.8% 54
Hertfordshire 10 71.4% 4 28.6% 14
Humberside 6 100.0% 0 0.0% 6
Kent 11 64.7% 6 35.3% 17
Lancashire 33 89.2% 4 10.8% 37