June 2003
BLA
CK
PEOPLE
PUSHING
B
A
CK
THE
BOUND
ARIES II
PUSHING BACK THE BOUNDARIES II
June 2003
PUSHING BACK THE BOUNDARIES II
copyright
Greater London Authority June 2003
Published by
Greater London Authority City Hall
The Queen’s Walk London SE1 2AA www.london.gov.uk enquiries 020 7983 4100 minicom 020 7983 4458
ISBN 1 85261 498 6
This publication is printed on Evolution Satin Author
Doreen Kenny and Sharon Field
Acknowledgements
Thanks are due to Lorna Spence at the GLA for her assistance
Contents
Introduction ii
Foreword iv
Summary 1
Identities and definitions 3
Population 4
Employment 6
Occupations 6
Unemployment 6
Part-time employment 11
Self-employment 11
Disabled people and employment 11
Public sector employment 13
Contracted-out employment 16
Earnings 16
Incomes 18
Union membership 19
Discrimination in employment 20
Service delivery in the public sector 22
Education 24
Attainment at school 24
School exclusions 25
Qualifications 25
Teachers 26
Health and social services 29
Health status 29
Mental health 30
Nurses 31
Social services – children looked after 33
Housing 35
Tenure 35
Housing conditions 35
Police and crime 39
Police officers 39
Stop and search 40
Victims of crime 40
Voting and public representation 42
Voter registration 42
Introduction
Ken Livingstone Mayor of London
I am proud to present the second Key Facts report, in support of the second conference for London’s black and minority public sector workers.
Most of London’s black and minority ethnic minority communities are now second or third generation. For instance, nearly sixty per cent or black Caribbeans and nearly half of Bangladeshi and Pakistani people in London were born in the UK.
As Londoners, however, black and minority ethnic groups very often have to contend with unequal and discriminatory treatment in their workplaces and as users of public services.
This report sets out some key facts about the experience of black and minority ethnic Londoners in terms of employment, housing, education, earnings, crime and public representation.
The consistent and disproportionate levels of unemployment, school exclusions, stop and search, ill health, poverty and deprivation
experienced by London’s black and minority ethnic communities vividly demonstrate experiences that black Londoners continue to face on a daily basis when attempting to work and live their lives in their city.
Within the public sector itself, black and minority ethnic people are clearly under represented in the professions, in senior management and at board level.
Additional race equality legislation, the Race Relations (Amendment) Act 2000, implemented in April 2001, recognises the detrimental affect that racism has within society and in our workplaces. This legislation, quite rightly, outlaws racism in public functions not originally covered within the 1976 Race Relations Act.
I want to see the effects of this legislation translated into real progress for black and minority groups.
This will require a concerted effort and commitment which must be undertaken by policy makers, leaders and senior managers in the public services to address the structural nature of racism that exists in the employment practices, management and service provision within our public services.
As Mayor, I am determined that my policies will contribute to the eradication of race discrimination and inequality in all areas of London life. I am committed to ensuring that London becomes a fair and inclusive city where black and minority ethnic Londoners can get access to good public services, have equal pay and work conditions, and be treated fairly and with respect in their workplaces.
Foreword
Lee Jasper
Policy Director, Equalities and Policing
This report sets out the reality of institutional racism within a wide range of public sector organisations and public service provision. Over two million black and ethnic minority people live in London, making this great city one of the most diverse cities in the world.
Black and ethnic minority workers working within the public sector face a routine level of racism that indicates much remains to be done in relation to tackling racism and discrimination. Located in the main in the manual and junior management positions throughout a range of public sector organisations, black and ethnic minority workers in London remain undervalued, experience institutional racism and therefore remain largely marginalised within public sector organisations and services.
As London continues to grow, so the need for the development of quality public services becomes critical. New investment will be required and will bring with it new opportunities to build equalities into the mainstream of public service employment and service provision. London’s future success depends on ensuring equality of opportunity for all Londoners. As the report sets out, African, Bangladeshi, Caribbean and Pakistani communities make up 45 per cent of the total number of unemployed people in London. Those in employment earn low wages, endure high housing costs, and live in some of the most deprived areas of London.
Compounded by the patchy and inconsistent implementation of equality and diversity strategies genuine equality as this report demonstrates remains frustratingly elusive. London public sector is best characterised, in relation to its record on equalities, as islands of excellence surrounded by seas of mediocrity. The report highlights the unacceptable levels of inertia associated with the implementation of equality and diversity strategies that is reflected in the performance of public sector
organisations to achieve representative levels of employment in London.
The requirements of the Race Relations (Amendment) Act should contribute toward achieving greater levels of equality in public sector employment and service provision.
As the Mayor has pointed out, for legislation to work there must be clear and unequivocal commitment within the public sector to deliver equality.
This means that there must be consistent and committed leadership for the delivery of equalities in London. Where the public sector organisations senior management teams fail to prioritise issues of equalities this translates into wasted opportunities and poor service provision.
There must be a complete transformation in the delivery of equalities in London.
The Mayor recognises that the role of London’s black and minority ethnic public sector workers in bringing about this transformation and change is critical to the success of improving race equality in public service employment and service delivery in London.
workers and those involved in the field of race equality to actively change and assist in a positive transformation of London’s public services.
Lee Jasper
Summary
Key facts on public services and black and minority ethnic people in London
●There are now more than two million people from black and minority
ethnic groups in London – nearly 29 per cent of the total population. Forty-six per cent of England’s black and minority ethnic population live in London.
●There are 1.4 million black and minority ethnic Londoners of working
age. It is estimated that almost 80 per cent of the increase in the working age population during the next decade will consist of people from black and minority groups.
●Although some positive moves have been made towards getting rid of
racism in the workplace in the past decade, many black workers continue to experience discrimination, including being passed over for promotion, racist language and more subtle forms of discrimination.
●Only 18 per cent of managers and senior officials and fewer than 21 per
cent of professionals are from black and minority ethnic groups.
●There is a high degree of occupational concentration. For instance,
nearly 58 per cent of all cashiers and checkout operators are from black or minority ethnic groups, as are 54 per cent of nursing auxiliaries and assistants, 49 per cent of chefs and cooks and 48 per cent of care assistants and home carers.
●The unemployment rate for all black and minority ethnic groups in
London taken together is twice as high as the rate for white groups – nearly 12 per cent compared with less than six per cent. Unemployment rates are particularly high among Bangladeshis and black or black British men.
●Over 740,000 London employees – more than one in five of the total –
work in the public sector. Around 192,000 of these – more than a quarter – are from black or minority ethnic groups.
●Forty per cent of black or black Bristish women workers are in the public
sector, compared with 30 per cent of white women and 28 per cent of
Asian women workers. Twenty-four per cent of black men are employed in Summar
the public sector, compared with 15 per cent of white men and 12 per cent of Asian men.
●Altogether, more than a third of all NHS employees in London are from
black and minority ethnic groups.
●Many black and minority ethnic workers in London are employed by
private companies providing contract services for public sector
organisations, often on terms and conditions which are inferior to those of directly employed public sector workers.
●On average, black and minority ethnic workers earn 72 per cent of the
median for white workers in the private sector, compared with nearly 89 per cent in the public sector.
●Generally younger people of all ethnic groups in London are better
qualified than their elders, but there are significant variations in
qualification levels between groups. Young people of black African, black Caribbean, Bangladeshi or Pakistani origin are particularly at risk of poor educational outcomes.
●The 2001 census shows that there are higher proportions of both
limiting long-term illness and people in poor health within most black and minority ethnic groups.
●The numbers of black or black British children looked after by local
authorities (in care) in England as a whole are out of proportion with their share of the national population.
●Those most likely to be living in council or housing association rented
property are Bangladeshi households, black African and Other black households.
●A fifth of all households in London lack one or more of the number of
rooms they require, with all black and minority ethnic groups being more affected than white groups, but especially Bangladeshi and black African households.
●Despite efforts by the Metropolitan Police Service to increase the number
of black and minority ethnic police officers, they still only formed 5.5 per cent of the total in March 2003, against the target of 7.9 per cent for this date.
●Nearly 10,000 racially aggravated offences were reported to the
●During 2002/03, black and ethnic minority people in London were nearly
eight times as likely as white people to be subject to a police stop and search.
Identities and definitions
Ethnicity is not a timeless scientific concept, but refers to a combination of historical, political, social and cultural factors. The Greater London Authority (GLA) is conscious that the ways in which different definitions allocate individuals to ethnic categories are far from neutral, and seeks to take account of this in the way it presents data on London’s population.
This conference aims to address issues which are relevant to black workers and service users in the broadest sense, taking in all Londoners who do not identify themselves as white. This is consistent with the widespread use of the word ‘black’ among many community and campaigning organisations, and reflects an understanding of ethnicity as a political, social and cultural category.
However, in many standard statistical sources, as well as in much official monitoring of minority outcomes, the term ‘black’ is used to identify a specific category within the broad category of ‘black and minority ethnic’. In order to present statistical data from official sources accurately and consistently, the GLA has to conform to standard definitions.
In this report, therefore, we have used the term ‘black and minority ethnic’ to cover all those who do not identify themselves as white, and the term ‘black’ to refer to those who identify themselves as belonging to one of the black categories in the standard definitions used in statistical surveys. The main black categories are black Caribbean, black African and other black. This year we have been able to draw on new information from the 2001 census, so many of the statistics in this report use census
classifications of ethnicity, including ‘mixed’ categories. Summar
Meaningful analysis of the comparative position of black and minority ethnic groups in Britain and London is often hampered by a scarcity of statistics broken down by ethnic group. The frequent grouping of many ethnic minorities into one group often makes it impossible to distinguish important differences in experience. For instance, statistics for Pakistani and Bangladeshi people are often grouped together in official sources, but detailed data emerging from the 2001 census underlines the differences between the two groupings. We have to continue using these groupings where no disaggregated figures are available.
Some of the statistics that are available are only published at a national level, not for London. These problems have meant that, unfortunately, we have not always been able to provide data at the level of detail we would have preferred in order to capture the diversity of London’s population. The GLA will continue to argue that the London samples for national statistical surveys need to be boosted in order to provide an adequate picture of the diversity of black and minority ethnic experience in London.
Population
There are now more than two million people from black and minority ethnic groups in London, representing nearly 29 per cent of the total population. London is home to 46 per cent of England’s total black and minority ethnic population. These include nearly 437,000 Indian people, 379,000 black Africans and 344,000 black Caribbeans. For the first time, the census in 2001 introduced mixed classifications. Altogether, more than 226,000 people in London identified themselves as one of these mixed categories, of whom the largest group – nearly a third – were white and black Caribbean.
Summar
[image:14.421.46.396.101.490.2]y
Table 1 Population of Greater London by ethnic group, & percentage born in the UK, 2001
Ethnic group Total Greater Percentage Percentage
London residents of total born in UK
Asian or Asian British
Indian 436,993 6.1 41.5
Pakistani 142,749 2.0 49.0
Bangladeshi 153,890 2.2 45.7
Other Asian 133,056 1.9 27.5
Black or black British
Black Caribbean 343,561 4.8 58.8
Black African 378,931 5.3 35.6
Other black 60,350 0.8 80.8
Chinese or other ethnic group
Chinese 80,203 1.1 29.0
Other ethnic group 113,033 1.6 17.2
Mixed
White and black Caribbean 70,929 1.0 90.2
White and black African 34,181 0.5 58.1
White and Asian 59,945 0.8 66.9
Other mixed 61,057 0.9 59.2
White
British 4,287,861 59.8 95.9
Irish 220,488 3.1 31.2
Other white 594,854 8.3 17.4
All ethnic groups 7,172,081 100.0 72.9
Source: Census 2001 Crown copyright
Table 1 includes the percentages of people in each ethnic group who were born in the UK. Apart from the mixed groups, the percentage was highest for other black people, more than 80 per cent of whom were born in the UK, followed by black Caribbeans, at 59 per cent. Chinese and other Asian people living in London were the least likely of black and ethnic minority groups to have been born in the UK.
Employment
Occupations
More than 800,000 black and minority ethnic Londoners are in employment, representing 24 per cent of all London residents in employment. Although there is a lot of variation between different groups, black and minority ethnic workers tend to be under-represented in more highly paid professional and managerial occupations and over-represented in lower paid occupations, such as in sales and customer service.
As Table 2 shows, the highest concentration of black and minority ethnic employed people – 39 per cent – is in sales and customer service
occupations. Only 18 per cent of managers and senior officials and fewer than 21 per cent of professionals are from black and minority ethnic groups.
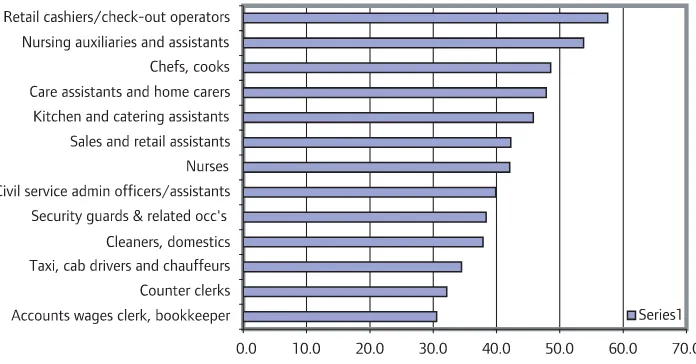
Chart 1 shows those occupations in which black and ethnic minority groups form more than 30 per cent of the workforce in London, showing the high degree of occupational concentration. Nearly 58 per cent of all cashiers and checkout operators are black or minority ethnic, as are 54 per cent of nursing auxiliaries and assistants, 49 per cent of chefs and cooks and 48 per cent of care assistants and home carers.
Unemployment
People from black and minority ethnic groups make up 29 per cent of London’s working age population and 24 per cent of all London workers, but 44 per cent of unemployed people in London.
Emplo
[image:16.421.48.396.349.531.2]yment
Table 2 Black and ethnic minority workers by major occupational group, Greater London, 2001/02
Occupation Total employed Black and minority
ethnic employed
Number Number % of total
Managers & senior officials 580,000 105,000 18.1
Professional 539,000 112,000 20.7
Associated professional & technical 619,000 115,000 18.5 Administrative and secretarial 492,000 116,000 23.5
Skilled trades 262,000 51,000 19.6
Personal service 206,000 61,000 29.7
Sales & customer service 232,000 91,000 39.4 Process, plant & machine operatives 159,000 49,000 30.7
Elementary occupations 315,000 103,000 32.6
All occupations 3,403,000 802,000 23.6
Source: Annual Local Labour Force Survey 2001/02
Chart 1 – Black and minority ethnic (BME) workers in selected occupations Greater London, 2001/02
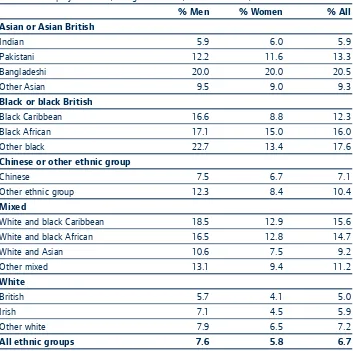
Male unemployment rates in 2001 are highest for other black men (22.7 per cent) Bangladeshis (20 per cent), black Africans (17.1) and black Caribbeans (16.6). These rates are more than twice as high as for white British men (5.7 per cent), Indian men (5.9 per cent) and Chinese men (7.5 per cent). Unemployment rates for women are lower overall, although the rate for Bangladeshi women (20 per cent) is almost as high as for Bangladeshi men. In contrast the unemployment rate for black Caribbean women (8.8 per cent), while still more than twice as high as for white British women (4.1 per cent), is only just over half the rate of black and Caribbean men (16.6 per cent).
The extent of unemployment among young people aged under 25 is of particular concern. While many of this age group are students and the numbers unemployed are relatively few, the waste of opportunity and portent for the future this represents make it a very serious issue.
Chart 2 – Unemployment rates by ethnic group, Greater London, 2001 Census
Source: Based on 2001 Census data (Standard table S108)
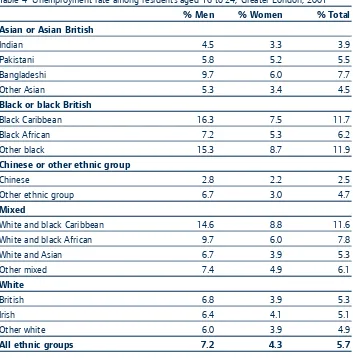
Unemployment rates are highest among young black Caribbean men, other black men and mixed white and black Caribbean men, most of whom are likely to have been born and educated in the UK.
Unemployment rates among these groups are more than twice as high as for white British men. Unemployment rates are also higher than average for Bangladeshis and mixed white and black African young men, but lower
Emplo
[image:18.421.46.399.169.520.2]yment
Table 3 Unemployment rate, all aged 16 to 74, Greater London, 2001
% Men % Women % All
Asian or Asian British
Indian 5.9 6.0 5.9
Pakistani 12.2 11.6 13.3
Bangladeshi 20.0 20.0 20.5
Other Asian 9.5 9.0 9.3
Black or black British
Black Caribbean 16.6 8.8 12.3
Black African 17.1 15.0 16.0
Other black 22.7 13.4 17.6
Chinese or other ethnic group
Chinese 7.5 6.7 7.1
Other ethnic group 12.3 8.4 10.4
Mixed
White and black Caribbean 18.5 12.9 15.6
White and black African 16.5 12.8 14.7
White and Asian 10.6 7.5 9.2
Other mixed 13.1 9.4 11.2
White
British 5.7 4.1 5.0
Irish 7.1 4.5 5.9
Other white 7.9 6.5 7.2
All ethnic groups 7.6 5.8 6.7
than average for Indian, Pakistani and Chinese young men.
[image:19.421.24.377.63.421.2]Unemployment rates for young women are lower than those for men and do not show such large differences between ethnic groups. However, the pattern is similar, with the highest rates for other black, black Caribbean, black African, mixed white and black Caribbean, mixed white and black African, and Bangladeshi young women.
Table 4 Unemployment rate among residents aged 16 to 24, Greater London, 2001
% Men % Women % Total
Asian or Asian British
Indian 4.5 3.3 3.9
Pakistani 5.8 5.2 5.5
Bangladeshi 9.7 6.0 7.7
Other Asian 5.3 3.4 4.5
Black or black British
Black Caribbean 16.3 7.5 11.7
Black African 7.2 5.3 6.2
Other black 15.3 8.7 11.9
Chinese or other ethnic group
Chinese 2.8 2.2 2.5
Other ethnic group 6.7 3.0 4.7
Mixed
White and black Caribbean 14.6 8.8 11.6
White and black African 9.7 6.0 7.8
White and Asian 6.7 3.9 5.3
Other mixed 7.4 4.9 6.1
White
British 6.8 3.9 5.3
Irish 6.4 4.1 5.1
Other white 6.0 3.9 4.9
All ethnic groups 7.2 4.3 5.7
Emplo
yment
Part-time employment
For all ethnic groups, women are much more likely to work part-time than men, but black and minority ethnic men, with the exception of Indian men, are more likely to work part-time than white British men. This is likely to be a reflection of the kinds of occupations in which they are employed and obviously has implications for the overall level of their earnings. Bangladeshi men represent the highest number, at nearly 37 per cent of all employed people.
Among women, on the other hand, most black and minority ethnic groups are less likely to work part-time than white British women. The exceptions are Bangladeshi and Pakistani women, of whom 37 per cent and nearly 34 per cent respectively work part-time, compared with 30 per cent of white British women. Those least likely to work part-time are Chinese (21 per cent) and black Caribbean women (23 per cent).
Self-employment
Rates of self-employment are highest amongst Pakistanis and white Irish men (24 per cent of all employed people), Chinese men (nearly 23 per cent) and Indian men (nearly 22 per cent). Black or black British and Bangladeshi men are considerably less likely to be self-employed than white British men. Among women, the highest rates of self-employment are for Chinese and other white women (more than 12 per cent). Indian and Pakistani women have rates close to that for white women (around nine per cent), while the rates for black or black British and Bangladeshi women are considerably lower.
Disabled people and employment
Table 5 Part-timers as percentage of all employed, Greater London, 2001
% Men % Women % All
Asian or Asian British
Indian 7.5 27.8 16.7
Pakistani 14.1 33.7 20.4
Bangladeshi 36.9 37.2 37.0
Other Asian 12.9 30.3 19.4
Black or black British
Black Caribbean 10.0 23.3 17.7
Black African 12.1 25.4 18.7
Other black 12.9 26.5 20.7
Chinese or other ethnic group
Chinese 10.0 21.4 15.6
Other ethnic group 14.0 26.3 20.1
Mixed
White and black Caribbean 10.9 24.9 18.3
White and black African 12.9 25.1 19.0
White and Asian 11.2 22.5 16.5
Other mixed 12.7 24.0 18.5
White
British 7.6 30.1 17.8
Irish 6.5 28.0 17.0
Other white 10.4 23.8 16.9
All ethnic groups 8.8 28.5 17.9
Source: Census 2001 Crown copyright
Emplo
[image:22.421.44.398.68.420.2]yment
Table 6 Self-employed as percentage of all employed, Greater London, 2001
% Men % Women % All
White
British 20.4 9.3 15.4
Irish 24.4 7.4 16.1
Other white 20.6 12.4 16.7
Asian or Asian British
Indian 21.7 9.0 16.0
Pakistani 24.1 9.1 19.2
Bangladeshi 14.7 4.2 11.7
Other Asian 18.3 8.4 14.6
Black or black British
Black Caribbean 14.2 3.5 8.1
Black African 13.9 4.8 9.4
Other black 11.4 3.8 7.0
Chinese or other ethnic group
Chinese 22.7 12.5 17.7
Other ethnic group 14.6 9.9 12.3
Mixed
White and black Caribbean 16.2 6.4 11.0
White and black African 15.4 7.8 11.6
White and Asian 17.8 9.2 13.8
Other mixed 17.6 9.9 13.6
All ethnic groups 20.0 9.0 20.0
Source: Census 2001 Crown copyright
Public sector employment
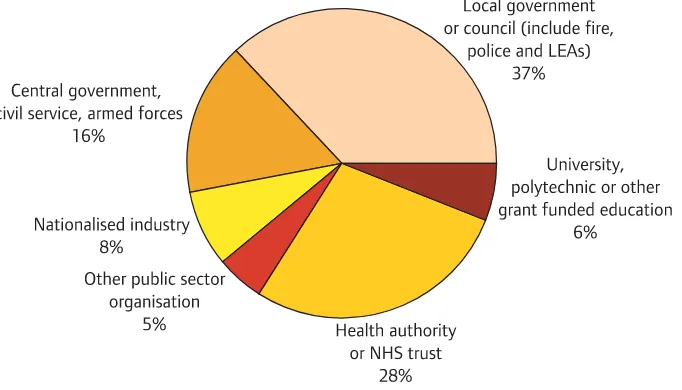
Chart 3 – BME public sector workers by type of employment Greater London, 2001/02
[image:23.421.31.372.349.544.2]Source: Annual Local Area Labour Force Survey 2001/02
Table 7 London employees in the public sector, by ethnic group, 2001/02
Total employees Public sector % employed
employees in public sector
White British 2,206,000 488,000 66
Other white 380,000 60,000 8
Indian 197,000 39,000 5
Pakistani/Bangladeshi 71,000 10,000 1
Other Asian 70,000 13,000 2
Black Caribbean 144,000 50,000 7
Black African 142,000 43,000 6
Other black 16,000 ** **
Mixed 47,000 11,000 1
Chinese and other 110,000 22,000 3
All groups 3,385,000 740,000 100
Twenty-six per cent of all public sector workers are from black and minority ethnic groups, including 13 per cent from black African or black Caribbean backgrounds, eight per cent from Asian backgrounds and five per cent from other black and minority ethnic groups.
Women are more likely to work in the public sector than men – altogether a third of all black and minority ethnic women workers are employed in the public sector, compared with 17 per cent of black and minority ethnic men. Rates are highest among black women of African and Caribbean backgrounds, 40 per cent of whom work in the public sector. Nearly 30 per cent of white women and 28 per cent of Asian women work in the public sector. Among men, black African and Caribbean men are also the most likely to work in the public sector – 24 per cent, compared with 12 per cent of Asian men and 15 per cent of white men.
London’s health and caring services are particularly reliant on black and minority ethnic employees. For instance, 39 per cent of health
professionals, such as doctors, dentists and pharmacists, are from black Emplo
yment
Chart 4 – Public sector employment by gender and ethnicity Greater London, persons of working age, 2001/02
and minority ethnic groups, as are 42 per cent of nurses and 54 per cent of nursing auxiliaries and assistants. Nearly a half of all care assistants and home carers are from black or minority ethnic groups. However, many of these are not employed directly by the public sector.
Altogether, more than a third (35 per cent) of all NHS employees in London are from black and minority ethnic groups.
Black and minority groups are very under-represented among teaching professionals in London, forming only 14 per cent of the total, compared with 29 per cent of the population of working age.
Contracted-out employment
Many black and minority ethnic workers in London are employed by private companies providing contract services for public sector
organisations. For instance, approximately 85,000 people are employed in services contracted by the NHS in London, in addition to the 175,000 who are directly employed2. While those employees transferred from the public
sector continue to receive public sector pay and conditions, new workers are often taken on at lower rates of pay and on much worse conditions. A research study on low pay in the East End found many differences in the pay and conditions of new staff compared with ex-public sector staff, covered by Transfer of Undertakings (Protection of Employment)
regulations (TUPE)3. For instance, non TUPE-protected staff working for a
large cleaning company contracted by NHS hospitals received less pay, no London weighting, fewer holidays, no sick pay and no pension
contributions. The research found that many people in these kinds of jobs had to work long hours, often in two jobs, to make ends meet.
Earnings
lower-paid occupations, but the pay gap between white and black and minority ethnic employees remains evident within most occupational groups, regardless of qualification levels. Low pay is particularly a problem for black and minority ethnic employees working in the private sector and for those working part-time.
On average, Indian men earn 78 per cent of median hourly earnings paid to white men, black Caribbean men earn 75 per cent, black African men 68 per cent and Pakistani men 64 per cent. (The sample size is too small to identify Bangladeshi and Chinese men separately.) The difference for women is less marked. Black Caribbean women earn around 91 per cent of white women’s hourly earnings, black African women 82 per cent, and Indian women 79 per cent. (The sample size is too small to identify Pakistani, Bangladeshi and Chinese women separately.)
The pay gap even persists for those with a degree: the median earnings of black and minority ethnic workers with this level of qualification or
higher are 84 per cent of the median hourly earnings of similarly qualified Emplo
yment
Chart 5 – The paygap between white and BME employees by type of employer, 2001/02 Greater London residents
white workers.
The pay gap between white and black and minority ethnic workers is far wider in the private sector than the public sector. On average, black and minority ethnic workers earn 72 per cent of the median for white workers in the private sector, compared with nearly 89 per cent in the public sector. However, the pay gap in central government, the civil service and the armed forces is little better than the private sector, at 74 per cent of the median.
The extent of low pay in the private sector is especially marked for black and minority ethnic workers. In 2001/02, 41 per cent of black and
minority ethnic workers in the private sector earned less than £7 per hour, compared with 25 per cent in the public sector.
Incomes
Black and minority ethnic people in Great Britain are much more likely than white people to be living in income poverty. The government’s measure of low income is below 60 per cent of the median. In 2001/2, Pakistani and Bangladeshi people of working age were more than three times as likely to be living on incomes below this level, after housing costs are taken into account, than white people4. Thirty per cent of working age
[image:27.421.35.377.284.366.2]black people of Caribbean origin and 44 per cent of other black people were living on low incomes after housing costs, compared with 23 per cent of Indian people and 17 per cent of white people.
Table 8 Percentage of London residents earning less than £7 per hour, 2001/02
All ethnic White Black and minority
groups groups ethnic groups
% % %
All sectors 26 23 37
Private sector 28 24 41
Public sector 21 20 25
Inner London has the highest rates of income poverty in Great Britain, with 48 per cent of children, 35 per cent of pensioners and 27 per cent of working age adults living in poverty. Rates of child poverty for minority groups are similar in London to elsewhere in Great Britain, but the ethnic dimension is more marked as minority groups account for a much larger share of the population. In 1998/99 to 2000/01, 73 per cent of children in Pakistani or Bangladeshi families were living in low-income households, as were 55 per cent of children in black households.
Union membership
Overall, union membership is much higher in the public sector than in the private sector. In London, 56 per cent of Londoners employed in the public sector are union members, compared with 14 per cent in the private sector. Membership rates are fairly similar for all ethnic groups, but in the public sector, rates are highest for Indian and black Caribbean workers (60 per cent and 58 per cent respectively) and in the private sector for Indian workers (20 per cent). In the NHS, 57 per cent of black and minority ethnic workers are union members, compared with 49 per cent of white employees.
Unionised workplaces are much more likely to have family friendly policies than non-unionised ones. For instance, 25 per cent of unionised
workplaces have improved maternity benefits over statutory benefits, compared with seven per cent of non-unionised workplaces5. Fifty-three
per cent of unionised workplaces have paternity leave arrangements, compared with 23 per cent of non-unionised ones.
A higher rate of union membership is also associated with employees with flexible working practices6. For instance, 41 per cent of those with
flexitime are union members, compared with an average of 30 per cent.
Emplo
Discrimination in employment
In reviewing progress in tackling racism at work during the last ten years, the TUC commissioned in-depth interviews with black workers in early 20037. It found that although positive moves had often been made
towards getting rid of racial discrimination in the workplace, the
interviewees often still had personal experiences of discrimination. These included being passed over for promotion, racist language and more subtle discrimination. The reasons black workers gave for the persistence of racial discrimination at work included the following:
●Too few black managers, making it difficult for black workers to voice
their concerns about race or be confident that their concerns would be taken up.
●Poor understanding of diversity issues among some employers, with
some managers misunderstanding or ignoring differences in culture, tradition, religion or behaviour.
●Managers failing to acknowledge some forms of racism, for instance
seeing verbal abuse as harmless banter.
●In many workplaces, cultural diversity is passively accepted rather than
positively embraced, leading black workers to feel they had to ‘blend in’ and play down their own needs and identities.
●A lack of transparency in organisations where, for example, no
explanation is given about why or how decisions are taken on promotion or pay. This means that discrimination remains hidden.
●Poor complaints procedures which are not independent or are
ineffective and do not result in any changes, with no follow-through. As a result, people suffer in silence, rather than risk being branded a ‘trouble-maker’.
In 2003, the Prime Minister’s Strategy Unit published a report setting out a strategy for raising the labour market achievements of minority ethnic groups8. This concluded that: ‘The educational and linguistic advantages
labour market experience from that of first-generation migrants. Evidence suggests that the second generation are faring somewhat better than the first generation, both in terms of access to professional and managerial jobs and in terms of earnings.’ However, it found that ‘native birth brings occupational improvement but does little to mitigate unemployment’.
The report proposed measures in four areas:
●action to build the employability of minority ethnic groups by
raising levels of educational attainment and skills
●action to better connect minority ethnic groups with work
●action to promote equal opportunity in the workplace
●action to ensure effective delivery
Emplo
Service delivery in the public sector
The Home Office publication Race equality in the Public Sectorreported the views that people hold about the service delivery and the treatment that they can expect from public sector service providers9. Generally, black
Caribbean respondents were much more likely to feel that they would be treated worse than other minority ethnic groups by a wide range of public services.
Just under two-fifths of all black respondents and 46 per cent of black Caribbean respondents felt that the police would treat them worse than other races, compared with 23 per cent of Asians and six per cent of white people. Between a quarter and just under a third of black people felt that the armed forces, courts, immigration authorities and the prison service would treat them worse than people from other minority ethnic
backgrounds. Bangladeshi respondents were more likely than people from other groups to feel that the local authority housing department and council would treat them worse than people of other races.
Perceptions of how the public sector would treat employees from different minority ethnic groups varied. Black respondents were most likely to feel that they would be treated worse than other people, with half stating that the police would treat them worse as employees, compared to just over 40 per cent of Asian respondents and eight per cent of white respondents.
Data from best value user satisfaction surveys shows that black and
Chart 6 – Percentage satisfied with local authority services, London boroughs, 2000/01
Source: Audit Commission
Public ser
vic
es and public r
epr
Education
Attainment at school
Inequalities in attainment for pupils from different ethnic groups are a cause of grave concern, both nationally and in London. Young people, especially boys, of black African, black Caribbean, Bangladeshi or Pakistani origin are particularly likely to lose out educationally.
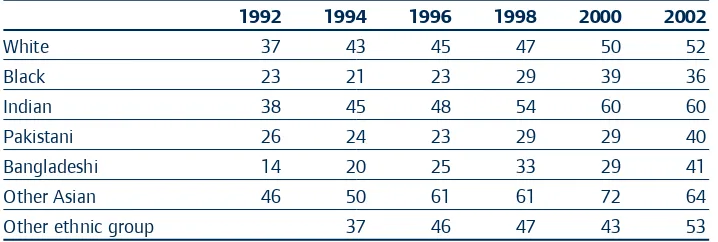
Between 1992 and 2000, there were increases in the attainments in GCSEs by pupils from all minority ethnic groups10. However, the rate of increase
[image:33.421.21.380.211.332.2]varied. The attainment of Asian pupils overall showed the largest increase, although there were differences among the pupils of this group. Indian pupils demonstrate the second highest attainment, with the Other Asian group more likely to achieve grades A*–C at GCSE level. Bangladeshi and Pakistani pupils have lower levels of attainment than other Asian students. Black pupils, while showing an overall increase between 1992 and 2000, demonstrate levels of attainment below those of pupils from other minority ethnic groups. While most of the groups continued to show an increase in attainment between 2000 and 2002, the black and other Asian groups showed a decrease.
Table 9 Attainment of five or more GCSE grades A*–C in Year 11 by minority ethnic groups, England and Wales 1992–2002
1992 1994 1996 1998 2000 2002
White 37 43 45 47 50 52
Black 23 21 23 29 39 36
Indian 38 45 48 54 60 60
Pakistani 26 24 23 29 29 40
Bangladeshi 14 20 25 33 29 41
Other Asian 46 50 61 61 72 64
Other ethnic group 37 46 47 43 53
Source: YCS cohorts 4–11, sweep 1. DfES, 2002
School exclusions
There continues to be a far higher proportion of black pupils excluded from schools nationally and in London, although the total number of exclusions and the differential between minority ethnic groups has been falling since 199711. In 2000/01, black pupils were more than twice as
likely as white pupils to be excluded permanently from schools in London and England. Asian pupils were much less likely to be excluded than other pupils.
Qualifications
Data from the Labour Force Survey shows that just under 41 per cent of all young people aged 16 to 24 years old in London are in full-time education. The Indian and Black African groups have the highest proportions of full-time students, at 59 and 61 per cent respectively, compared with black Caribbean and Bangladeshi groups where 48 and 45 per cent respectively participate in full-time education12. The lowest
participation rate is among young white people, of whom 32 per cent are in full-time education.
[image:34.421.43.397.223.299.2]Generally, younger people of all minority ethnic groups in London are better qualified than their elders, but some groups have benefited less from education than others. Overall, just over ten per cent of all 25 to 34-year-olds have no qualifications, compared with 25 per cent of 35 to 59- Education
Table 10 Permanent exclusions of compulsory school age and above, percentage of school populations, 2000/01
Region White Black Asian
Inner London 0.13 0.27 0.08
Outer London 0.15 0.34 0.03
London 0.14 0.30 0.04
England 0.13 0.31 0.05
year-olds. But within the younger age group, Bangladeshis stand out, with 42 per cent having no qualifications. Pakistanis also have much higher rates than the average (nearly 16 per cent). The rates for the mixed groups and the black or black British groups are slightly higher than the rates for Indian, Chinese and white groups.
Overall, 47 per cent of 25 to 34-year-olds have higher-level qualifications, compared with 30 per cent of 35 to 59-year-olds. Higher-level
qualifications are those at level 4/5, including first degree, higher degree, NVQ levels 4 and 5, HNC, HND, qualified teacher status, qualified medical doctor, qualified dentist, qualified nurse, midwife or health visitor.
Younger people of Chinese and Indian origin are most likely to hold higher qualifications, at nearly 70 per cent and 56 per cent respectively, while Bangladeshis (21 per cent), black Caribbeans (27 per cent) and other black young people (28 per cent) are the least likely to hold them. These latter groups have also shown the least improvement since the previous generation.
Teachers
A survey of local education authorities reported that overall, black teachers were less likely than white teachers to be in higher-grade positions13. However, there are differences at primary school level, where
Asian teachers were more likely to be in posts of responsibility than white teachers (56 per cent and 47 per cent respectively) and at secondary school level, 45 per cent of black teachers were in posts of special responsibility, compared with 33 per cent of white teachers. In 2001/02, seven per cent of trainee teachers nationally were of minority ethnic origin. The Teacher Training Agency has set a target of nine per cent of trainee teachers to be from black and minority ethnic communities by 2005/0614.
Education
Table 11 Percentage of resident population with no qualifications and with higher qualifications, Greater London, 2001
No qualifications Higher-level
qualifications (level 4/5)
25–34 35–59 25–34 35–59
% % % %
Asian or Asian British
Indian 8.8 27.7 56.1 30.6
Pakistani 15.6 33.3 47.3 30.8
Bangladeshi 42.1 66.8 21.1 15.4
Other Asian 11.7 16.2 37.9 35.1
Black or black British
Black Caribbean 9.6 20.6 27.4 23.1
Black African 10.9 13.0 45.3 45.1
Other black 10.8 17.0 28.3 26.1
Chinese or other ethnic group
Chinese 8.3 31.4 69.6 41.4
Other ethnic group 20.3 28.3 51.5 43.7
Mixed
White and black Caribbean 15.0 23.8 27.5 22.9
White and black African 13.6 18.9 39.9 34.5
White and Asian 10.4 19.6 53.7 36.0
Other mixed 10.3 19.5 50.5 39.3
White
British 8.7 25.1 46.1 27.1
Irish 8.3 32.5 49.5 26.8
Other white 9.6 21.0 60.0 45.8
All ethnic groups 10.2 24.9 47.3 30.1
black and minority ethnic groups, compared with 6.9 per cent in England as a whole. In 2000/01, 39 per cent of college students in London overall were of black and minority ethnic origin; this contrasts with the 14 per cent average for England. Further findings included:
●Black and minority ethnic staff are under-represented at managerial
level in England; six per cent of black staff are managers compared with nine per cent of white staff.
●There are only 178 black and minority ethnic governors out of 2,178
governors (eight per cent) in 134 colleges.
●Fifteen per cent of colleges set targets for the employment and
progression of black and minority ethnic staff.
●Fifty-three per cent of colleges use ethnic monitoring data.
●Seven per cent of part-time inspectors and three per cent
of full-time inspectors are black and minority ethnic.
●Twenty-two per cent of white further education students live in
[image:37.421.24.375.66.170.2]deprived areas compared with 76 per cent of Black African students, 73 per cent of Bangladeshis and 67 per cent of Afro-Caribbean students.
Table 12 Proportion of teachers by grade and ethnic group, 1999/2001
Grade Black and minority ethnic White
% %
Head teachers 2 5.2
Deputy head teachers 4 6.4
Posts of responsibility 45 48
Mainscale posts 48 41
All teachers 100 100
Health and social services
Health status
Evidence from many sources, including the 1999 Health Survey for England, has found that certain minority ethnic groups are likely to have poorer health than others, as well as demonstrating the link between poor health and deprivation. The findings from the 2001 census show that there are higher proportions of both limiting long-term illness and people in poor health among most black and minority ethnic groups.
Table 13 illustrates this for the population aged 16 to 49 in London. The highest rates of limiting long-term illness are reported by other black people (12 per cent) and Bangladeshis (11.8 per cent), but most other black and minority ethnic groups have higher rates than white British people (8.8 per cent). The exceptions are Indian (7.8 per cent) and Chinese people (4.4 per cent).
A similar pattern is evident for the proportion of Londoners who were not in good health at the time of the census. Just over five per cent of white British people were not in good health, compared with more than seven per cent of Bangladeshis, Pakistanis, other black people and mixed White, black African and Caribbean groups. The proportions of Indian, black African and Chinese people who were not in good health were all lower than the white British average.
Mental health
Black and minority ethnic groups continue to experience inequalities and discrimination in accessing mental health services. The National Institute for Mental Health reported that: ‘Black and ethnic minority people are more likely to be
Table 13 Percentage of residents aged 16–49 reporting limiting long-term illness and not in good health, Greater London 2001
% with limiting % not in good
long-term illness health
Asian or Asian British
Indian 7.8 4.7
Pakistani 10.5 7.1
Bangladeshi 11.8 7.6
Other Asian 9.7 5.7
Black or black British
Black Caribbean 10.6 6.8
Black African 8.0 4.3
Other black 12.0 7.5
Chinese or other ethnic group
Chinese 4.4 2.7
Other ethnic group 7.9 5.6
Mixed
White and black Caribbean 11.6 7.3
White and black African 10.7 7.1
White and Asian 9.6 6.3
Other mixed 9.8 6.7
White
British 8.8 5.2
Irish 10.6 7.2
Other white 6.6 4.5
All ethnic groups 8.7 5.3
●diagnosed as suffering from severe mental illness than depression ●admitted to secure hospitals and under sections of the Mental Health Act ●treated with medication than by the “talking” therapies.’16
The report called on the NHS and social care services, service users and carers, voluntary and other non-governmental organisations working within mental health to work in partnership with the black and ethnic minority communities to ensure the success of the proposals.
The proposals aim to:
●reduce and eliminate inequalities in the experience of people by
improving the quality of care they receive
●develop the NHS workforce to embrace diversity
●engage the community and build capacity by promoting the role of
community development workers.
In research commissioned by the Mayor on mental health services in London, the likelihood of being admitted to hospital for psychotic conditions was found to be higher in areas with a high percentage of black and minority ethnic residents17. Also, average lengths of stay in
hospital were longer in these areas. People from black and minority ethnic communities were the most likely to be cited as having difficulty accessing mental health services, because of cultural issues or language problems. Fewer than half of mental health services provided information about themselves in languages other than English and a third said they had difficulty getting translation services.
Nurses
Nationally, just under five per cent of nurses registered in 2000/01 with the Nursing and Midwifery Council were black and just under three per cent were Asian18. At current rates of application and acceptance, there is
likely to be little significant change in the proportion of nurses from black
The 2002 Survey of Royal College of Nursing (RCN) members, Valued Equally, identified issues of workload, bullying and harassment. It also identified a number of issues which affect nurses from all backgrounds, such as pay, career progression, feeling undervalued and unappreciated. The RCN reports that six per cent of all of their respondents were of black and minority ethnic origin and of these, 40 per cent were black African or Caribbean, and 30 per cent were of Asian (including Chinese) origin.
The survey found that black and minority ethnic nurses were more likely than white nurses to:
●work full-time: 91 per cent of Afro-Caribbean nurses and 57 per cent of
Asian nurses work full-time, compared with 36 per cent of white nurses.
●work unpopular shifts
●express dissatisfaction with their working hours
●have additional jobs (particularly nurses of Afro-Caribbean origin) ●leave their job because of negative factors, e.g. bullying or harassment ●work in mental health.
Black and minority ethnic nurses were:
●more likely to act up to a higher grade (two-thirds of all nurses who do
so reported not being paid for it)
●less likely to feel that they are working on an appropriate grade ●progressing to higher grades at a slower rate than white nurses
●more likely to feel that their contribution in the workplace is valued by
their employers than by peers
●more likely to experience harassment or bullying by other staff
members. (This survey found that, among respondents employed by the NHS, 31 per cent of the Afro-Caribbean nurses, 33 per cent of mixed race and 26 per cent of Asian nurses experienced this, compared with 15 per cent of British white nurses)
●less likely to have been bullied or assaulted by patients or clients than
white nurses.
structure, for instance where more minority ethnic nurses were the breadwinner for their household; discrimination in access to career progression; and different modes of working.
As a response to the shortage of nurses and problems in retention and recruitment of nurses in the UK, there has been a campaign for
recruitment from overseas. The targeted areas are the Philippines, India and Spain, although there are nurses coming to the UK from other areas, such as the Caribbean and African countries. In 2001 the RCN found that just under two per cent of the nurses who participated in their survey had first registered as qualified nurses overseas; in 2002 this rose to just over five per cent.
Social services – children looked after
There is little data published yet on the availability and use of social services for black and minority ethnic groups. An exception is the ethnicity of children looked after by local authorities (in care). This clearly shows the over-representation of black or black British children, in comparison with their share of the national population.
In March 2002, seven per cent of children looked after in England were black or black British, more than twice the proportion they make up of the population in this age group. A further seven per cent were of mixed origin, compared with three per cent in the population. Only two per cent were Asian or Asian British, compared with more than six per cent in the population20.
Table 14 Number and percentage of children looked after, by ethnic origin, England, at 31 March 2002
Number % % of total
population
Asian or Asian British 1,400 2 6.4
Indian 330 1 2.4
Pakistani 500 1 2.4
Bangladeshi 200 0 1.0
Other Asian 340 1 0.6
Black or black British 3,900 7 2.8
Caribbean 1,500 3 1.1
African 1,600 3 1.4
Other black 840 1 0.3
Chinese or other ethnic Group 1,400 2 0.8
Chinese 90 0 0.4
Other ethnic group 1,300 2 0.4
Mixed 4,400 7 3.1
White and black Caribbean 1,700 3 1.3
White and black African 290 0 0.3
White and Asian 540 1 0.8
Other mixed 1,800 3 0.6
White 48,700 82 86.9
British 46,400 78 84.8
Irish 520 1 0.4
Other white 1,700 3 1.7
All children 59,700 100 100.0
Housing
Tenure
There are markedly different tenure patterns among black and minority ethnic groups in London. Indian people are the most likely to own their homes (74 per cent), followed by Chinese and Pakistani people (both around 58 per cent). Those most likely to be in social rented housing (council or housing association property) are Bangladeshis (63 per cent), and black African and other black groups (around 57 per cent). Private renting is highest among Chinese and other Asian groups (nearly 21 per cent) and Pakistanis (nearly 20 per cent).
Housing conditions
The housing conditions of different minority ethnic groups are partly a reflection of these tenure patterns. Generally, groups in social rented housing are less likely to lack central heating than owner-occupiers and private renters. Those more represented in the private sector are more likely to be sharing facilities with other families. The groups most likely to lack central heating are white, Chinese and black African households, while those most likely to be sharing are black African and Bangladeshi households.
Housing in the 2001 census has been analysed using a new ‘occupancy rating’ which relates the number of living rooms, kitchens and bedrooms available to the number of rooms required by the household, based on the relationship between them and their ages21. This results in a measure of
Table 15 Tenure of households, by ethnic group, Greater London, 2001
All owned All social rented All private rented Rent free
% % % %
Asian or Asian British
Indian 74.3 11.2 12.7 1.9
Pakistani 57.7 20.3 19.6 2.4
Bangladeshi 25.7 63.1 8.5 2.7
Other Asian 57.5 18.8 20.7 3.0
Black or black British
Black Caribbean 44.6 46.9 7.5 0.9
Black African 23.5 57.0 16.4 3.2
Other black 31.2 57.5 9.8 1.5
Chinese or other ethnic group
Chinese 58.1 17.5 20.7 3.7
Other ethnic group 35.9 27.4 32.4 4.3
Mixed
White and black Caribbean 34.1 51.1 13.0 1.8
White and black African 28.7 45.7 22.3 3.3
White and Asian 51.9 23.8 21.2 3.1
Other mixed 42.8 31.5 22.5 3.1
White
British 61.9 23.2 13.4 1.5
Irish 52.1 32.6 13.6 1.7
Other white 44.7 17.6 34.8 2.9
All ethnic groups 56.5 26.2 15.5 1.8
Housing
Table 16 Housing conditions, by ethnic group, Greater London, 2001
No central Sharing with Lacking one
heating other households room or more
% % %
Asian or Asian British
Indian 2.4 0.3 27.6
Pakistani 3.6 0.4 38.0
Bangladeshi 3.5 2.2 61.7
Other Asian 3.9 0.8 44.0
Black or black British
Black Caribbean 4.4 0.6 27.6
Black African 5.9 2.0 52.9
Other black 5.5 1.2 39.5
Chinese or other ethnic group
Chinese 6.2 1.1 31.5
Other ethnic group 5.5 1.6 39.7
Mixed
White and black Caribbean 5.6 0.8 31.3
White and black African 6.2 1.7 45.4
White and Asian 5.4 1.0 28.6
Other mixed 5.9 1.3 35.0
White
British 6.6 0.4 12.4
Irish 7.1 0.6 17.2
Other white 5.8 1.2 28.4
All ethnic groups 5.9 0.6 21.3
Findings from a recent review of research on housing and black and minority ethnic communities for the Office of the Deputy Prime Minister included the following22:
●Black heads of households were three times as likely to have
experienced homelessness as white heads of households, but Indians, Pakistanis and Bangladeshis were less likely.
●Black and minority ethnic homeless people were less likely to be on
the streets, as they stayed with friends and relatives and were therefore less visible.
●Racial harassment associated with residence remains widespread and
can have a negative effect on household choice of residential area.
●Black and minority ethnic housing and staffing strategies are not
Police and crime
Police officers
Despite efforts by the Metropolitan Police Service to increase the number of police officers from black and minority ethnic groups, they still formed only 5.5 per cent of the total in March 2003, against the target of 7.9 per cent set for this date23. However, the profile of support and civilian staff
is more representative of London’s population. At the end of March 2003, nearly 23 per cent of traffic wardens, 29 per cent of police community support officers and 19 per cent of civilian staff were from black and minority ethnic groups.
In England and Wales as a whole, fewer than three per cent of police officers were from black and minority ethnic groups in 2002, compared with 8.6 per cent of the population, and they were more likely to be constables than in the higher ranks.
P
olic
[image:48.421.45.397.348.495.2]e and crime
Table 17 Police officer strength (full-time equivalent), by sex, minority ethnic group and rank, England and Wales, 31 March 2002
Males Females All minority ethnic groups
Number % of total
Chief Constable 47 6 1 1.9
Assistant Chief Constable 141 10 2 1.3
Superintendent 1,173 83 23 1.8
Chief Inspector 1,433 117 24 1.5
Inspector 5,717 479 99 1.6
Sergeant 16,621 1,953 369 2.0
Constable 79,351 20,137 2,844 2.9
All ranks 104,483 22,784 3,362 2.6
Stop and search
During 2002/03, people from black and minority ethnic groups in London were nearly four times as likely as white people to be subject to a police stop and search24.
Recommendation 61 of the McPherson Report of the Stephen Lawrence Inquiry proposed that all stops and searches, including voluntary stops, should be recorded. The record should include the reason for this stop, the outcome and the self-defined ethnic identity of the person stopped. A copy of the record should be given to the person stopped. This is being piloted in seven areas across the country, including Hackney, commencing in April 200325.
Victims of crime
Nearly 10,000 racially aggravated offences were reported to the
Metropolitan Police Service in 2002/03. More than 3,000 of these were crimes of violence, more than 1,400 were racially aggravated criminal damage and the rest were racial harassment incidents26.
The British Crime Survey began regularly to monitor black and minority ethnic perspectives and experiences of crime in 200027. The survey
reported some of the differences between ethnic groups in 1999:
●People of black and minority ethnic origin are more at risk of household
crime than other groups, with Indian people being at most risk.
●People of black and minority ethnic origin are three times more at risk
of being a victim of mugging than white people.
●The risk of being a victim of a racial offence was 2.2 per cent for black
African and black Caribbean people, 3.6 per cent for Indian people and 4.2 per cent for Bangladeshis and Pakistanis.
●Thirty-three per cent of Asian and 28 per cent of black respondents
●Thirty-nine per cent of black men aged under 30 had been stopped
in a car by police, compared with 25 per cent of white men in that age group.
●Thirty-two per cent of black males under 25 had been stopped while
on foot by police compared with 21 per cent of white males.
●Black people who had been stopped by police were the most likely
of all groups to be dissatisfied with the way they were treated by the police at that time.
P
olic
Voting and public representation
Voter registration
London has the highest levels of non-registration for voting in the UK28.
The Electoral Commission has reported that voter registration is low among certain groups in the population: urban residents, younger, working class, and people of black and minority ethnic origin. The commission concluded that black and minority ethnic people may be disproportionately affected by the reasons not to register to vote – such as: alienation due to social exclusion, avoidance of registration from fear of what the registration information could be used for, or lack of privacy – and feeling that the political system holds nothing for them29.
Since the 1960s, black and minority ethnic voter registration has been increasing. However, there are differences in rates of registration among black and Asian groups. The black Caribbean and black African groups have one of the lowest levels of registration30. People of Indian origin are
the most likely of the Asian groups to vote, with Bangladeshis and Pakistanis less likely.
Representation
Black and minority ethnic groups in London form nearly 29 per cent of London’s population, yet fewer than ten per cent of the London borough councillors elected in 2001 are from black and minority ethnic groups. Of the black and minority ethnic councillors in London, seven per cent are of Asian origin and just under three per cent are of black Caribbean or African origin.
Four of the 87 members of the European Parliament representing Britain are of black and minority ethnic origin; this is just under five per cent33. In
spring 2000 there were 14 Asian life peers and four black life peers34.
There is an under-representation of black and minority ethnic groups, and especially women from these groups, on public bodies nationally. Just under five per cent of the 29,499 people on the boards of public bodies in March 2001 were black and minority ethnic appointees. Nearly 62 per cent of the black and minority ethnic appointees were men35.
V
oting and public r
epr
[image:52.421.47.396.227.356.2]esentation
Table 18 Local authority councillors, by ethnic group, England and Wales and London, 2001
England and Wales London boroughs
Ethnic origin Number % Number %
White 20,612 97.4 1,817 89.4
Mixed 73 0.3 13 0.6
Asian/Asian British 358 1.7 142 7.0
Black/black British 94 0.4 55 2.7
Chinese 11 0.1 2 0.1
Other ethnic group 8 – 4 0.2
100% 21,156 2,033
References
1 Disabled people and the labour market, an analysis of Labour Force Survey data for
London 2001/02, GLA DMAG briefing 2003/1, January 2003
2 Claiming the health dividend: unlocking the benefits of NHS spending, Anna Coote,
King’s Fund Report 2002
3 Mapping low pay in East London, a report written for Unison and TELCO’s Living
Wage Campaign by Jane Wills, Department of Geography, Queen Mary, University of London, September 2001
4 Department for Work and Pensions, Households Below Average Income 2001/02,
March 2003
5 TUC women at work and union recognition in Towards Equality,
Fawcett Society, June 2001
6 Labour Force Survey, reported in Labour Market Trends, July 2000 7 Black Voices at Work, Trades Union Congress, April 2003
8 Ethnic minorities and the labour market, Prime Minister’s Strategy Unit, March 2003 9 Race Equality in public services, Home Office Communication Directorate,
November 2002
10 Youth Cohort Study, Cohorts 4-11, sweep 1, DfES 2002
11 Permanent exclusions from maintained schools in England, DfES, November 2002 12 Annual Local Labour Force Survey 2001/02 (from DMAG briefing, table A 22) 13 Ross, A. Institutional racism: the experience of teachers in schools, Institute for Policy
Studies in Education, London Metropolitan University, September 2002
14 Teacher Training Agency Corporate Plan, 2002-05
15 Ross, A. Institutional racism: the experience of teachers in schools. Institute for Policy
Studies in Education, London Metropolitan University. September 2002)
16 Inside/Outside. A Vision for Improving Mental Health Services for Black and Minority
Ethnic Groups, National Institute for Mental Health, March 2003
17 Availability of mental health services in London, forthcoming publication by Dr Foster
for the Mayor of London.
18 UKCC Annual Report 2000- 2001.
19 Nursing and Midwifery Admission Services Statistical Report, 2000, reported in:
Buchan, J and Seccombe, I. Behind the Headlines, A review of the UK nursing labour market in 2001, Royal College of Nursing, February 2002
20 Children looked after in England, 2001/2002, Bulletin 2002/22, DOH Crown
copyright 2002
21 The room requirement is calculated as follows: a one person household is assumed
of the same sex, each pair of children aged under 10 remaining, and each remaining person (either aged 10 to 15 or under 10). Rooms do not include bathrooms, toilets, halls or landings or rooms shared with other households.
22 Housing and Black and Minority Ethnic Communities, Review of the evidence base,
Malcolm Harrison and Deborah Phillips, University of Leeds, Office of the Deputy Prime Minister, May 2003.
23 Metropolitan Police Statistics, May 2003 24 Metropolitan Police Statistics, May 2003 25 Metropolitan Police Authority
26 Metropolitan Police Statistics, May 2003
27 Clancy, A. et al. Home Office Research Study 223, Crime, Policing and Justice: the
experience of ethnic minorities, Findings from the 2000 British Crime Survey, Home Office Research, Development and Statistics Directorate, October 2001
28 The Electoral Reform Society, Electoral Engagements, GLA Elections, May 2000, ERS,
London, 2000
29 The Electoral Commission, Voter Engagement among Black and Minority Ethnic
Communities, July 2002
30 The Electoral Commission, Voter Engagement among Black and Minority Ethnic
Communities, July 2002
31 Operation Black Vote, 2001 32 Operation Black Vote, 2001 33 Operation Black Vote, 2001
34 The Report of the Commission on the Future of Multi Ethnic Britain, The Parekh
report, Profile Books Ltd, 2000