The Good
Childhood
Report 2014
T
h
e G
o
od C
h
ild
h
o
od R
ep
o
rt 2
0
3 The Good Childhood Report 2014
Introduction
T
h
e G
o
od C
h
ild
h
o
od R
ep
o
rt 2
0
5
Foreword
The Children’s Society has been supporting children’s well-being for over a century, putting their voices right at the very heart of our work. Children’s well-being is so important not just for children themselves and the adults they become, but because
it serves as a reflection on the place we hold for children in society.
Well-being is about so much more than happiness, going right to the very heart of a good quality of life. And a real understanding of well-being must also take into account the factors associated with it; the potential drivers. Children with low well-being are not grumpy teenagers experiencing the everyday ups and downs of growing up. Our research highlights stubborn and persistent issues of bullying, insecurity and anxiety; children growing up with little hope for their future.
The good news is that the majority of children in this country continue to be satisfied with their lives. Yet around 9% of children aged eight to 15 years have low life satisfaction which is a statistic none of us can
afford to ignore. Our annual state-of-the-nation report on children’s well-being seeks to understand more about this. This year’s report confirms gender variations in well-being – with girls showing lower levels overall often driven by concerns with the way they look. It also shows that the ages of 14 and 15 continue to be the ages of lowest well-being.
In this year’s report, our third annual Good Childhood Report, we explore new work on the relationship between parents and their children’s well-being and highlight new international evidence that shows the UK is behind the majority of countries in terms of children’s well-being.
We are proud that our research with the University of York has become one of the most extensive programmes on children’s well-being conducted globally. Our surveys of over 50,000 children have helped draw attention to important trends. Today, as always, we are ambitious for all children. In a period where the impact of austerity measures are disproportionately affecting low income families with children, it is critical to keep focused on how young people are faring. We are determined, through our campaigning, commitment and care, to give every child the greatest possible chance in life.
Matthew Reed
7
Contents
Foreword
1
Introductionp9
Part one
2
The current state of children’s subjective well-being: Overview and variations p15
3
Trends in child subjective well-being over time p23
4
Trends across countries p29
Part two
5
Factors associated with children’s subjective well-being: What children do p33
6
Factors associated with children’s subjective well-being: What children have p41
7
Factors associated with children’s subjective well-being: Parents p51
8
Factors associated with children’s subjective well-being: Parenting p57
Conclusion
9
Concluding comments p63
10
References9
The Good Childhood Report 2014 is the third in a series of annual reports published by The Children’s Society about how
children in the UK feel about their lives.
This year’s report contains new findings from our nine-year
programme of research on children’s well-being, involving around 50,000 children. This work is carried out in collaboration with the University of York and has become the most extensive national research programme on children’s subjective well-being in the world.
The objective of each report is to focus on children’s subjective well-being, drawing on the most recent evidence available for the UK, plus some comparative findings from other countries.
At the same time, the report provides an opportunity to place our new findings within the context of what we have learned from our well-being research programme since it began in 2005. The previous reports have covered a wide range of topics in relation to children’s subjective well-being and some key findings from these reports are presented in Box 2.
In last year’s report we presented a chart illustrating what life is like for children with low subjective well-being. This summarises many of the themes covered in our research programme to date, and so we have reproduced this chart as Figure 1.
1. Introduction
Box 1: What is ‘subjective well-being’?
Subjective well-being is a person’s own evaluation of how they feel about their lives. It is often thought of as consisting of two components. The first component is about how satisfied people are either with their life as a whole or about particular aspects of their life (e.g. family relationships). The second component focuses more on people’s day-to-day moods and emotions (e.g. feelings of happiness).
There is also a related concept of ‘psychological well-being’. This incorporates a number of different aspects (e.g. sense of autonomy and sense of purpose in life). Whilst we recognise the importance of this concept, this report focuses on subjective well-being (satisfaction and emotions) because at present most of the surveys we analyse ask about this.
Often subjective well-being questions use a scale, such as from 0 to 10, which people can use to say how satisfied or happy they are. Many of the questions we have asked of children have been in this format. In this report we use the term ‘low subjective well-being’, usually focusing on the children with the lowest scores for subjective well-being questions.
0% 20% 40% 60% 80% 100%
Average to high well-being Low well-being
Feels there are people who support them
Has a lot less money than their friends Likes the way they look Does not feel free to express their opinions Does not look forward to going to school Feels their life has a
sense of purpose Family does not get along well together Does not feel safe at home Does not have enough friends Has been bullied more than three times in the past three months
% of children
Figure 1: Low well-being and associated issues
10 The Good Childhood Report 2014 Introduction
1 Where possible we make use of data for the whole of the UK – for example from the Millennium Cohort Study. However some of the analysis in the report only covers England, Scotland and Wales, and other analysis only covers England. Please refer to Box 3 on data sources, and the information on data sources contained underneath each figure and table presented in the report.
Around 9% of children in the UK aged eight to 15 years have low life satisfaction. Using other measures of subjective well-being the proportion is between 5% and 10%.
Children’s subjective well-being varies considerably with age. Around 4% of eight-year-olds have low life satisfaction compared with around 14% of 15-year-olds. It appears that ages 14 to 15 represent a low point for subjective well-being and that there are slightly higher levels of well-being for young people in the 16 to 17 age group.
There is some evidence of gender variations in subjective well-being, with girls often tending to have slightly lower well-being than boys.
Socio-demographic factors, such as household income or family structure are often significantly associated with subjective well-being but only explain a relatively small amount of the variations in subjective well-being between children.
From analysis of The Good Childhood Index we know that children feel much happier about some of aspects of their lives – such as family relationships, than others – such as the way that they look. Children’s satisfaction with some of these aspects varies considerably between the ages of eight and 15 and by gender. The Good Childhood Index was developed by The Children’s Society and includes 10
questions asking about different aspects of life that children have told us are particularly important for their well-being.
The quality of family relationships emerges as one of the most important influences on children’s subjective well-being. For example, children living with both birth parents tend to have slightly higher well-being than children living in other family arrangements, but again this factor only explains around 2% of the variation in subjective well-being, while a simple question about quality of family relationships explained around 20% of the variation.
A second important factor highlighted by our research is children’s satisfaction with the amount of choice they have in their lives, which consistently emerges as having a strong link with their sense of well-being.
While household income has a small (albeit significant) association with children’s subjective well-being, other measures of children’s material circumstances show a much stronger association, explaining as much as 9% of the variation in their subjective well-being.
Events in children’s lives can have an impact on their well-being. Recent changes in family structure, for example, are linked with significantly lower than average well-being. Recent experiences of being bullied also appear to have a substantial impact on children’s subjective well-being.
11 The Good Childhood Report 2014
Introduction
1.1 Overview of the 2014
report and key findings
This report makes a timely addition to ongoing debates about the well-being of children in the UK, and is split into two broad themes.
The first part of the report presents an updated picture of overall levels of subjective well-being in the UK1. We:
Provide new findings on overall levels of subjective well-being
Analyse new data on how children’s subjective well-being varies according to individual and household characteristics
Update and expand our time trends analysis – using the latest evidence
Present new findings on how children’s subjective well-being varies between countries.
The second part of the report looks at new evidence on four different factors that are associated with children’s subjective well-being:
Children’s activities and behaviours
Material conditions – deprivation, relative wealth and changes over time.
Parental subjective well-being and mental health
Parenting behaviours.
Some key findings on these topics are as follows:
Children in England are faring slightly less well in terms of subjective well-being than children in the other nations of the UK; and children in England are faring poorly in terms of subjective well-being compared to other countries within and outside Europe, ranking ninth out of 11 countries surveyed.
Children in England fare particularly poorly in terms of satisfaction with the way they look, compared to children in a sample of other countries around the world. This finding supplements other evidence of a significant age-related decline in satisfaction with this aspect of life in England, especially for girls.
There is some evidence of a gender gap developing recently in children’s subjective well-being in the UK, with girls tending to have lower well-being than boys.
The pattern of increases in children’s subjective well-being seen during the late 1990s and early 2000s has ended and, in the period 2008 to 2011 (the most recent years for which time trend data is available) levels of children’s subjective well-being appear to have plateaued (neither increasing nor decreasing).
There are associations between how children spend their time and their subjective well-being. Children who participate more often in sports and related activities tend to have higher well-being. On the other hand, our analysis finds no evidence of a negative association between use of computer technology and subjective well-being. In fact, children aged 11 years old who engaged in this activity relatively frequently were significantly more satisfied and happy with their lives than children who never did so.
12 The Good Childhood Report 2014 Introduction
There are indications that the recession is impacting children’s well-being – those who perceive their families as having been impacted by the economic crisis have lower well-being.
There are significant links between children’s levels of subjective well-being and that of their parents. There is also evidence of a link between parental mental health problems and lower levels of child subjective well-being.
There is evidence of a significant association between parenting behaviours and children’s subjective well-being. Young people aged 14 to 15 whose parents more frequently provided emotional support, physical care, educational support and supervisory monitoring tended to have higher levels of subjective well-being. Of these factors, the availability of emotional support seemed to make the most difference for this age group.
1.2 Notes on data sources
and statistics
1.2.1 Data sources
The report makes use of the best and most up-to-date evidence available on children’s subjective well-being. Much of this data comes from our own research programme, including participation in the international Children’s Worlds survey. However, we also make use of available data from other sources including two major UK studies - Understanding Society and the Millennium Cohort Study. More information on each of the data sources used is provided in Box 3.
1.2.2 Statistical testing
We have used a range of appropriate statistical tests to support the findings presented in this report. All comparisons highlighted in the report (e.g. gender differences) are based on accepted tests of statistical significance using a 99% confidence level unless otherwise stated. Weighted data sets have been used for analysis of the Children’s Worlds survey and Millennium Cohort Study. Because this is a non-technical report we have avoided using technical language regarding these tests in the main text, although some
13 The Good Childhood Report 2014
Introduction
The main data sources that we have analysed for this report are as follows:
Children’s Worlds survey
(See www.isciweb.org for further details)
Children’s Worlds is a new international survey of children’s well-being. The survey aims to collect solid and representative data on children’s lives and daily activities, their time use and in particular on how they feel about and evaluate their lives (and specific aspects of their lives). Some of the data used in this report is from a large-scale pilot of the survey conducted with over 16,000 children aged around 12 years old in 11 countries across five continents. Other data is from the England component of the first full wave of the survey in 2013/14. The survey in England covered a representative sample of over 3000 children in Years 4, 6 and 8 in schools. We also conducted the survey with an additional sample of around 1000 children in Year 10, which is referred to as ‘The Children’s Society survey 2014’.
British Household Panel Survey (BHPS) and Understanding Society
(See www.iser.essex.ac.uk/bhps and www.understandingsociety. ac.uk/about for further details) The BHPS was a longitudinal study consisting originally of a sample of 5500 households in Britain
running from 1991 to 2009. It subsequently became part of a new ongoing longitudinal study called Understanding Society covering 40,000 households. From 1994 the BHPS incorporated a youth questionnaire for children aged 11 to 15 which include some questions on subjective well-being. These questions have been continued with children aged 10 to 15 in the Understanding Society survey.
Millennium Cohort Study (MCS)
(See www.cls.ioe.ac.uk for further details)
The MCS is a survey following the lives of around 19,000 children born in the UK in 2000 to 2001. So far, five waves of the survey have been carried out when children were around the ages of nine months, three years, five years, seven years and 11 years. The data analysed for this report is from the fifth wave when the children were aged 11. We make use of information about subjective well-being and about various aspects of their lives provided by children and also some information gathered from their parents and teachers.
In addition to the above we also cite some findings on subjective well-being from the Health Behaviour of School-aged Children study (HBSC).
The Children’s Society quarterly surveys
The Children’s Society has conducted household surveys in England with both parents and children aged eight to 15 since 2010. These were initially conducted every three months, and are now conducted every six months. In these surveys, we ask questions about the well-being of both parents and children. The surveys also offer a chance to collect data on children’s well-being together with data on the household, such as income and occupation of the parents or carers. The survey covers 2000 households in England, Scotland and Wales, and is socio-economically representative of these countries.
Children’s quotes from consultations
The Children’s Society conducts well-being consultations with children and young people in various locations. These consultations usually consist of a well-being survey followed by a face-to-face group session in which survey findings are interrogated and explored. Recent consultations have taken place in Portsmouth, the Isle of Wight, Frome and Cheshire East, and have included over 20,000 children and young people. Quotes from these group sessions can be found throughout the report to illustrate the statistical points further. To learn more about our well-being consultations, please contact us at: well-being@childrenssociety.org.uk
14
Part one
15
2. The current state of children’s
subjective well-being:
Overview and variations
2.1 Children’s overall
levels of subjective
well-being
In previous issues of The Good Childhood Report, we have presented findings on different aspects of children’s subjective well-being including satisfaction and happiness with life as a whole and day-to-day feelings. Here we present updated findings on these aspects using new data from the Children’s Worlds survey in England with children in Year 6 (10 to 11 years old) and 8 (12 to 13 years old). Box 4 shows the
questions used in this survey to cover subjective well-being:
2.1.1 Satisfaction with life as a whole
In line with our previous work, we found that children tended to rate their life satisfaction quite highly. Children in Years 6 and 8 scored a mean of 8.5 out of 10 on the life satisfaction scale, while around 7% of children in this age group had low life satisfaction (less than five out of 10). There were age patterns here – the percentages of children with
low life satisfaction were around 6% for Year 6 and around 8.5% for Year 8. However there was no statistical difference in life satisfaction between girls and boys.
2.1.2 Day-to-day feelings
Children also reported mostly relatively high levels of recent positive moods and feelings. Mean scores for the six questions asked (see Box 4) ranged from 8.6 out of 10 for ‘happy’ and ‘full of energy’ to 7.9 out of 10 for ‘calm’. There was a significant age difference for all of these measures and the differences were strongest for feeling ‘full of energy’ which declined from a mean score of 8.9 out of 10 in Year 6 to 8.2 out of 10 in Year 8. There were also significant gender differences for all of these questions, with boys tending to have higher mean scores than girls, except the question about feeling calm for which there was no significant gender difference.
2.2 Variations in
children’s subjective
well-being
So far we have looked at the evidence on children’s overall subjective well-being and variations by age and between girls and boys. It is also important to look at variations according to other individual and family factors as we may be able to identify particular sub-groups of the child population with much higher or lower than average levels of subjective well-being.
Life satisfaction2
Here are five sentences about how you feel about your life as a whole. Please tick a box to say how much you agree with each of the sentences:
My life is going well
My life is just right
I have a good life
I have what I want in life
The things in my life are excellent
Response options are on a scale from 0 to 10 where 0 = ‘Not at all agree’ and 10 = ‘Totally agree’. The life satisfaction score is created by adding up answers to the five questions and then dividing the total by five to obtain a score from 0 to 10.
Day to day feelings
Below is a list of words that describe different feelings and emotions. Please read each word and then tick a box to say how much you have felt this way during the last two weeks.
Satisfied
Happy
Relaxed
Active
Calm
Full of energy
Response options are on a scale from 0 to 10 where 0 = ‘Not at all’ and 10 = ‘Extremely’.
Box 4: Questions on subjective well-being (Children’s Worlds survey)
16 The Good Childhood Report 2014
The current state of children’s subjective well-being: Overview and variations
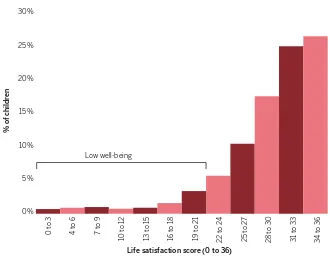
The newly-published data for children aged around 11 years old from the Millennium Cohort Study enables us to do this. It contains measures of children’s satisfaction with their lives as a whole and with some aspects of their lives and we have used this to create an overall life satisfaction score from 0 to 36, with higher scores signifying higher subjective well-being. Figure 2 shows the distribution of life satisfaction scores using this measure. It can be seen that most children are relatively satisfied with their lives. Around 10% of children scored less than 22 out of 36 and, in the analysis that follows, we classify these children as having low subjective well-being using this measure.
The survey also includes data on children’s country of residence within the UK, their ethnicity, household income, parental employment status and family structure. This enables us to compare variation in overall subjective well-being according to these factors. Table 2 shows the mean life satisfaction scores and proportions of children with low life satisfaction for each group. The key differences here are as follows:
There was no difference in the overall (mean) life satisfaction score for girls and boys.
[image:16.595.31.361.437.693.2]In the UK, children in England have the lowest mean subjective well-being. Children in Northern Ireland have the highest well-being and the smallest proportion
Table 1: Summary of mean scores for different measures of subjective well-being by age group and gender
All Year 6 Year 8 Female Male
Life satisfaction score 8.5 8.8 8.3 8.5 8.6
Satisfied 8.1 8.3 7.9 8.0 8.2
Happy 8.6 8.9 8.3 8.5 8.8
Relaxed 8.1 8.3 7.9 7.9 8.3
Calm 7.9 8.1 7.7 7.9 8.0
Active 8.5 8.8 8.3 8.3 8.7
Full of energy 8.6 8.9 8.2 8.4 8.8
Source: Children’s Worlds Survey, 2013-14. Age: 10 to 13 years old. Scope: England. Sample size: 2276.
0% 5% 10% 15% 20% 25% 30%
31 t
o 33
28 t
o 30
25 t
o 2
7
22 t
o 2
4
19 t
o 21
16 t
o 18
13 t
o 15
10 t
o 12
7 t
o 9
4 t
o 6
34 t
o 36
0 t
o 3
% o
f childr
en
Life satisfaction score (0 to 36)
Low well-being
Figure 2: Summary of life satisfaction scores (MCS)
17 The Good Childhood Report 2014 The current state of children’s subjective well-being: Overview and variations
Table 2: Variations in overall subjective well-being MCS
Gender Mean life satisfaction (out of 36) % with low life satisfaction
Boy 29.3 9.7%
Girl 29.5 10.0%
Country
England 29.3 10.1%
Wales 29.6 8.8%
Scotland 29.7 9.2%
Northern Ireland 30.5 6.9%
Equivalent income quintile
Bottom 29.0 12.3%
Second 29.0 11.6%
Third 29.3 9.9%
Fourth 29.9 6.8%
Top 29.8 8.0%
Poverty
Above <60% median threshold 29.5 9.1%
Below <60% median threshold 29.0 12.4%
Family type
Both natural parents 30.0 7.3%
Mother and step parent 28.4 13.5%
Father and step parent 29.2 10.3%
Lone mother 28.5 14.1%
Lone father 28.9 8.8%
Other 28.1 14.7%
Parental employment
Both in work 29.8 7.7%
Main in work, partner not 30.1 7.7%
Partner in work, main not 29.8 9.1%
Both not in work 28.8 12.3%
Main in work or on leave, no partner 28.6 12.8%
Main not in work nor on leave, no partner 28.3 15.1%
18 The Good Childhood Report 2014
The current state of children’s subjective well-being: Overview and variations
of children with low subjective well-being. Mean subjective well-being in Northern Ireland is significantly higher than in England but not significantly higher than in Scotland and Wales.
Children in families in the bottom two equivalent income quintiles have lower mean subjective well-being and are also more likely to be in the ‘low subjective well-being’ group. This is also the case for children living in families with incomes below the poverty line (i.e. equivalent net income is less than 60% of the median income).
As reported in previous years, children living with both birth parents have higher levels of well-being than children living in other family arrangements. Children living with neither of their birth parents have the lowest mean well-being. Previous analysis (Rees et al, 2010a; The Children’s Society, 2012)has shown that the quality of relationships explains 10 times more of the variation in overall well-being than family structure. Children who agree that their family get along well together have higher well-being irrespective of family structure. Where children disagreed that their family got on well together, their level of overall well-being was lower and virtually identical, no matter who they lived with.
Children with one parent in employment have the highest mean well-being though the differences between them and those with two earners is very small. Within households with two parents/carers anyone with an earning parent has higher mean well-being than where both are unemployed. The lowest well-being can be found where children are in lone parent families without employment.
Of course all these factors overlap and interact. When we analyse them together3 they explain just over 2%
of the variation in child subjective well-being. So, although there are differences between children in the sub-groups considered in Table 2, the types of factors considered – country, ethnicity, household income, parental employment and family structure – do not help us a lot in understanding why some children have much higher or lower subjective well-being than others.
However, we have shown in previous reports that measures of poverty and material deprivation based on children’s direct experiences rather than household income show much stronger associations with their subjective well-being. We present some new findings related to this issue in a later section of the report.
2.3 Children’s satisfaction
with different aspects of
their lives
In previous editions of The Good Childhood Report we have
summarised children’s satisfaction with 10 ‘domains’ included in The Good Childhood Index. These are aspects of life that we have identified as being important through consultation with children (The Children’s Society, 2008) and analysis of survey findings (Rees et al, 2010b). For each aspect of life, children are asked to rate their satisfaction on a 0-10 scale4.
We have shown previously that:
Children’s satisfaction with these different aspects of life varies considerably, with the highest levels of satisfaction tending to be with home, family and friends; and the lowest levels of satisfaction tending to be with appearance and the future.
Some aspects of life – such as satisfaction with family and amount of choice – are more strongly associated with overall well-being than others – such as satisfaction with friends.
There are some significant gender variations in satisfactions with certain aspects of life. In particular girls are much less satisfied than boys with the way that they look, particularly as they get older.
3 Using multiple regression analysis
19 The Good Childhood Report 2014 The current state of children’s subjective well-being: Overview and variations
There are also other age patterns. Satisfaction with friends changes relatively little across the age range from eight to 15 years old, whereas satisfaction with school and appearance drop significantly as children get older.
In this section we present the latest data on The Good Childhood Index, using the wave of the Children’s Worlds survey which was carried out in England in late 2013 and early 2014 with children in Year 6 (10 to 11 years old) and Year 8 (12 to 13 years old). Broadly speaking these new findings are consistent with previous research.
Figure 3 shows mean scores in each of these domains for the Children’s Worlds survey. Children reported the highest levels of satisfaction with money and possessions and with their relationships with their families; and the lowest levels of satisfaction (by quite a margin) with their appearance.
Considering the proportion of children with low well-being (defined as a score of four or less out of 10) on each of The Good Childhood Index domains, we found a similar (but not identical) pattern, shown in Figure 4. The domain with the smallest proportion of children with low well-being was ‘money and things’, with 2%, and the domain with the largest proportion was appearance, with 13%.
0 2 4 6 8 10 Appe ar anc e Futur e S chool Time us e Choic e He alth Friends Home Family Mone
y & thing
s Me an w ell-being s cor e ( out o f 1 0)
[image:19.595.233.561.212.455.2]Source: Children’s Worlds Survey, 2013-14. Age: 10 to 13 years old. Scope: England. Sample size: 2,276.
Figure 3: Mean scores on The Good Childhood Index domains
0% 3% 6% 9% 12% 15% Appe ar anc e Futur e S chool Time us e Choic e He alth Friends Home Family Mone
y & thing
s
% o
f childr
en with lo
w w
[image:19.595.234.560.523.760.2]ell-being
Figure 4: Proportion of children with low well-being for The Good Childhood Index domains
20 The Good Childhood Report 2014
The current state of children’s subjective well-being: Overview and variations
0% 5% 10% 15% 20% Appe ar anc e Futur e S chool Time us e Choic e He alth Friends Home Family Mone
y & thing
s
% o
f chidlr
en with lo
w w
ell-being
Boys Girls
There were significant gender differences for some of these
domains (Figure 5). The most notable difference was for ‘appearance’ – girls were twice as likely (18%) to have low well-being with this aspect of their life as boys (9%). The second strongest difference was feelings about the future, in relation to which 7% of boys and 9% of girls had low well-being5.
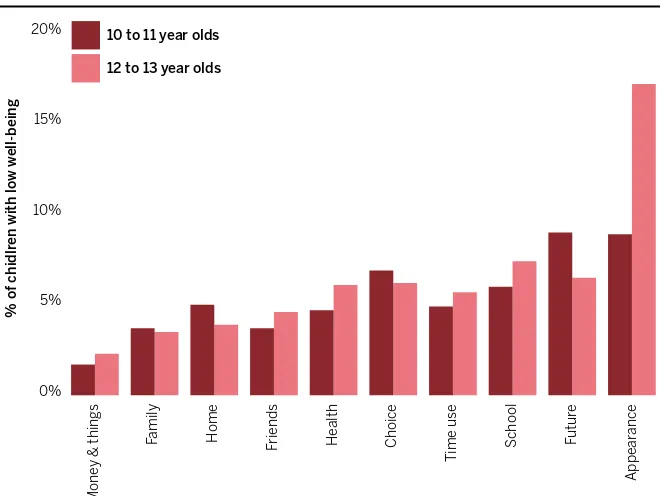
There were also differences based on children’s ages (between the two age groups 10 to 11 years old and 12 to 13 years old) (Figure 6). Again, the differences for appearance were the most striking, with 9% of children aged 10 to 11 having low well-being in this aspect of their life, compared to 17% of children aged 12 to 13. As we will see below, appearance is also an issue where there are important patterns in time trends and in international comparisons.
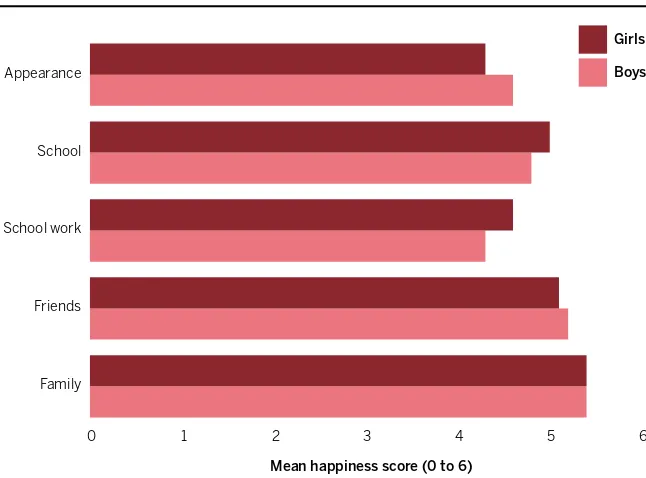
Data from the Millennium Cohort Study also enables us to look at gender differences for some aspects of life for children aged 11 in the UK, here using a scale from 0 to 6 (Figure 7). Girls were more satisfied than boys regarding school work and school. However they were less satisfied about their appearance, which is consistent with the results from the Children’s Worlds survey presented above.
Data from children aged 10 to 15 in the most recent wave of the Understanding Society survey, focusing on the same five aspects of life, also broadly confirms this
0% 5% 10% 15% 20% Appe ar anc e Futur e S chool Time us e Choic e He alth Friends Home Family Mone
y & thing
s
% o
f chidlr
en with lo
w w
ell-being
[image:20.595.30.361.213.467.2]12 to 13 year olds 10 to 11 year olds
Figure 6: Age differences for The Good Childhood Index
Source: Children’s Worlds Survey, 2013-14. Age: 10 to 13 years old. Scope: England. Sample size: 2276
5 Differences were established using chi square tests; n for all=1692.
‘If you don’t feel good about yourself you go in a bad
mood and sometimes you don’t want to eat’
[image:20.595.31.361.500.748.2]Year 8 student (girl)
Figure 5: Gender differences for The Good Childhood Index
21 The Good Childhood Report 2014 The current state of children’s subjective well-being: Overview and variations
picture. Girls were happier with their school work, but less happy with their appearance. There was no difference for the other domains – family, friends and school.
2.4 Summary
Where we ask children about their satisfaction with life and their happiness with specific aspects of their life, we find that the large majority of children in the UK respond relatively positively. Around 5% to 10% of children aged eight to 15 years old can be said to have low subjective well-being, depending on the question being asked.
0 1 2 3 4 5 6
Family Friends School work School
Appearance Boys
Girls
[image:21.595.60.383.213.452.2]Mean happiness score (0 to 6)
Figure 7: Summary of happiness with different aspects of life (MCS)
Source: Millennium Cohort Study, 2011. Age: around 11 years old. Scope: UK. Sample size: 13,469.
‘People are judged on looks. Sometimes you feel like
you can’t enjoy yourself unless you are pretty’
Year 8 student (girl)
The proportion of children with low well-being increases with age between the ages of eight and 15.
There is also evidence of gender differences in feelings of happiness, with boys having higher well-being than girls.
Children’s subjective well-being varies a little according to ethnicity, with white children having lower well-being than children of Indian, Pakistani and Bangladeshi origin.
Children in Northern Ireland have higher subjective well-being than children living in England, although they do not have
significantly higher subjective well-being than those in Scotland and Wales.
There are some differences in child subjective well-being according to household type. Children living with both birth parents have the highest well-being and those living in households without either of their birth parents having the lowest.
Children living in low income households have significantly lower overall subjective well-being than those living in high income households, although the association is small.
Children tend to be much happier with some of these aspects of their lives – such as money and possessions, family and home, and friendships – than with others – such as their appearance, their future and school. For example, only 4% of children aged 10 to 13 were unhappy with their family relationships compared to 13% who were unhappy with the way that they looked.
23
3.1 Overall trends, 1994 to
2011
Since 1994 the British Household Panel Youth Survey, and its successor the Understanding Society survey, has asked children aged 11-15 the same questions discussed above about their satisfaction with family, friends, appearance, school and life as a whole. When we first analysed this data (Bradshaw & Keung, 2011) we found that subjective well-being had improved significantly over the period 1994-2007. Most improvement had been in happiness with school and happiness with friends. Also at the beginning of the period, girls had had lower subjective
well-being than boys, but the gap had closed by 2007. In the last Good Childhood Report we observed that between 2008 and 2010 child happiness had stopped improving. We have now been able to update this picture adding the most recent data available, which is for 2011/12.
As can be seen in Figure 8, there is very little difference in the mean life satisfaction score between 2010 and 2011. We can conclude that after a period of increase from 1994 to 2007, children’s subjective well-being has stopped increasing during the last few years for which data is available.
3. Trends in child subjective
well-being over time
Box 5: Explaining ‘confidence intervals’
The charts in this section show the mean scores (represented by the points joined by the trend line) in well-being. The mean scores are accurate for the group of children who took part in the survey but, because this is only a sample of children, we do not know exactly what the mean scores are for all children in the UK in this age group.
So, the charts show bars extending above and below each point. These bars show a ‘confidence interval’ which can be thought of as representing a range of values within which we can be 95% confident that the actual mean score lies. The reason for showing these bars is to provide a rough guide to compare one year with another.
If the range of bars for one year do not overlap with the range of bars for another then we can be reasonably confident that the mean scores in the two years are different. For example, it is likely that the mean scores in 2007 to 2011 are all higher than the values in 2000 and 2001 because there is no overlap in the bars between these two groups of years.
[image:23.595.60.392.486.752.2]23.0% 23.4% 23.8% 24.2% 24.6% 25.0% 2 011 20 10 2009 2008 20 07 2006 2005 2004 20 03 20 02 2001 2000 1999 1998 19 97 1996 1995 1994 95% CI Tot al happine ss s cor e (y outh) Year
Figure 8: Children’s life satisfaction, 1994 to 2011
(Note: See Box 5 for explanation of the bars in the chart)
24 The Good Childhood Report 2014
Trends in child subjective well-being over time
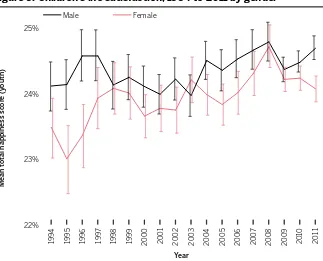
Figure 9 shows the trend separately for boys and girls. As indicated above, the gap between girls and boys narrowed and eventually closed between 1994 and 2007. In 2011, for the first time since 1996, there was a significant gender gap in subjective well-being of children aged 11 to 15 in the UK, with girls having lower mean well-being than boys. It will be important to see whether this trend continues in subsequent years (data from 2012 will be available later this year).
3.2 Trends in satisfaction
with different aspects of
life
Figure 10 to Figure 13 show trends by gender for the four aspects of life that have been tracked since 19946.
The key points are:
Satisfaction with family has stayed relatively steady and there is currently no difference between boys and girls (Figure 10).
There has been a sharp fall in girls’ satisfaction with their friends since 2008. There is currently no difference between boys and girls with this aspect of life (Figure 11). It will be important to monitor if this trend continues and a gap develops between girls’ and boys’ satisfaction with this aspect of life.
[image:24.595.209.532.209.470.2]22% 23% 24% 25% Female Male 2 011 20 10 2009 2008 20 07 2006 2005 2004 20 03 20 02 2001 2000 1999 1998 19 97 1996 1995 1994 Me an t ot al happine ss s cor e (y outh) Year
Figure 9: Children’s life satisfaction, 1994 to 2011 by gender
Source: British Household Panel and then (from 2009) Understanding Society/ BHPS youth survey, combined sample. Aged 11-15. Scope UK. Sample size: varies over time but in Understanding Society Wave C over 3700
Source: British Household Panel and then (from 2009) Understanding Society/ BHPS youth survey, combined sample. Aged 11-15. Scope UK. Sample size: varies over time but in Understanding Society Wave C over 3700
4.90 5.02 5.14 5.26 5.38 5.50 Female Male 2 011 20 10 2009 2008 20 07 2006 2005 2004 20 03 20 02 2001 2000 1999 1998 19 97 1996 1995 1994 Me an ho w y ou f
eel about y
our f
amily (r
ec
oded)
[image:24.595.222.532.526.780.2]Year
25 The Good Childhood Report 2014 Trends in child subjective well-being over time
[image:25.595.62.394.310.759.2]Levels of satisfaction with school work have been steady over the last few years and there is a consistent recent pattern of girls being more satisfied than boys with this aspect of their lives (Figure 12).
Perhaps the most striking fact that emerges from a detailed analysis of the data is the trend in girls’ and boys’ satisfaction with their appearance. There was no difference in 2002 but since then the scores have diverged sharply. As we will see in the next section this may be a particular problem for the well-being of children in the UK (Figure 13).
Source: British Household Panel and then (from 2009) Understanding Society/BHPS youth survey, combined sample. Aged 11-15. Scope UK. Sample size: varies over time but in Understanding Society Wave C over 3700
5.00 5.15 5.30 5.45 5.60 Female Male 2 011 20 10 2009 2008 20 07 2006 2005 2004 20 03 20 02 2001 2000 1999 1998 19 97 1996 1995 1994 Me an ho w y ou f
eel about y
our friends (r
ec oded) Year 3.8 4.0 4.2 4.4 4.6 4.8 Female Male 2 011 20 10 2009 2008 20 07 2006 2005 2004 20 03 20 02 2001 2000 1999 1998 19 97 1996 1995 1994 Me an ho w y ou f
eel about y
[image:25.595.72.387.516.782.2]our s chool w ork (r ec oded) Year
Figure 11: Children’s satisfaction with friends, 1994 to 2011 by gender
Figure 12: Children’s satisfaction with school work, 1994 to 2011 by gender
Source: British Household Panel and then (from 2009) Understanding Society/ BHPS youth survey, combined sample. Aged 11-15. Scope UK. Sample size: varies over time but in Understanding Society Wave C over 3700
26 The Good Childhood Report 2014
Trends in child subjective well-being over time
3.3 Summary
The latest available evidence on time trends suggests that, after a period of increase from 1994 to 2007, children’s subjective well-being in the UK stopped increasing between 2008 and 2011.
There is also some evidence of time trends in children’s happiness with particular aspects of life. The most notable of these is a growing gender gap in happiness with appearance, with girls being increasingly unhappy with this aspect of their lives in comparison with boys.
Source: British Household Panel and then (from 2009) Understanding Society/ BHPS youth survey, combined sample. Aged 11-15. Scope UK. Sample size: varies over time but in Understanding Society Wave C over 3700
3.75 4.00 4.25 4.50 4.75
Female Male
2
011
20
10
2009
2008
20
07
2006
2005
2004
20
03
20
02
2001
2000
1999
1998
19
97
1996
1995
1994
Me
an ho
w y
ou f
eel about y
our appe
ar
anc
e (r
ec
oded)
[image:26.595.50.359.231.488.2]Year
27 The Good Childhood Report 2014
29
International comparisons of children’s subjective well-being have considerable potential value. In recent years there have been recommendations about the importance of measuring people’s subjective well-being at an international level from the influential Stiglitz Commission prepared by leading economists (Stiglitz et al., 2009). Comparisons of subjective well-being between
4. Trends across countries
[image:29.595.64.560.415.775.2]-0.5% -0.4% -0.3% -0.2% -0.1% 0.0% 0.1% 0.2% 0.3% 0.4% 0.5% Mac edonia Netherlands Armenia Gr eenland Ic eland S w eden A us tria Isr ael Nor w ay D enmark German y Slo venia S witz erland R omania Sp ain B elgium VL G Portug al Hung ar y Cr oatia Gr eec e R us sia Lux embour g Ir eland Ukr aine Finland W ale s Slo vakia Lithuania Fr anc e B elgium W allone S cotland E ngland Lat via C zech R epublic Es tonia Poland It aly Canada U SA Turk ey Me an Z sc or e ( subjwb ) Country
Figure 14: Overall subjective well-being. League table of z scores
Source: Health Behaviour of School Aged Children 2010/11. Aged 11, 13 and 15. Total sample 213,595. National samples mainly vary between 4000 and 6000.
countries enable the findings for particular countries to be placed in a broader context and also have the potential to identify specific aspects of life where children in a given country are feeling more or less positive than might be expected. This latter type of information might inform debates about the state of childhood and could also help policymakers to identify priorities for improving children’s lives.
There are only two sources of comparable data on child subjective well-being – the Health Behaviour of School-aged Children (HBSC) (Currie et al., 2012) and the
30 The Good Childhood Report 2014 Trends across countries
4.1 Overall life satisfaction
Figure 14 shows the league table of an index of subjective well-being using HBSC data from 2010/11 constructed by Bradshaw et al (2013) and Klocke et al (2014). Out of 39 countries/regions England comes 30th, Scotland 29th and Wales 24th - all of them well below the average.
Table 3 shows the rank order of the British countries (Northern Ireland is not in the HBSC) on each of the components of subjective well-being. Scotland was ranked lowest on subjective health and England lowest on views about school. Wales was ranked much higher than either England or Scotland on relationships and Scotland was ranked much higher than England or Wales on life satisfaction.
Figure 15 presents data on satisfaction with life as a whole from the pilot wave of the Children’s Worlds survey. As with the HBSC data earlier, England fares relatively poorly in this comparison, being ninth out of the 11 countries in terms of overall subjective well-being.
The international evidence therefore suggests that the overall subjective well-being of children in Britain is comparatively poor.
Table 3: Rank order of British countries on components of subjective well-being.
Rank out of 39 countries
England Scotland Wales
Subjective health 28 34 31
Views about school 25 22 21
Relationships 24 29 15
Life satisfaction 33 13 34
Overall subjective well-being 30 29 24
Source: Health Behaviour of School Aged Children 2010/11. Aged 11, 13 and 15. England 3524, Scotland 6771, Wales 5454
0 2 4 6 8 10
S
outh K
or
ea
E
ngland
Chile
S
outh
A
fric
a
Alg
eria
U
SA
Br
azil
Isr
ael
Sp
ain
U
ganda
R
omania
Me
an lif
e s
atis
faction (0 t
o 1
0)
[image:30.595.206.533.408.663.2]Country
Figure 15: Mean life satisfaction among 12-year-olds in 11 countries
31 The Good Childhood Report 2014
Trends across countries
4.2 Satisfaction with
different aspects of life
The Children’s Worlds survey also includes the domains covered in The Good Childhood Index. Table 4 shows the ranking of children in England for these aspects of life. Children in England fared relatively well in terms of their satisfaction with home, money and possessions, and friends. They ranked higher for these aspects of life than they did for satisfaction with life as a whole shown in Figure 15. The aspect of life for which children in England ranked lowest was their satisfaction with their appearance – where they ranked 10th out of 11 countries, higher only than South Korea.
Table 4: Ranking of children in England for
10 aspects of life covered in The Good Childhood Index
Aspect Ranking for England
Choice 5th (out of 9 countries)
Home 6th
Money and possessions 6th
Friends 6th
Time use 7th
The future 7th
Family 8th
School 8th
Health 9th
Appearance 10th
Children’s Worlds pilot study, 2011-12. Aged around 12 years old. Scope: 11 countries (regions within some countries) as shown. Sample: 16,903 children.
7 Using eta2, the effect size for England was 0.046 and the next largest was for South Korea (.028)
In fact, further statistical tests show that the mean scores for satisfaction with appearance were much lower among children in England (7.3 out of 10) than in the other 10 countries combined (average score of 8.1 out of 10).
The issue of how children feel about their appearance has been a recurring theme in our research on children’s subjective well-being in the UK. Previous reports have shown that satisfaction with appearance declines substantially during the early teenage years, particularly for girls. Evidence presented elsewhere in this report suggests that in recent years there has been a growing gap between males and females in this respect. The provisional evidence presented above adds a further dimension to this picture, suggesting that children in England are much less satisfied with this aspect of their lives than children in a range of other countries.
It should also be noted that the gender difference regarding satisfaction with appearance is not a consistent feature across all countries. In five of the 11 countries included in the pilot survey – Israel, Uganda, Brazil, South Africa and Algeria – there was no difference between girls and boys in the mean scores for satisfaction with appearance. The gender gap in England was statistically larger7 than
in any other country.
4.3 Summary
Children in England fare relatively poorly in terms of their overall subjective well-being in two international comparative studies – ranking 30th out of 39 countries in Europe and North America and ninth out of 11 in a pilot survey of countries across five continents.
In the one study where data was available, children in Wales and Scotland also fared relatively poorly, although slightly better than England. International comparative data is not available for Northern Ireland.
32
Part two
33
In this section we explore the relationships between children’s subjective well-being and their activities and behaviours. We explored this issue in The Good Childhood Report 2013, looking at the links between children’s subjective well-being and different categories of activities that have been found to be associated with well-being among adults.
In this section, we extend this analysis by making use of newly-available data from the Millennium Cohort Study which relates to children around the age of 11. We present findings on the links between children’s subjective well-being and the following aspects of their lives covered in the MCS child questionnaire:
Activities and leisure time Friendships
Bullying
Health behaviours Seeking help Social behaviours
In exploring the associations here we have used two measures of subjective well-being included in the MCS questionnaire – satisfaction with life as a whole (referred to as ‘life satisfaction’ or ‘satisfied’) and happiness in the last four weeks (referred to as ‘happiness’ or ‘happy’). The analysis focuses on mean subjective well-being scores and proportions of children with low well-being (defined in this case as scoring on or below the mid-point).
Box 6 draws attention to two general issues that should be borne in mind when thinking about the findings.
5. Factors associated with
children’s subjective well-being:
What children do
Box 6: Issues to consider in interpreting the findings in this section
1. It is not possible to identify ‘cause and effect’ in this data because it was all gathered at a single point in time. If we find a link between greater frequency of playing sport and higher subjective well-being, this could plausibly mean (a) that children with higher subjective well-being are more likely to play sport (e.g. because they feel more energetic); (b) that playing sport gives children a better sense of well-being (e.g. through feeling more healthy); (c) that the relationship is explained by some other factor (e.g. children who live in more prosperous areas have higher subjective well-being and better access to sports facilities); (d) combinations of the above and other explanations.
34 The Good Childhood Report 2014
Factors associated with children’s subjective well-being: What children do
5.1 Activities and
leisure time
The MCS questionnaire contains nine questions about how often children spend time on various activities:
How often do you…
… listen to or play music, not at school?
… draw, paint or make things, not at school?
… play sports or active games inside or outside?
… read for enjoyment, not for school? … play games on a computer or
games console?
… use the internet, not at school? … use the internet for homework? … exchange messages with friends
on the internet?
… visit a social networking website on the internet?
There was a significant association between the frequency of eight of these activities and children’s well-being – the exception was the question about exchanging messages with friends on the internet, where no significant association with well-being was found.
Most of the associations were significant but small. The only activity that explained more than 1% of the variation in children’s subjective well-being was playing sports or active games. The proportion of children with low life satisfaction and happiness for different frequencies of this activity
0% 5% 10% 15% 20% 25% 30% 35% % o f chidlr
en with lo
w w
ell-being
Low happiness Low life satisfaction
Most days At least once
a week At least once a month Less than once a month Never
[image:34.595.206.534.232.435.2]Source: Millennium Cohort Study, 2011. Age: around 11 years old. Scope: UK. Sample size: 13,469.
Figure 16: Frequency of playing sports or active games, inside or outside, and low well-being
are shown in Figure 16. Children who play sports or active games most days were around half as likely to have low well-being as those who never did so.
For the other activities that had significant associations with well-being there was sometimes a slightly different pattern which is worth noting. For some of these activities, the frequency associated with the highest level of subjective well-being was ‘at least once week’. Figure 17 illustrates this pattern for the question about using the internet. Children with the least likelihood of low well-being were those who used the internet at least once a week.
Children who never used the internet outside school had the highest probability of low well-being. In terms of statistical comparisons,
those children who used the internet most days (55% of 11-year-olds) or at least once a week (31%) were significantly less likely to have low well-being than those children who used the internet less than once a month (3.3% of 11-year-olds) or never (3.1%). The strength of association here was relatively small, but the analysis does suggest that frequent internet use is linked to slightly higher well-being.
35 The Good Childhood Report 2014 Factors associated with children’s subjective well-being: What children do
In relation to using social networking sites on the internet, children who never did this activity had the highest levels of well-being, although again the association was relatively weak. It should be noted here that there are recommended lower age limits for the use of some social networking sites which are higher than the age group covered in the MCS (around 11 years old). In fact, perhaps reflecting this, over half of children in the MCS said that they never visited social networking sites even though, as noted above, 86% said that they used the internet outside school at least once a week or more.
Finally, the frequency of activities such as reading for enjoyment had a weak but straightforward association with well-being where higher frequency was associated with higher well-being.
0% 5% 10% 15% 20% 25%
% o
f chidlr
en with lo
w w
ell-being
Frequency of using the internet (not at school) Low happiness
Low life satisfaction
Most days At least once
a week At least once a month Less than once a month Never
[image:35.595.59.387.211.442.2]Source: Millennium Cohort Study, 2011. Age: around 11 years old. Scope: UK. Sample size: 13,469.
Figure 17: Frequency of using the internet (not at school), and low well-being
‘It’s easy to get to most
places to be active. I like to
cycle in to the countryside
for a nice peaceful
environment and for
sports’
Year 7 student
‘It is easy [to be active]
because we have lots of
stuff like swimming pool
and we can go biking or
just for a walk or run’
Year 7 student
‘Not much to do! Exercise
equipment at park, boring
leisure centre and PE at
school. Nothing else to do.
But I do ballet in a different
place so we have to drive’
Year 7 student
‘If you went for a run you
would feel weird on your
own and scared people will
judge me’
36 The Good Childhood Report 2014
Factors associated with children’s subjective well-being: What children do
5.2 Friendships
Friendships are viewed by children as fundamental to their well-being (The Children’s Society, 2005). However, the statistical evidence from our research programme has not always supported the central importance of friendships. Among the 10 aspects of life that make up The Good Childhood Index, children’s satisfaction with their friendships has been found to make relatively little contribution to explaining variations in life satisfaction once other aspects of life are taken into account (Rees et al,. 2010b), although there was more evidence of an association with happiness. On the other hand, whether children feel they have enough friends has been found to be significantly associated with their well-being (The Children’s Society, 2012).
The MCS asks a number of questions about friendships. Here we look at four questions about conflict with friends and about spending time with friends. The first thing to note is that a very small number of children (around 30 or
so) said that they did not have any friends. The subjective well-being of this small group of children was markedly low with over 50% of them having low life satisfaction and low happiness (compared to figures of around 12% and 17% respectively for the whole sample).
Excluding this group, three of these questions asked children how often they spent time with their friends outside school in general, in the afternoon after school and at the weekend. There was only a small significant association between time spent with friends overall and well-being and little or no association at all for the other two questions.
Levels of conflict with friends showed a slightly stronger
[image:36.595.33.361.558.768.2]connection with children’s subjective well-being. Children who argued more frequently with friends were more likely to have low well-being (Figure 18) – in particular those children who had arguments ‘most days’ - and this factor explained around 2% of the variation in life satisfaction once gender and household income were taken into account. 0% 5% 10% 15% 20% 25% 30% 35% % o f chidlr
en with lo
w w
ell-being
Frequency of arguing or falling out with friends
Low happiness Low life satisfaction
Most days At least once
a week At least once a month Less than once a month Never
Source: Millennium Cohort Study, 2011. Age: around 11 years old. Scope: UK. Sample size: 13,469.
Figure 18: Frequency of arguing or falling out with friends
‘It’s easy to be happy
because your [sic] friends
are there’
Year 10 student
‘You might not be happy
at home but your friends
cheer you up at school’
Year 7 student
‘I have friends that care
about me and I care about
them’
Year 6 student
‘I am too fat to go out and
also there is no one to play
with’
Year 8 student
‘When I get upset it’s
because my friends are
sometimes mean to me’
37 The Good Childhood Report 2014 Factors associated with children’s subjective well-being: What children do
5.3 Bullying
Our previous research has shown that experiences of being bullied have a strong association with low well-being. In fact the extent to which a child has recently been bullied explained more variation in life satisfaction than the combination of a range of socio-demographic factors (Rees et al, 2010a).
The MCS child questionnaire asks four questions about bullying – the extent to which the child had been hurt or picked on by siblings and by other children and the extent to which she/he has hurt or picked on siblings and other children. Response to all four questions
had a significant association with children’s subjective well-being. Children who were bullied more frequently had significantly lower well-being as did children who bullied others more frequently. The strongest association with subjective well-being was the experience of being bullied by children other than siblings (Figure 19). Over 40% of children who had been bullied in this way most days had low happiness and 30% had low life satisfaction (compared to 10% to 11% of children who had never been bullied). This variable explained more than 5% of the variation in life satisfaction (taking into account gender and household income).
The MCS data at age 11 therefore supports our earlier findings about the significant association between experiences of being bullied and subjective well-being.
It is notable that two recent pieces of analysis have found evidence that the effects of being bullied in childhood can extend well into adulthood affecting a range of adult outcomes (Wolke et al., 2013; Takizawa et al., 2014).
0% 10% 20% 30% 40% 50%
% o
f childr
en with lo
w w
ell-being
Frequency of being hurt or picked on by other children (not siblings) Low happiness Low life satisfaction
Most days About once
a week About once a month Every few months Less often Never
[image:37.595.60.398.525.738.2]Source: Millennium Cohort Study, 2011. Age: around 11 years old. Scope: UK. Sample size: 13,469.
Figure 19: Frequency of being hurt or picked on by other children (not siblings)
‘Bullying. Smoking helps
me release my stress
(depression)’
Year 10 student
‘Popularity is very
important, but to be
popular, you have to be
pretty, rich, skinny, clever.
If you’re not you get
bullied’
Year 9 student
‘It’s not that easy to feel
happy when you’re being
bullied and people make
fun of your family and it
makes you feel sad when
you care about them and
love them’
38 The Good Childhood Report 2014
Factors associated with children’s subjective well-being: What children do
5.4 Seeking help
Children’s propensity to seek help when they have problems may be an important source of resilience. A willingness to seek help may be indicative of strong and trusted relationships with others and may be instrumental in resolving problems and maintaining a sense of well-being in the face of adversity. There is therefore a plausible link between help-seeking and children’s subjective well-being
The MCS questionnaire asked a series of five questions (each in yes/ no format) about possible actions that the child might take if they are ‘worried about something’. Of these options, children were most likely
0% 5% 10% 15% 20%
Tell someone at home Keep it to myself
% o
f childr
en with lo
w lif
e s
atis
faction
No Yes
[image:38.595.33.359.555.755.2]Source: Millennium Cohort Study, 2011. Age: around 11 years old. Scope: UK. Sample size: 13,469.
Figure 20: Help-seeking and children’s subjective well-being
to say that they would tell someone at home (70%). Around 39% would tell a friend, around 28% would tell a teacher and around 12% would tell someone else. More than one of these responses was possible. On the other hand just over a fifth (22%) of children selected the option ‘keep it to myself’.
There were some significant relationships with subjective well-being here. Children who would tell someone at home had higher subjective well-being than those who would not. Conversely children who would keep the issue to themselves had lower subjective well-being than those who would not (Figure 20).
5.5 Health behaviours
39 The Good Childhood Report 2014 Factors associated with children’s subjective well-being: What children do
5.6 Social behaviours
Children were asked four questions about social behaviours (e.g. ‘Have you ever taken something from a shop without paying for it?’). Responses to all four questions were associated with children’s subjective well-being. Children responding in a more pro-social way tended to have higher well-being. The strongest association related to being noisy or rude in a public place - children who said that they had been noisy or rude in a public place were more likely to have low well-being.
5.7 Summary
Children who regularly play sports or active games have higher well-being than children who do so less regularly.
Regular use of computers and the internet is not associated with lower well-being. In fact, children who never use the internet outside school have much lower well-being than children who did.
There is little variation one way or the other, in this age group, in children’s well-being depending on how much time they spent with friends. But children who regularly argue or fall out with friends are much more likely than average to have low well-being.
Children who are more likely to seek help from someone at home if they have a problem tend to have higher well-being. Those who are likely to keep problems to themselves tend to have lower well-being.
41
Although associations between income and child subjective well-being tend to be small, it is widely established that children’s material living standards, and especially child poverty, are of central importance to children’s lives, and to the lives of the adults they become. Children living in poverty are more likely to suffer from worse mental and physical health; they are less likely to do well at school; and their life chances in adulthood in fields such as work, health, happiness and even premature mortality are impacted (for an overview see Griggs & Walker, 2008). But the relationship between household income and children’s subjective well-being is complicated.
This complexity arises for two reasons:
Firstly, studies of children have found a limited direct association between income poverty and subjective well-being (see Rees et al, 2011; Knies, 2011). This is mirrored in a limited association between income and subjective well-being for adults beyond a certain point (see Easterlin,
1974)8. But while there is a limited
direct link, the outcomes of income – such as better nutrition, better healthcare, and an
increased ability to live according to personal preferences – are associated with subjective well-being (Cummins, 2000). This suggests that the relationship between income and subjective well-being is indirect, rather than absent (Cummins, 2000; Main, 2014) – people cannot produce resources from nothing (Main and Pople, 2011).
Secondly, household income tells us only a limited amount about children’s own resources. Studies have shown that we cannot assume that material resources are shared fairly within households. Many researchers have found, for example, that men tend to get a greater share of household income and to spend more on themselves, while women tend to get a lesser share and spend more on children (Pahl, 2005; Grogan, 2004; Middleton et al, 1997; Lundberg et al, 1997). Children themselves, even those
who work, are likely to have only very limited control over both the amount of income available to the household, and what this is spent on9.
The issue of child poverty and children’s material living conditions is especially important in the current economic climate, and in light of austerity measures which are impacting particularly strongly on families with children (Reed and Portes, 2014). In this section we update previous findings on material deprivation which have been included in previous editions of The Good Childhood Report (The Children’s Society, 2012 and 2013). Next, we present some early findings on children’s perceptions of the economic crisis, its impact on their families and their well-being in relation to this. Finally, we look at some new findings about how children’s perceptions of how much they have compared to others – be they the child’s peers or their family – impact on subjective well-being, and about how children perceive sharing within their households.
6. Factors associated with
children’s subjective well-being:
What children have
8 Although a point has not yet been reached in any country where increased income is no longer associated with any increase in subjective well-being (Stevenson and Wolfers, 2013).