www.communities.gov.uk
Communities and Local Government Eland House
Bressenden Place London
SW1E 5DU
Telephone: 020 7944 4400 Website: www.communities.gov.uk © Crown Copyright, 2009
Copyright in the typographical arrangement rests with the Crown.
This publication, excluding logos, may be reproduced free of charge in any format or medium for research, private study or for internal circulation within an organisation. This is subject to it being reproduced accurately and not used in a misleading context. The material must be acknowledged as Crown copyright and the title of the publication specified.
Any other use of the contents of this publication would require a copyright licence. Please apply for a Click-Use Licence for core material at www.opsi.gov.uk/click-use/system/online/pLogin.asp, or by writing to the Office of Public Sector Information, Information Policy Team, Kew, Richmond, Surrey TW9 4DU
e-mail: [email protected]
If you require this publication in an alternative format please email [email protected] Communities and Local Government Publications
PO Box 236 Wetherby West Yorkshire LS23 7NB
Tel: 030 0123 1124 Fax: 030 0123 1125
Email: [email protected]
Online via the Communities and Local Government website: www.communities.gov.uk
75%
Second edition January 2009, First published August 2008 Product Code: 08 LGSR 05387
Contents
Section 1 – introduction 5
Purpose of the Place Survey 5
Purpose of this Manual 5
Who needs to read this Manual? 6
Section 2 – the common standards 8
Introduction 8
8 common standards 8
Ensuring you meet the 8 common standards 8
1) Timetable 8
2) Questionnaire template 9
3) Sampling method 11
4) Sampling frame 11
5) Data collection 12
6) Response rate 12
7) Statistical reliability 13
8) Submitting your survey results 14
Section 3 – local authority re-structuring 16
Section 4 – the national indicators being collected via
Section 1 – Introduction
Purpose of the Place Survey
The Local Government White Paper –
1. Strong and Prosperous Communities
emphasises a new focus on improving outcomes for local people and places – rather than on processes, institutions and inputs. It recognises that no single organisation can achieve success on the complex issues of improving public health, reducing poverty, tackling crime or sustainable economic development. The challenges are too complex and the needs often too local for all solutions to be imposed from the centre. Everywhere, solutions will need effective co-operation.
Central to this is the importance of capturing local peoples’ views,
2.
experiences and perceptions, so that the solutions for an area can reflect local views and preferences. More than this, it is vital to track people’s changing perceptions, as a way of determining whether interventions made in an area result in the right outcomes for local people – ie do people feel happier, healthier, safer? The Place Survey is a way of achieving this.
The Place Survey will supply the data by which a number of national
3.
indicators will be measured. The national indicators will measure how well Governments’ priorities, as set out in the Comprehensive Spending Review, are being delivered by local government and local government partnerships over the next three years. They form an important part of the new, streamlined local performance framework. The national indicators can be found in section 4 of this manual.
The Place Survey will be one tool which is available to councils and their
4.
partners to understand the views of local people. We expect that local service providers will have many ways both of seeking direct feedback on services and of exploring perceptions of the area. The new performance framework expects councils and partners to use all the evidence at their disposal to build a robust understanding of the area they serve and the people who live there. Within this context, the Place Survey provides a set of national indicators which will be common to all areas. However, to be properly understood, these measures will need to be interpreted in their local context and set alongside other local information.
Purpose of this manual
This manual specifies the common standards for local authorities and their
5.
The manual address this objective in three parts: The rest of this document
6.
outlines the common standards. Annex A is the questionnaire template whilst Annex B provides a technical annex with more detailed advice on how to meet the common standards.
This manual replaces the BVPI guidance. You should not rely on 7.
previous BVPI guidance in order to deliver the Place Survey.
Who needs to read this manual?
Anyone involved in conducting the 2008–09 Place Survey should read
8.
this manual. Each authority should have a designated primary point of contact. This person is responsible for managing the survey on behalf of the local authority and for submitting final data and meta-data. They should be a local authority employee, rather than a contractor. The primary point of contact should take responsibility for managing the survey process and ensuring that all the common standards are met. If the survey is to be conducted by a contractor, the authority’s primary point of contact should be responsible for ensuring that the contractor meets the common standards of the survey. The primary point of contact will be the only person who can submit the survey data and the metadata for their authority. They should take responsibility for the quality of the data. Any queries that arise about the quality of the data or the way that the survey was conducted during the validation of the survey will be directed at the primary point of contact.
If the designated primary point of contact leaves their post during the
9.
course of the survey (or otherwise finds themselves unable to fulfil their role) a replacement primary point of contact should be appointed. The replacement primary point of contact should make the Audit Commission aware of any such changes.
In areas with two-tier authorities it is appropriate for the higher tier to
10.
provide leadership and to identify ways in which the Place Survey can be conducted more efficiently through collaboration between local authority levels. However, all local authorities should be able to demonstrate the eight common standards.
Forty-four local authorities are currently undergoing re-structuring into
11.
Potential contractors may use this manual. Please note that the primary
12.
point of contact retains responsibility for the authority’s delivery of data to the Audit Commission.
A Place Survey website will be operational from mid-July. The precise
13.
‘go-live’ date will be announced by the Audit Commission. Access to the website will not be restricted to primary contacts.
The primary point of contact may require other members of staff to access
14.
materials relating to the Place Survey. Only by registering will you be able to access the templates and tools which will facilitate the survey process. The Place Survey website will include a regularly updated list of frequently asked questions. Certain areas of the website will be restricted to the designated primary point of contact at each authority.
If there is anything in this manual which is not clear please get in touch
15.
via the Audit Commission web-form which is available at
Section 2: The common standards
Introduction
This section sets out the
16. common standards for the Place Survey.
Eight common standards
The eight common standards are (in summary):
17.
1) Adhere to the timetable
2) Use the questionnaire template 3) Use the sampling method 4) Use the sampling frame
5) Use the designated method of data collection
6) Take all reasonable steps to maximise the response rate 7) Achieve the designated statistical reliability
8) Use each of the data submission templates and tools for submitting your survey results and metadata and ensure they are completed correctly and submitted by the required date
Ensuring you meet the eight common standards
1) Timetable
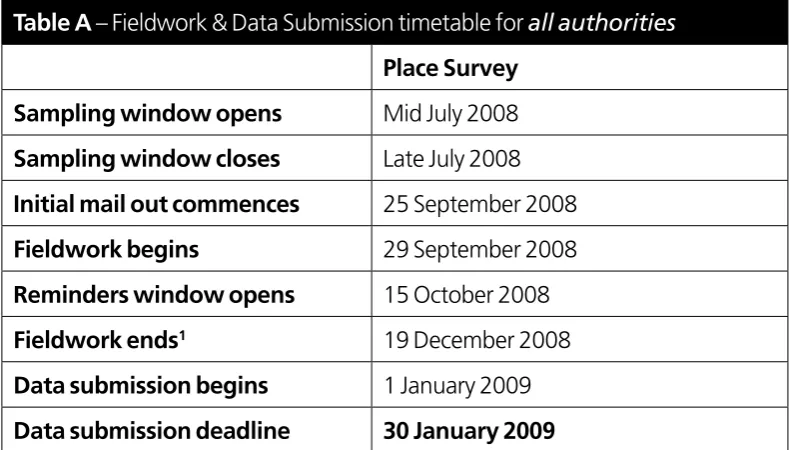
Fieldwork for the Place Survey should take place between 29 September
18.
2008 and 19 December 2008 (see table A for further details).
Authorities should commence mailing out covering letters, questionnaires
19.
and pre-paid envelopes from Thursday 25 onwards. You should receive completed questionnaires between 29 September 2008 and 19 December 2008. Steps to improve response, including sending reminder letters (with accompanying questionnaires), should be taken after 15 October 2008.
The survey should be undertaken every two years (authorities may choose
20.
Table A – Fieldwork & Data Submission timetable for all authorities
Place Survey Sampling window opens Mid July 2008 Sampling window closes Late July 2008 Initial mail out commences 25 September 2008
Fieldwork begins 29 September 2008
Reminders window opens 15 October 2008
Fieldwork ends1 19 December 2008
Data submission begins 1 January 2009 Data submission deadline 30 January 2009
2) Questionnaire template
Use the designated questionnaire template. This is available in annex A.
21.
It will also be available from the templates and tools section on the Place Survey website.
You should not use any questionnaire other than the questionnaire
22.
template.
The questionnaire template has been subjected to rigorous development,
23.
pilot testing and validation. You should not make any changes to the existing form of words in the questionnaire template or the existing layout unless any changes are specifically indicated in the template itself (eg to insert the name of your council).
Adding questions
You may add questions to your questionnaire in order to collect more
24.
detailed information on services and issues which are relevant to your local area. However:
Inclusion of additional questions needs to be discussed with the Local
25.
Strategic Partnership to ensure that questions chosen are in line with priorities in the Sustainable Community Strategy and Local Area Agreement.
If you are planning to add questions, it is recommended that you use
26.
a question from the Place Survey Question Bank (see section 5). These
1 No more questionnaires can be sent out but any completed questionnaire which you receive after this point may still be
questions have been selected in collaboration with key stakeholders, including the LGA, and have been used on previous BVPI surveys.
Therefore, they can provide data for time-series comparisons with previous BVPI surveys. Please note that there is no requirement or expectation that you ask any of these additional questions.
In most cases, any additional questions
27. should only be added after Q26
of the core questionnaire template, so that responses to the core questions are not affected by differential question ordering between local authorities. Any proposed exceptions to this (ie if any authority wishes to add questions earlier in the questionnaire) should be discussed and agreed with the Audit Commission.Additional questions should follow immediately after a short paragraph (to be decided and inserted by authorities) which explains to respondents why they are being asked these additional questions. Further advice can be found in section 5.
Adding questions will alter the length of the questionnaire. The final
28.
questionnaire should be no more than 12 pages long (excluding the covering letter). A longer questionnaire could be too time consuming for potential respondents and thereby deter them. It also reduces your ability to meet common standard six (take all reasonable steps to maximise response rate).
Adding your own questions
If you decide you have another question, which cannot be captured by
29.
any of the questions in the Place Survey Question Bank and you would like therefore to include a bespoke question, it is recommended that you should refer to and adhere to the advice contained in annex B (technical annex).
Covering letter
As well as the questionnaire template, authorities should use the ‘covering
30.
letter’ template.
A standard form of words has been developed for the covering letter in
31.
order to meet the requirements of the Data Protection Act 1998. The covering letter should be sent with each questionnaire. The covering letter should be signed by the council’s Chief Executive, the Leader of the Council or another high profile representative or representatives of the Local
Strategic Partnership.
It is recommended that local authorities add a local brand (see the
32.
3) Sampling method
Use random (probability) sampling to select potential respondents. Each of
33.
the residents in your sampling frame should have an equal, calculable and non-zero probability of being selected to receive a questionnaire.
In two-tier authorities (eg counties and districts), districts may conduct
34.
the survey on behalf of the county. However, all districts should reach an achieved sample size of 1,100 (regardless of population size). Therefore, if districts conduct the survey on behalf of the county, weights will need to be calculated and applied to adjust for different population sizes between districts before creating a county level dataset. These weights will be calculated and applied to the data by the Audit Commission. Alternatively, a county may conduct the survey on behalf of itself and each district. In this situation the county should conduct the survey in such a way as to ensure each district can demonstrate the common standards (ie random sampling, at least 1,100 completed questionnaires for each district etc) Again, if a county conducts the survey on behalf of each district, this should be a sample stratified per district. Weights will need to be calculated and applied to adjust for different population sizes between districts before creating a county level dataset. These weights will be calculated and applied to the data by the Audit Commission.
Authorities may choose to stratify the sample frame. Stratification involves
35.
dividing the population into subpopulations (strata). These subpopulations do not overlap and cover the whole population so that each sampling unit (eg household) belongs to exactly one stratum. Then random (probability) sampling should used to select a sample within each stratum. Stratification can be useful to boost the responses from particular demographic groups where you expect a low response rate, or to boost the responses in local areas to enable more reliable area-based analysis. If you wish to stratify your sample, weights will need to be calculated and applied to the data. Further details about weighting for the Place Survey can be found in annex B. Please consult a statistician/survey researcher, or contact the Audit Commission helpdesk for advice on stratification.
Authorities
36. should not subsequently cluster addresses within random or stratified samples.
4) Sampling frame
Use the sampling frame which comprises all adult (aged 18 and over)
37.
The sampling frame will be available from the Place Survey website (see
38.
the ‘who needs to read this manual’ section above for details). All samples should be drawn from the PAF. Authorities need to consider how many cases need to be drawn from the sample in order to receive at least 1,100 completed questionnaires. This decision is likely to be informed by the authority’s previous experience of conducting BVPI user satisfaction surveys (ie using an assumed response rate on the basis of previous BVPI surveys in the local area).
If you require more information before the Place Survey website is live
39.
(mid-July) please contact the Audit Commission via their web-form which is available at www.audit-commission.gov.uk/performance/ni-contact.asp.
5) Data collection
You should distribute all Place Survey questionnaires through the UK Royal
40.
Mail postal system. In addition, respondents should return completed questionnaires through the UK Royal Mail postal system (using the pre-paid envelope which authorities will supply).
Exceptions to the postal approach may be made
41. for individual
respondents where there are compelling reasons for doing so: for instance, if a respondent does not speak English and their own language has no written form, or if a resident has a particular disability and they lack an appropriate carer which prevents them from completing the questionnaire.
In the first instance, translated versions of the questionnaire should
42.
always be offered.2 The Audit Commission will be providing copies of
the Place Survey questionnaire template translated into the five most commonly spoken non-English languages. If it is established that a written questionnaire is not appropriate then an official should simply read out the questions and possible response options as they are written on the questionnaire template. They should also note the respondent’s answers, but they should avoid discussing the questions or leading the respondent to particular answers.Such scenarios should be discussed individually with the Audit Commission.
6) Response rate
Authorities should take all reasonable steps to maximise their response
43.
rates. It is especially important that authorities should continue trying to obtain more completed questionnaires once the minimum sample has been reached (if there remains time in the specified fieldwork period of the survey).
Non-response is one of the main causes of error in survey results.
44.
Minimum reasonable steps to maximise response rates:
Two reminder letters should be sent to non-respondents during the
45.
fieldwork period (after 15 October 2008, see table A).Each reminder letter should include a copy of the questionnaire and not simply a request for the previously sent questionnaire to be completed (which may have been mislaid by the non-respondent).
A pre-paid envelope should be included with each questionnaire to ensure
46.
potential respondents are not deterred by the financial cost of returning a completed questionnaire.
The covering letter sent as part of a reminder should be adjusted to
47.
reflect the fact that it is a reminder (whilst still meeting data protection requirements).
All correspondence (including envelopes) should include a local area
48.
brand which does not align it closely with any one agency or Council. This could be the same brand used for the Sustainable Community Strategy or Local Strategic Partnership for that area. Local areas will need to identify a suitable local area brand bearing in mind that this decision should be aimed at increasing the Place Survey response rate. The local brand is necessary because the survey is about the local area, rather than just the specific services provided by a particular council.
Further suggestions for ways to increase your response rate can be found in
49.
annex B.
7) Statistical reliability
A maximum +/- 3 percentage points at the 95 per cent confidence level is
50.
required to calculate the national indicators collected in the Place Survey.
The achieved sample size should be no smaller than 1,100. Authorities
51.
should aim to receive a minimum of 1,100 completed Place Survey questionnaires.
The achieved sample size is based on the total number of respondents to
52.
the survey as a whole, and not the number of respondents to individual questions.
The size of the population being surveyed (ie the number of adult residents
53.
size of sample required to ensure a given level of statistical reliability (as measured by the confidence interval figure).Theoretically this calculation can be adjusted where the population being surveyed is very small, but for the purposes of clarity, comparability and simplicity all authorities should meet the minimum sample size of 1,100.
8) Submitting your survey results
All data collected within the Place Survey should be submitted in
54.
accordance with the specified timetable (see table A) to the Audit Commission via the templates and tools provided on the Place Survey website.
The Audit Commission found that the local government sector generally
55.
welcomed its processing and publication of non BVPI question data from the 2006–07 BVPI General Survey to enable local benchmarking. Therefore, we propose that authorities should submit all their data (including additional questions from the voluntary question bank) via the Place Survey website. We are interested in hearing the views of local authorities on this approach to processing and publication of the survey questions, and are discussing with the Audit Commission and LGA how best to do that, prior to collection of the survey responses.We will also keep under review any implications for Government statistics arising from the requirements of The Statistics and Registration Service Act 2007.
In addition to the questionnaire templates, authorities will also need to
56.
submit specified data on how the survey was conducted via the meta-data submission template. The Audit Commission will review meta-data quality arrangements as part of their judgment to inform the Comprehensive Area Assessment.
The ward code of each respondent should be supplied with the data set.
57.
The ward codes will be provided in the PAF sample that you download from the Place Survey website. You should give each respondent in your original sample a unique identifying number before the first mail out, so that you can match all returned questionnaires against the ward code in your original sample. The dataset which you submit to the Audit Commission should not contain the respondent’s name, any part of their address (including postcode) or their unique identifying number.
All survey data and data relating to how the survey was carried out
(meta-58.
All results from the Place Survey will be weighted. Further details about
59.
weighting can be found in annex B.
Authorities are asked to submit
60. unweighted data only.
After authorities have submitted unweighted data, the data will be
61.
processed and weight factors will be added. In return authorities will receive weighted data and their NIS scores approximately five working days after submitting the unweighted data. The quicker that authorities submit their data, the quicker they will receive their weighted data in return.
The information gained in the “About yourself” section of the
62.
questionnaire is important as it allows the authority to analyse levels of satisfaction between different groups of the population, such as those who are in various states of employment or are of different ages. It is also used for the weighting of the data by demographic characteristics.
If you require more information please contact us via the Audit
63.
Commission web-form which is available at www.audit-commission.gov. uk/performance/ni-contact.asp. Further information will be available via the Place Survey website (from mid-July onwards).
Once it is available, all authorities should register at the Place Survey
64.
Section 3: Local Authority re-structuring
New Unitary Areas – To be established on 1st April 2009
Whole county unitary authorities will be established in the following five county areas:
County Authorities to be Abolished
Cornwall
Caradon District Council Carrick District Council Kerrier District Council
North Cornwall District Council Penwith District Council
Restormel Borough Council
County Durham
Chester-Le-Street District Council Derewentside District Council Durham City Council
Easington District Council Sedgefield Borough Council Teesdale District Council Wear Valley District Council
Northumberland
Alnwick District Council
Berwick upon Tweed Borough Council Blyth Valley Borough Council
Castle Morpeth Borough Council Tynedale District Council
Wansbeck District Council
Shropshire
Bridgnorth District Council North Shropshire District Council Oswestry Borough Council
Shrewsbury & Atcham Borough Council South Shropshire District Council
Wiltshire
Kennet District Council
New district unitaries being established in Bedfordshire and Cheshire
New District Unitary Authorities to be Abolished
Bedford Borough
N/A continuing authority
Bedfordshire County Council
Central Bedfordshire Mid Bedfordshire District Council
South Bedfordshire District Council
Cheshire East
Congleton Borough Council
Crewe & Nantwich Borough Council Macclesfield Borough Council Cheshire County Council
Cheshire West & Chester Chester City Council
Section 4: the National Indicators being collected via the Place Survey
Place Survey Indicator
NI 1: % of people who believe people from different backgrounds get on well together in their local area
Is data provided by the LA or a local partner?
Y Is this an existing indicator? Y
Rationale The Local Government White Paper sets out Government’s aim of creating strong and cohesive communities and thriving places in which a fear of difference is replaced by a shared set of values and a shared sense of purpose and belonging. The aim in doing so is to ensure that the economic and cultural benefits of diversity are experienced by everyone in each community, recognising that this means promoting similar life opportunities for all. This particular measure is widely recognised as a key indicator of a cohesive society, shown to measure a number of strands of the community cohesion definition. The question that feeds this indicator was previously used in the 2006/7 BVPI satisfaction survey. Note that the methodology for the Place Survey is comparable with the BVPI satisfaction survey as both surveys are conducted by post with an autumn fieldwork period.
Definition The proportion of the adult population who say they ‘tend to agree’, or ‘definitely agree’ that their local area is a place where people from different backgrounds get on well.
Formula (Using weighted data): x /y * 100 where:
x = total number of respondents ‘agreeing’/’strongly agreeing’ that local area is a place where people from different backgrounds get on well
NI 1: % of people who believe people from different backgrounds get on well together in their local area (continued)
Worked example Definitely Agree (DA) = 1004 Tend to Agree (TA) = 5757 Tend to Disagree (TD) = 1370 Definitely Disagree (DD) = 360 Don’t Know (DK) = 793 Too few = 73
All same = 318
((DA + TA )/(DA + TA + TD + DD))*100
6761/8491 * 100 = 80%
Good performance Good
performance typified by higher percentages
Data Source Collection will be through the new Place Survey. Local authorities will submit data to the Audit Commission, who will weight it and submit it to Communities and Local Government directly, and provide authorities with weighted copies of their own data sets.
Collection Interval
Biennial
Return Format Percentage Decimal Places One
Reporting
organisation Audit Commission
Spatial level Single tier, district and county council
Place Survey Indicator
NI 2: % of people who feel that they belong to their neighbourhood Is data provided by the LA or
a local partner?
Y Is this an existing indicator? N
Rationale The Local Government White Paper sets out Government’s aim of creating strong and cohesive communities and thriving places in which a fear of difference is replaced by a shared set of values and a shared sense of purpose and belonging. A sense of belonging to one’s neighbourhood is therefore a key indicator of a cohesive society. The question that feeds this indicator was previously used in the Citizenship survey.Note that the methodology for the Place Survey is different to the Citizenship survey as the Place Survey is conducted by post while the Citizenship survey is conducted face to face.
Definition The proportion of the adult population who feel ‘fairly strongly’, or ‘very strongly’ that they belong to their immediate neighbourhood.
Belonging:
Respondents will be said to feel they belong to their area if they say they feel they belong “very strongly” or “fairly strongly”.
Formula (Using weighted data): x /y * 100 where:
x = total number of respondents who say they belong to their neighbourhood
y =total number of respondents giving valid answer to question – ‘don’t know’ responses to be treated as missing values.
Worked example Very Strongly (VS) = 3032 Fairly Strongly (FS) = 4140 Not Very Strongly (NVS) = 1888
Not At All Strongly (NAAS) = 563
Don’t Know = 68
((VS + FS)/(VS + FS + NVS + NAAS))*100
7172/9623 * 100 = 75%
Good performance Good
NI 2: % of people who feel that they belong to their neighbourhood (continued)
Data Source Collection will be through the new Place Survey. Local authorities will submit data to the Audit Commission, who will weight it and submit it to Communities and Local Government directly, and provide authorities with weighted copies of their own data sets.
Collection Interval Biennial
Return Format Percentage Decimal Places One
Reporting
organisation Audit Commission
Spatial level Single tier, district and county council
Place Survey Indicator
NI 3: Civic participation in the local area Is data provided by the LA or
a local partner? Y Is this an existing indicator? N
Rationale To promote greater local participation in a range of civic activities. Civic participation is one of the principal means by which individuals exercise their empowerment for the benefit of the locality, often at the same time increasing their own level of empowerment. Contributing to a decision-making group requires a degree of personal confidence combined with a willingness to be a conduct for wishes and needs of other residents.
An increase in the number and diversity of people taking on such roles can help to create fairer, more inclusive policies whilst spreading the perception that public decision making is accessible to the influence of all legitimate interests.It can help to make civic institutions more representative of and accountable to the local population. It can also contribute to concentrating local decision making more effectively on the issues all members of society believe are important, as well as strengthening ties between such bodies and the people they serve, so building trust.
Local authorities are encouraged to consider this indicator in terms of narrowing gaps between group(s)1 in order to raise involvement of
disadvantaged sections of society.For example, there are disproportionately low numbers of black and minority ethnic women councillors, disabled school governors and ethnic minority magistrates. Targeting this indicator on a specific group(s) should be a way to make progress in addressing such inequalities. The question that feeds this indicator was previously used in the Citizenship survey. Note that the methodology for the Place Survey is different to the Citizenship survey as the Place Survey is conducted by post while the Citizenship survey is conducted face to face.
1 Disadvantaged groups may include women, people from an ethnic or religious minority, disabled people, young
NI 3: Civic participation in the local area (continued)
Definition Civic activities
Been a local councillor (for the local authority, town or parish) Member of a group making decisions on local health services
Member of a decision making group set up to regenerate the local area Member of a decision making group set up to tackle local crime problems Member of a tenants’ group decision making committee
Member of a group making decisions on local education services
Member of a group making decisions on local services for young people Member of another group making decisions on services in the local community
Participation will be counted if the respondent signals taking part in at least one of any of the activities above in the last 12 months.
Formula (Using weighted data): x /y * 100 where:
x = total number of respondents who say they take part in at least one of any of the activities above in the last 12 months
y = total number of respondents giving valid answer to question
Worked example Yes (Y) =1800 No (N) =441 ((Y)/(Y + N))*100
1800/2241 *100=80%
Good performance Good
performance typified by higher percentages
Data Source Collection will be through the new Place Survey. Local authorities will submit data to the Audit Commission, who will weight it and submit it to Communities and Local Government directly, and provide authorities with weighted copies of their own data sets.
Collection Interval Biennial
Return Format Percentage Decimal Places One
Reporting
organisation Audit Commission
Spatial level Single tier, district and county council
Place Survey Indicator
NI 4: % of people who feel they can influence decisions in their locality Is data provided by the LA or
a local partner? Y Is this an existing indicator? Y
Rationale The Government aims to build communities where individuals are
empowered to make a difference both to their own lives and to the area in which they live. A key indicator of community empowerment is the extent to which people feel able to influence decisions affecting their local area. The question that feeds this indicator was previously used in the 2006/7 BVPI satisfaction survey.Note that the methodology for the Place Survey is comparable with the BVPI satisfaction survey as both surveys are conducted by post with an autumn fieldwork period.
Definition The proportion of the adult population who agree that they feel able to influence decisions affecting their local area.
Formula (Using weighted data): x /y * 100 where:
x = total number of respondents who ‘definitely agree’/’tend to agree’ that they are able to influence decisions affecting their local area
y =total number of respondents giving valid answer to question – ‘don’t know’ responses to be treated as missing values.
Worked example Definitely Agree (DA) =516 Tend to Agree (TA) =3048 Tend to Disagree (TD) =3878 Definitely Disagree (DD) =1800
Don’t Know (DK) =441 ((DA + TA )/(DA + TA + TD + DD))*100
3564/9242 *100=39%
Good performance Good
performance typified by higher percentages
Data Source Collection will be through the new Place Survey. Local authorities will submit data to the Audit Commission, who will weight it and submit it to Communities and Local Government directly, and provide authorities with weighted copies of their own data sets.
Collection Interval Biennial
NI 4: % of people who feel they can influence decisions in their locality (continued)
Reporting
organisation Audit Commission
Spatial level Single tier, district and county council
Further Guidance
Place Survey Indicator
NI 5: Overall/general satisfaction with local area Is data provided by the LA or
a local partner?
Y Is this an existing indicator? N
Rationale The Government recognises that the quality of place remains a priority to residents and drives how satisfied people are with their local area as a place to live. This indicator will provide authorities and service deliverers with a baseline of local satisfaction which will help them identify and address the sorts of issues affecting how residents feel about their local area. The question that feeds this indicator was previously used in the 2006/7 BVPI satisfaction survey.Note that the methodology for the Place Survey is
comparable with the BVPI satisfaction survey as both surveys are conducted by post with an autumn fieldwork period.
Definition The proportion of the adult population who say they are ‘satisfied’, or ‘very satisfied’ with the area as a place to live.
The data source is the place survey which will ask the question:
“Overall, how satisfied or dissatisfied are you with your local area as a place to live?”.
Respondents have the choice of 5 response categories. These are: Very satisfied, Satisfied, Neither satisfied or dissatisfied, Dissatisfied, Very dissatisfied.
Formula (Using weighted data): x /y * 100 where:
x = the number of respondents who are very satisfied or satisfied with the area as a place to live.
NI 5: Overall/general satisfaction with local area (continued)
Worked example Very Satisfied (VS) =516 Fairly Satisfied (FS) =3048 Neither Satisfied nor Dissatisfied (NSD) =3878 Fairly Dissatisfied (FD) =1800 Very Dissatisfied (VD) =441 ((VS + FS)/(VS + FS + NSD + FD + VD))*100
3564/9683 *100=37%
Good performance Good
performance typified by higher percentages
Data Source Collection will be through the new Place Survey. Local authorities will submit data to the Audit Commission, who will weight it and submit it to Communities and Local Government directly, and provide authorities with weighted copies of their own data sets.
Collection Interval Biennial
Return Format Percentage Decimal Places One
Reporting organisation
Audit Commission
Spatial level Single tier, district and county council
Place Survey Indicator
NI 6: Participation in regular volunteering Is data provided by the LA or
a local partner? Y Is this an existing indicator? N
Rationale High levels of volunteering are one sign of strong, active communities. Volunteers are vital in supporting the range of activity undertaken by third sector organisations and within the public services. Local government has an important role to play in creating a culture in which individuals are able to contribute to their communities by volunteering.
Regular volunteering is defined as taking part in formal volunteering at least once a month in the 12 months before the interview. Formal volunteering is defined as giving unpaid help through groups, clubs or organisations which support social, environmental, cultural or sporting objectives. The question that feeds this indicator is based on a question previously used in the Citizenship survey. Note that the methodology for the Place Survey is different to the Citizenship survey as the Place Survey is conducted by post while the Citizenship survey is conducted face to face.
Definition In order to raise the level of volunteering activity the target focuses on increasing the proportion of regular formal volunteers. Regular formal voluntary activities are defined as taking part at least once a month in the 12 months before the survey.
Formal volunteering is defined as giving unpaid help through groups, clubs or organisations, which support social, environmental, cultural or sporting objectives at least once a week or less than once a week but at least once a month.
Formula (Using weighted data): x /y * 100 where:
x = total number of respondents who volunteer at least once a week or less than once a week but at least once a month
NI 6: Participation in regular volunteering (continued)
Worked example At least once a week (DA) = 1004
Less than once a week but at least once a month (TA) = 5757
I give unpaid help as an individual only and not through groups, clubs or organizations (TD) = 1370 I have not given any unpaid help in the last 12 months (DD) = 360
Don’t Know (DK) = 200 ((DA + TA )/(DA + TA + TD + DD))*100
6761/8491 * 100 = 80%
Good performance Good
performance typified by higher percentages
Data Source Collection will be through the new Place Survey. Local authorities will submit data to the Audit Commission, who will weight it and submit it to Communities and Local Government directly, and provide authorities with weighted copies of their own data sets.
Collection Interval Biennial
Return Format Percentage Decimal Places One
Reporting
organisation Audit Commission
Spatial level Single tier, district and county council
Further Guidance www.cabinetoffice/gov.uk/thirdsector
Place Survey & APACS Indicator
NI 17: Perceptions of anti-social behaviour Is data provided by the LA or
a local partner? Y Is this an existing indicator? Y
Rationale Anti-social behaviour (ASB) is a high profile national priority for Government. Local authorities are the key partner in tackling ASB and have statutory duties to enforce ASB legislation (this ASB indicator is mandatory in the 2006/07 LAAS). They are an applicant agency for Anti-social behaviour orders (ASBOs); they lead on housing-related ASB, tackling litter/graffiti, and are responsible for licensing of premises and in securing and designing environments to reduce likelihood of alcohol-fuelled disorder and ASB. The question that feeds this indicator was previously used in the 2006/7 BVPI satisfaction survey and the BCS. Note that the methodology for the Place Survey is different to the British Crime Survey (BCS) as the Place Survey is conducted by post biennially, while the BCS is conducted face to face on a continuous basis, with rolling annual data reported quarterly at Police force level.
Definition Percentage of respondents with a high level of perceived anti-social behaviour combines responses to seven questions about anti-social behaviour problems. The questions are as follows:
Thinking about this local area, how much of a problem do you think each of the following are....
1) … noisy neighbours or loud parties?
2) … teenagers hanging around on the streets? 3) … rubbish or litter lying around?
4) … vandalism, graffiti and other deliberate damage to property or vehicles? 5) … people using or dealing drugs?
6) … people being drunk or rowdy in public places? 7) … abandoned or burnt out cars?
Formula The combined measure of ASB is calculated by allocating scores to the responses to the question about the seven anti-social behaviours, whereby: 0 = Not a problem at all
1 = Not a very big problem 2 = Fairly big problem 3 = Very big problem
A total score for each respondent is calculated based on the responses to the seven questions. The maximum possible score is 21. High perception of ASB is a score of 11 or above.
The indicator is the percentage of respondents whose score was 11 or above out of the total answering the question.
NI 17: Perceptions of anti-social behaviour (continued)
Worked example Set up scores from 0 to 3 for each code of the different ASB strands, sum the scores across the individual ASB strands to give each person (case) a score of between 0 and 21. Run a frequency of the summed scores eg: Score No of cases
0 40
1 100
2 150
. . .
11 or more 200
Total 1000
Percentage of respondents whose score was 11 or above = 200/1000 = 20%
Good performance Good
performance typified by lower percentages
Data Source Collection will be through the new Place Survey and through the British Crime Survey (BCS). For the Place Survey local authorities will submit data to the Audit Commission, who will weight it and submit it to Communities and Local Government directly, and provide authorities with weighted copies of their own data sets.
Collection Interval Biennial
Return Format Percentage Decimal Places One
Reporting
organisation Audit Commission
Spatial level Single tier, district and county council
Further Guidance This indicator is a Statutory Performance Indicator (SPI) within the APACS (Assessments of Policing and Community Safety) framework. Detailed information is therefore available in the APACS technical guidance which is available at:
http://police.homeoffice.gov.uk/performance-and-measurement/ assessment-methods/assessment-technical-guidance/
Place Survey & APACS Indicator
NI 21: Dealing with local concerns about anti-social behaviour and crime issues by the local council and police
Is data provided by the LA or a local partner?
Y Is this an existing indicator? Y
Rationale This is about partnership working with local agencies. This measure is also being employed as a proxy to measure confidence in local agencies to tackle the community safety issues that matter to local people (i.e. a measure of Neighbourhood Policing in the widest sense). It is an indicator of peopleís view about those issues which are important to their quality of life. A similar question to the one that feeds this indicator was previously used in the British Crime Survey (BCS). Note that the methodology for the Place Survey is different to the BCS as the Place Survey is conducted by post biennially, while the BCS is conducted face to face on a continuous basis, with rolling annual data reported quarterly at Police force level.
Definition The question being asked is as follows:
How much would you agree or disagree that the police and other local public services are successfully dealing with these issues in your local area?
Strongly agree; tend to agree; neither agree nor disagree; tend to disagree; strongly disagree; don’t know
Formula (Using weighted data): x /y * 100 where:
x = total number of respondents who strongly agree/tend to agree
y =total number of respondents giving valid answer to question including don’t knows.
Worked example Strongly Agree (DA) =516 Tend to Agree (TA) =3048 Neither Agree or Disagree (TAD) =3878
Tend to Disagree (TD) = 200 Strongly Disagree (DD) =1800
Don’t Know (DK) =441 ((DA + TA )/(DA + TA + TAD + TD + DD + DK))*100
3564/9883 *100=36%
Good performance Good
performance typified by higher percentages
NI 21: Dealing with local concerns about anti-social behaviour and crime issues by the local council and police (continued)
Collection Interval Biennial
Return Format Percentage Decimal Places One
Reporting organisation
Audit Commission
Spatial level Single tier, district and county council
Further Guidance This indicator is a Statutory Performance Indicator (SPI) within the APACS (Assessments of Policing and Community Safety) framework. Detailed information is therefore available in the APACS technical guidance which is available at:
http://police.homeoffice.gov.uk/performance-and-measurement/ assessment-methods/assessment-technical-guidance/
At local authority level, the national indicator will be based on data obtained through the Place Survey and this will provide the basis for any targets agreed by partners for inclusion in the Local Area Agreement. At police force level, the SPI will be measured through BCS data.
Place Survey Indicator
NI 22: Perceptions of parents taking responsibility for the behaviour of their children in the area Is data provided by the LA or
a local partner?
Y Is this an existing indicator? Y
NI 22: Perceptions of parents taking responsibility for the behaviour of their children in the area
(continued)
Definition % of people that agree or disagree that in their local area, parents take enough responsibility for the behaviour of their children.
(Using weighted data): x /y * 100 where:
x = total number of respondents who answer definitely agree and tend to agree.
y =total number of respondents excluding don’t know’s (definitely agree, tend to agree, neither agree or disagree, tend to disagree, definitely disagree) Formula
Worked example Definitely Agree (DA) =516 Tend to Agree (TA) =3048 Neither Agree or Disagree (TAD) =3878
Tend to Disagree (TD) = 200 Definitely Disagree (DD) =1800
((DA + TA )/(DA + TA + TAD + TD + DD))*100
3564/9442 *100=38%
Good performance Good
performance typified by higher percentages
Data Source Collection will be through the new Place Survey. Local authorities will submit data to the Audit Commission, who will weight it and submit it to Communities and Local Government directly, and provide authorities with weighted copies of their own data sets.
Collection Interval Biennial
Return Format Percentage Decimal Places One
Reporting organisation
Audit Commission
Spatial level Single tier, district and county council
Place Survey Indicator
NI 23: Perceptions that people in the area treat one another with respect and consideration Is data provided by the LA or
a local partner? Y Is this an existing indicator? Y
Rationale To encourage local authorities and their partners to take action to promote strong communities with shared values where community members treat one another with respect and consideration. The question that feeds this indicator was previously used in the 2006/7 BVPI satisfaction survey and the British Crime Survey (BCS). Note that the methodology for the Place Survey is comparable with the BVPI satisfaction survey as both surveys are conducted by post with an autumn fieldwork period. However, the methodology for the Place Survey is different to the BCS as the Place Survey is conducted by post biennially, while the BCS is conducted face to face on a continuous basis, with rolling annual data reported quarterly at Police force level.
Definition % of people who perceive people not treating one another with respect and consideration to be a problem in their area, using the question;
“In your local area, how much of a problem do you think there is with people not treating each other with respect and consideration?”
Formula (Using weighted data): x /y * 100 where:
x = total number of respondents who answer ‘fairly big problem’ and ‘very big problem’
y =total number of respondents giving valid answer to question excluding don’t knows.
Worked example A Very Big Problem (DA) =516
A Fairly Big Problem (TA) =3048
Not A Very Big Problem (TAD) =3878
Not A Problem At All (TD) = 200
Don’t Know (DK) =441 ((DA + TA )/(DA + TA + TAD + TD))*100
3564/7642 *100=47%
Good performance Good
performance is typified by lower percentages
Data Source Collection will be through the new Place Survey. Local authorities will submit data to the Audit Commission, who will weight it and submit it to Communities and Local Government directly, and provide authorities with weighted copies of their own data sets.
NI 23: Perceptions that people in the area treat one another with respect and consideration
(continued)
Return Format Percentage Decimal Places One
Reporting
organisation Audit Commission
Spatial level Single tier, district and county council
Further Guidance www.dcsf.gov.uk/localauthorities
Place Survey & APACS Indicator
NI 27: Understanding of local concerns about anti-social behaviour and crime issues by the local council and police
Is data provided by the LA or a local partner?
Y Is this an existing indicator? N
Rationale This is about partnership working with local agencies. It measures confidence in local agencies to seek views on anti-social behaviour and crime in your area.
Its focus is on quality of life issues, specifically with an element of community engagement through asking about ‘seeking peopleís views’. Understanding and agreeing what priorities are critical to this ‘listening and responding’ to deliver ‘two way’ engagement.
NI 27: Understanding of local concerns about anti-social behaviour and crime issues by the local council and police (continued)
Definition Anti-social behaviour – as part of the overall seven strand anti-social behaviour indicator, NI 17.
The question being asked is as follows:
It is the responsibility of the police and local council working in partnership to deal with anti-social behaviour and crime in your local area
How much would you agree or disagree that…
The police and local council seek people’s views about the anti-social behaviour and crime issues that matter in this area
Strongly agree; tend to agree; neither agree nor disagree; tend to disagree; strongly disagree
Formula (Using weighted data): x /y * 100 where:
x = total number of respondents who strongly agree/tend to agree
y =total number of respondents giving valid answer to question including don’t knows.
Worked example Strongly Agree (DA) =516 Tend to Agree (TA) =3048 Neither Agree or Disagree (TAD) =3878
Tend to Disagree (TD) = 200 Strongly Disagree (DD) =1800
Don’t Know (DK) =441 ((DA + TA )/(DA + TA + TAD + TD + DD + DK))*100
3564/9883 *100=36%
Good performance Good
performance typified by higher percentages
Data Source Collection will be through the new Place Survey and through the British Crime Survey (BCS). For the Place Survey local authorities will submit data to the Audit Commission, who will weight it and submit it to Communities and Local Government directly, and provide authorities with weighted copies of their own data sets.
Collection Interval Biennial
Return Format Percentage Decimal Places One
Reporting
NI 27: Understanding of local concerns about anti-social behaviour and crime issues by the local council and police (continued)
Spatial level Single tier, district and county council
Further Guidance This indicator is a Statutory Performance Indicator (SPI) within the APACS (Assessments of Policing and Community Safety) framework. Detailed information is therefore available in the APACS technical guidance which is available at:
http://police.homeoffice.gov.uk/performance-and-measurement/ assessment-methods/assessment-technical-guidance/
At local authority level, the national indicator will be based on data obtained through the Place Survey and this will provide the basis for any targets agreed by partners for inclusion in the Local Area Agreement. At police force level, the SPI will be measured through BCS data.
Place Survey Indicator
NI 37: Awareness of civil protection arrangements in the local area Is data provided by the LA or
a local partner?
Y Is this an existing indicator? N
Rationale Local responders have been the forefront of work over the past few years to improve the UKís preparedness for emergencies. The delivery chain for civil protection comprises national, regional and local government; the public, private and voluntary sectors, together with citizens and their communities who work together to support public authorities.
NI 37: Awareness of civil protection arrangements in the local area (continued)
Definition Question: How well informed do you feel about what to do in the event of a large-scale emergency [authority to insert appropriate example]?
Categories: Very well informed; fairly well informed; not very well informed; not well informed at all; donít know
Formula (Using weighted data): x /y * 100 where:
x = total number of respondents who answer very well or fairly well informed.
y =total number of respondents giving valid answer to question (very well informed, fairly well informed, not very well informed; not well informed at all; donít know)
Worked example Very Well Informed (DA) =516
Fairly Well Informed (TA) =3048
Not Very Well Informed (TAD) =3878
Not Well Informed At All (TD) = 200
Don’t Know (DK) =441 ((DA + TA )/(DA + TA + TAD + TD + DK))*100
3564/8083 *100= 44%
Good performance Good
performance typified by higher percentages
Data Source Collection will be through the new Place Survey. Local authorities will submit data to the Audit Commission, who will weight it and submit it to Communities and Local Government directly, and provide authorities with weighted copies of their own data sets.
Collection Interval Biennial
Return Format Percentage Decimal Places One
Reporting
organisation Audit Commission
Spatial level Single tier, district and county council
Place Survey & APACS Indicator
NI 41: Perceptions of drunk or rowdy behaviour as a problem Is data provided by the LA or
a local partner? Y Is this an existing indicator? Y
Rationale Activity by local authorities, the police and partner agencies to deliver local alcohol strategies will, in combination with public awareness campaigns, contribute to reducing the overall problem of drunk and rowdy behaviour in local communities.
Local authorities are responsible for the licensing of premises and for securing and designing environments that reduce the likelihood of drunk and rowdy behaviour (e.g. in design and control of the night-time economy, in town-centre management, and by working with transport providers).
The question that feeds this indicator was previously used in the 2006/7 BVPI satisfaction survey and the British Crime Survey (BCS). Note that the methodology for the Place Survey is comparable with the BVPI satisfaction survey as both surveys are conducted by post with an autumn fieldwork period. However, the methodology for the Place Survey is different to the BCS as the Place Survey is conducted by post biennially, while the BCS is conducted face to face on a continuous basis, with rolling annual data reported quarterly at Police force level.
Definition Thinking about this local area, how much of a problem do you think each of the following are....
6) people being drunk or rowdy in public places?
Very big problem, Fairly big problem, Not a very big problem, Not a problem at all
Formula (Using weighted data): x /y * 100 where:
x = total number of respondents who state either ‘very big problem’ or ‘fairly big problem’
y =total number of respondents giving valid answer to question excluding ‘no opinion’.
Worked example Very Big Problem (DA) =516 Fairly Big Problem (TA) =3048 Not A Very Big Problem (TAD) =3878
Not A Problem At All (TD) = 200
No Opinion (DK) =441
((DA + TA )/(DA + TA + TAD + TD))*100
3564/7642 *100= 47%
Good performance Good
NI 41: Perceptions of drunk or rowdy behaviour as a problem (continued)
Data Source Collection will be through the new Place Survey and through the British Crime Survey (BCS). For the Place Survey local authorities will submit data to the Audit Commission, who will weight it and submit it to Communities and Local Government directly, and provide authorities with weighted copies of their own data sets.
Collection Interval Biennial
Return Format Percentage Decimal Places One
Reporting
organisation Audit Commission
Spatial level Single tier, district and county council
Further Guidance This indicator is a Statutory Performance Indicator (SPI) within the APACS (Assessments of Policing and Community Safety) framework. Detailed information is therefore available in the APACS technical guidance which is available at:
http://police.homeoffice.gov.uk/performance-and-measurement/ assessment-methods/assessment-technical-guidance/
Place Survey & APACS Indicator
NI 42: Perceptions of drug use or drug dealing as a problem Is data provided by the LA or
a local partner? Y Is this an existing indicator? Y
Rationale This indicator has the capacity to bring together all aspects of the new drug strategy. Most obviously, enforcement action by the police in partnership with the Crime and Disorder Reduction Partnerships (CDRPs) and Drug Action Teams (DATs) can help to reduce the perceptions of drug use and drug dealing in local communities.
However, increased treatment effectiveness and improved access to treatment and the new focus upon preventing harm to children, young people and families will also have an impact.
Local authorities, working together with a wide range of partners including the Police, health partners and others, have an important role to play in these activities as drug use and drug dealing blight local communities. Success In these areas should be communicated to the general public through local media campaigns. Together these can have a positive impact upon this indicator and on public confidence more widely.
The question that feeds this indicator was previously used in the 2006/7 BVPI satisfaction survey and the BCS. Note that the methodology for the Place Survey is comparable with the BVPI satisfaction survey as both surveys are conducted by post with an autumn fieldwork period. However, the methodology for the Place Survey is different to the BCS as the Place Survey is conducted by post biennially, while the BCS is conducted face to face on a continuous basis, with rolling annual data reported quarterly at Police force level.
Definition Thinking about this local area, how much of a problem do you think each of the following are....
5) people using or dealing drugs?
Very big problem, Fairly big problem, Not a very big problem, Not a problem at all
Formula (Using weighted data): x /y * 100 where:
x = total number of respondents who state either ‘very big problem’ or ‘fairly big problem’
NI 42: Perceptions of drug use or drug dealing as a problem (continued)
Worked example Very Big Problem (DA) =516 Fairly Big Problem (TA) =3048 Not A Very Big Problem (TAD) =3878
Not A Problem At All (TD) = 200
No Opinion (DK) =441
((DA + TA )/(DA + TA + TAD + TD))*100
3564/7642 *100= 45%
Good performance Good
performance typified by lower percentages
Data Source Collection will be through the new Place Survey and through the British Crime Survey (BCS). For the Place Survey local authorities will submit data to the Audit Commission, who will weight it and submit it to Communities and Local Government directly, and provide authorities with weighted copies of their own data sets.
Collection Interval Biennial
Return Format Percentage Decimal Places One
Reporting
organisation Audit Commission
Spatial level Single tier, district and county council
Further Guidance This indicator is a Statutory Performance Indicator (SPI) within the APACS (Assessments of Policing and Community Safety) framework. Detailed information is therefore available in the APACS technical guidance which is available at:
http://police.homeoffice.gov.uk/performance-and-measurement/ assessment-methods/assessment-technical-guidance/
Place Survey Indicator
NI 119: Self-reported measure of peopleís overall health and wellbeing Is data provided by the LA or
a local partner?
N Is this an existing indicator? Y
Rationale Subjective measures of health and wellbeing are important indicators of the general health of the population. The Department of Health through its local commissioners, PCTs, is jointly responsible for delivering health and well-being for local populations with local government (and other agencies) through Local Area Agreements and Local Strategic Partnerships. A metric is therefore required to assess progress on improvements in health and wellbeing. The metric should be self-reported, since the local population is best placed to assess whether their health and wellbeing are improving.
Definition The health status ‘very good’ or ‘good’ is taken from the response to the self-reported health and wellbeing question ‘How is your health in general? Would you say it is ‘very good’, ‘good’, ‘fair’ ‘bad’ or ‘very bad’?’
Formula (Using weighted data): x /y * 100 where:
x = total number of respondents who answer ‘very good’/’good’ y =total number of respondents giving valid answer to question Worked example Very Good (VG) =516
Good (G) =3048 Fair (F) =3878 Fairly Bad (FB) = 200 Bad (B) =1800
((VG + G)/(VG + G + F + FB + B))*100
3564/9442 *100=38%
Good performance Good
performance typified by higher percentages
Data Source Collection will be through the new Place Survey. Local authorities will submit data to the Audit Commission, who will weight it and submit it to Communities and Local Government directly, and provide authorities with weighted copies of their own data sets.
Collection Interval Biennial
Return Format Percentage Decimal Places One
Reporting organisation
NI 119: Self-reported measure of peopleís overall health and wellbeing (continued)
Spatial level Single tier, district and county council
Further Guidance See, following for more information and guidance,
http://www.ic.nhs.uk/statistics-and-data-collections/health-and-lifestyles/ health-survey-for-england/health-survey-for-england-2005:-health-of-older-people-[ns]
Place Survey Indicator
NI 138: Satisfaction of people 65 and over with both home and neighbourhood Is data provided by the LA or
a local partner?
Y Is this an existing indicator? Y
Rationale To capture a measure of satisfaction of how older people live their lives at the local level, reflecting the effectiveness of policies on housing supply, adaptation and support; and those relating to the local area, environment, crime, transport, facilities etc. This is a well-established question used in the English Housing Survey, which can give national baseline data. This measure is preferred to objective measures of housing or neighbourhood conditions because it reflects what is important to people, and captures a wide range of influences.
Definition Older people are asked 2 questions: How satisfied are you with your home?
How satisfied are you with this area as a place to live?
The indicator is the percentage of people aged 65 and over who respond that they are fairly satisfied or very satisfied with both their home and the area. NB ‘Area’ is not defined; it is a subjective assessment, which will vary legitimately depending on what area respondents regard as relevant. Formula (Using weighted data): x /y * 100 where:
x = total number of respondents aged 65 and over answering fairly satisfied or very satisfied with home and with neighbourhood
y =total number of respondents number of people aged 65 and over giving valid answer to question.