Review Article
Association between IL-10 gene polymorphisms
and unexplained recurrent spontaneous
abortion risk: a meta-analysis
Chenglei Gu1,2*, Luyang Zhao1*, Ke Huang1, Wensheng Fan1, Lian Li1, Mingxia Ye1, Weidong Han3,
Yuanguang Meng1
1Department of Gynecology and Obstetrics, Chinese People’s Liberation Army General Hospital, Beijing, PR China;
2Department of Gynecology and Obstetrics, The 309th Hospital of Chinese People’s Liberation Army, Beijing,
PR China; 3Department of Molecular Biology, Institute of Basic Medicine, PLA Medical School, Chinese People’s
Liberation Army General Hospital, Beijing, PR China. *Equal contributors.
Received July 14, 2016; Accepted February 14, 2017; Epub June 15, 2018; Published June 30, 2018
Abstract: Objective: The aim of this study was to evaluate the association of interleukin-10 (IL-10) polymorphisms (-1082A/G, -819C>T, -592C>A, IL-10 haplotypes) with unexplained recurrent spontaneous abortion (URSA) risk
us-ing meta-analysis. Methods: Eligible studies published until May 2016 were identified by searchus-ing electronic da
-tabases. The pooled odds ratios (ORs) and 95% confidence intervals (95% CI) were calculated. Results: Nineteen
articles and 46 eligible studies involving 2765 cases and 2903 controls were considered in this study. The results indicated that the -1082A>G polymorphism was associated with URSA risk (allele model: OR = 1.21, 95% CI: 1.08-1.35; recessive model: OR = 1.52, 95% CI: 1.24-1.87; homozygous model: OR = 1.55, 95% CI: 1.23-1.97). Similar results were observed in both Asians and Caucasians. This study also revealed that the -819C>T polymorphism was associated with URSA risk (allele model: OR = 1.45, 95% CI: 1.07-1.95; dominant model: OR = 1.61, 95% CI: 1.05-2.47; recessive model: OR = 1.56, 95% CI: 1.08-2.26; homozygous model: OR = 1.94, 95% CI: 1.21-3.11;
het-erozygous model: OR = 1.54, 95% CI: 1.00-2.36). Subgroup analyses by ethnicity further identified this association
in Asians but not in Caucasians. No correlation was observed between the -592C>A polymorphism and IL-10 haplo-types (GCC and ACC) and URSA risk. Conclusions: The IL-10 -1082A>G and -819C>T polymorphisms might increase URSA risk. In the subgroup analyses, the -819C>T polymorphism only increased the risk of URSA in Asians but not in Caucasians. The -592C>A polymorphism and IL-10 haplotypes might not be associated with URSA susceptibility.
Keywords: Interleukin-10, abortion, spontaneous, polymorphism, meta-analysis
Introduction
Recurrent spontaneous abortion (RSA) is de- fined as two or more consecutive pregnancy losses before 20 weeks of gestation [1, 2]. Approximately 1%-3% of women of reproduc-tive age suffer from this condition, which is one of the most common causes of female sterility [3, 4]. Although several etiological factors have been identified, over 50% of RSA cases are still classified as unexplained recurrent spontane-ous abortion (URSA) [5]. However, it has been postulated that inflammatory and genetic fac-tors may be responsible for otherwise URSA [6]. As a potent inflammation cytokine, interleu-kin-10 is actively involved in the regulation of
polymorphisms may influence the transcription and translation of the IL-10 gene [10, 11]. Furthermore, these polymorphisms exhibit strong linkage disequilibrium. Previous studies showed the GCC haplotype was correlated with high levels of IL-10 production [12-15].
Numerous studies to date have investigated the association between IL-10 gene polymor-phisms and URSA and yielded inconsistent results. Therefore, we performed this meta-analysis to further clarify the association between IL-10 polymorphisms (-1082A/G, -819C>T, -592C>A, IL-10 haplotypes) in the pro-moter region and URSA risk.
Materials and methods
Literature sources and search strategy
The PubMed, Embase, Cochrane Library, Ch- inese Biomedical Literature database (CBM), and China National Knowledge Infrastructure (CNKI) databases were searched by two review-ers to retrieve all available papreview-ers. The latest searches were undertaken in May 2016. The following key words were used: “interleukin-10” or “IL 10”; “polymorphism” or “variant” or “SNP” or “mutation”; and “recurrent spontaneous abortion” or “recurrent miscarriage” or “recur-rent pregnancy loss” or “recur“recur-rent fetal loss”. No restrictions were placed on language or publication date. In addition, references cited in the retrieved articles were reviewed to trace additional relevant studies that the initial search missed. Authors were contacted to obtain related data not revealed in the original articles.
Inclusion and exclusion criteria
The inclusion criteria were as follows: (1) evalu-ation of the associevalu-ation between IL-10 polymor-phisms (-1082A>G, -819C>T, -592C>A, IL-10 haplotypes) and URSA, (2) case-control or cohort design, (3) patients with at least two spontaneous abortions were defined as RSA in the included studies, and (4) the number or fre-quency of genotypes was provided in the study or was made available by contacting the authors. The exclusion criteria were as follows: (1) studies with insufficient information, such as the genotype number was not reported, (2) absence of control subjects, (3) non-clinical studies, and (4) review, comment, or
confer-ence papers. For studies with overlapping sam-ples, only the sample with the largest size was included.
Data extraction and quality assessment
Two investigators (Chenglei Gu and Luyang Zhao) independently selected the articles and extracted the data with a consensus on all of the terms. If the data were not identical, the two investigators would recheck the data until they reached an agreement. The following items were collected from the eligible articles: first author’s name, year of publication, ethnic-ity, country of origin, minimum number of preg-nancy losses used to define RSA, source of sample, genotype distribution in cases and controls, number of cases and controls, geno-type method, and Hardy-Weinberg equilibrium (HWE) status of controls.
The checklists from the Newcastle-Ottawa scale (NOS) were used to assess the quality of studies. The NOS ranges from zero to nine stars. Studies with a score of six stars or great-er wgreat-ere considgreat-ered to be of high quality. Discrepancies were resolved as described above.
Statistical analysis
We tested whether the genotype frequencies of the controls were in HWE using a X2 test
(P>0.05). The strength of the association between the IL-10 polymorphisms and the risk of URSA was measured by odds ratios (ORs) with 95% confidence intervals (CIs). The pooled ORs were calculated for the allele model (G vs. A for -1082A>G, T vs. C for -819C>T, A vs. C for -592C>A), dominant model (GG+GA vs. AA for -1082A>G, TT+TC vs. CC for -819C>T, AA+AC vs. CC for -592C>A), recessive model (GG vs. AA+GA for -1082A>G, TT vs. CC+TC for -819C>T, AA vs. CC+AC for -592C>A), homozygous model (GG vs. AA+GA for -1082A>G, TT vs. CC for -819C>T, AA vs. CC for -592C>A), and heterozy-gous model (GA vs. AA for -1082A>G, TC vs. CC for -819C>T, AC vs. CC for -592C>A). Hetero- geneity was evaluated using a X2-based
Cochran’s Q statistic, and inconsistency was tested by the I2 metric. Heterogeneity was
con-sidered statistically significant at P<0.05 for the Q statistic or I2>50% for the I2 metric
method) [18] was performed. Otherwise, the fixed-effects model (Mantel-Haenszel method) [19] was applied. Subgroup analyses were per-formed based on the ethnicity and genotype method, as well as the HWE status of controls. The statistical significance of the pooled ORs was determined by Z test, with P<0.05 indicat-ing statistical significance.
Publication bias was analyzed using Egger’s test and Begg’s funnel plots [20]. Sensitivity analysis was conducted by removing each study and then analyzing the others to ensure that no individual study was entirely responsi-ble for the combined results. All statistical anal-yses were performed using Stata 12.0 software (Stata Corp, College Station, TX, USA).
Results
Literature selection and study characteristics
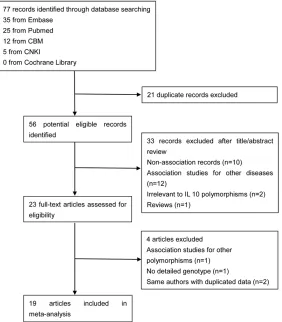
The selection process of this literature review is summarized in the flow diagram (Figure 1).
ina, India, Saudi Arabian, Bahrain, Ukraine, and Romania. Thirty-three studies were performed on Asians, whereas 13 studies were performed on Caucasians. Thirty-four studies used three or more pregnancy losses to define recurrent miscarriage, and 12 studies used two or more pregnancy losses in their definition. A range of 6-9 stars was acquired according to the NOS, indicating high methodological quality of the studies. Blood samples were used to determine genetic polymorphisms across all of the includ-ed studies.
Meta-analysis of the -1082A>G polymorphism and URSA risk
Table 2 lists the main results of the meta-anal-ysis of the association between -1082A>G poly-morphism and URSA risk. Fifteen studies with 2149 cases and 2190 controls were identified for the -1082A>G polymorphism. Eight studies were on Asians, and seven were on Caucasians. Overall, an association was found under the homozygous model (OR = 1.30, 95% CI: 1.07-Figure 1. Study flow chart explaining the selection of the 19 eligible articles
included in the meta-analysis.
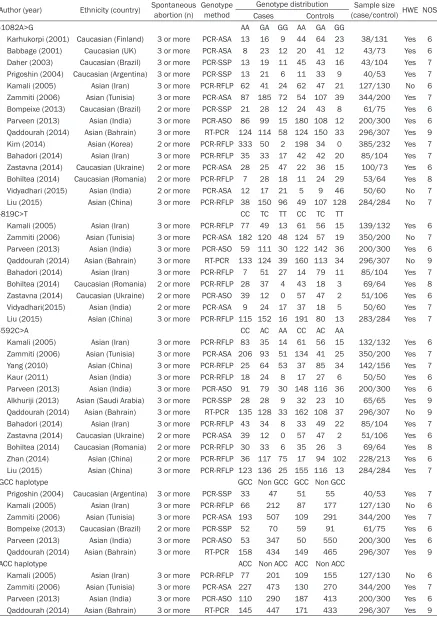
[image:3.612.95.377.74.396.2]Table 1. Characteristics of studies included in the meta-analysis
Author (year) Ethnicity (country) Spontaneous abortion (n) Genotype method Genotype distribution (case/control) HWE NOSSample size Cases Controls
-1082A>G AA GA GG AA GA GG
Karhukorpi (2001) Caucasian (Finland) 3 or more PCR-ASA 13 16 9 44 64 23 38/131 Yes 6 Babbage (2001) Caucasian (UK) 3 or more PCR-ASA 8 23 12 20 41 12 43/73 Yes 6 Daher (2003) Caucasian (Brazil) 3 or more PCR-SSP 13 19 11 45 43 16 43/104 Yes 7 Prigoshin (2004) Caucasian (Argentina) 3 or more PCR-SSP 13 21 6 11 33 9 40/53 Yes 7 Kamali (2005) Asian (Iran) 3 or more PCR-RFLP 62 41 24 62 47 21 127/130 No 6 Zammiti (2006) Asian (Tunisia) 3 or more PCR-ASA 87 185 72 54 107 39 344/200 Yes 7 Bompeixe (2013) Caucasian (Brazil) 2 or more PCR-SSP 21 28 12 24 43 8 61/75 Yes 6 Parveen (2013) Asian (India) 3 or more PCR-ASO 86 99 15 180 108 12 200/300 Yes 6
Qaddourah (2014) Asian (Bahrain) 3 or more RT-PCR 124 114 58 124 150 33 296/307 Yes 9
Kim (2014) Asian (Korea) 2 or more PCR-RFLP 333 50 2 198 34 0 385/232 Yes 7 Bahadori (2014) Asian (Iran) 3 or more PCR-RFLP 35 33 17 42 42 20 85/104 Yes 7 Zastavna (2014) Caucasian (Ukraine) 2 or more PCR-ASA 28 25 47 22 36 15 100/73 Yes 6 Bohiltea (2014) Caucasian (Romania) 2 or more PCR-RFLP 7 28 18 11 24 29 53/64 Yes 8 Vidyadhari (2015) Asian (India) 2 or more PCR-ASA 12 17 21 5 9 46 50/60 No 7 Liu (2015) Asian (China) 3 or more PCR-RFLP 38 150 96 49 107 128 284/284 No 7
-819C>T CC TC TT CC TC TT
Kamali (2005) Asian (Iran) 3 or more PCR-RFLP 77 49 13 61 56 15 139/132 Yes 6 Zammiti (2006) Asian (Tunisia) 3 or more PCR-ASA 182 120 48 124 57 19 350/200 No 7 Parveen (2013) Asian (India) 3 or more PCR-ASO 59 111 30 122 142 36 200/300 Yes 6
Qaddourah (2014) Asian (Bahrain) 3 or more RT-PCR 133 124 39 160 113 34 296/307 No 9
Bahadori (2014) Asian (Iran) 3 or more PCR-RFLP 7 51 27 14 79 11 85/104 Yes 7 Bohiltea (2014) Caucasian (Romania) 2 or more PCR-RFLP 28 37 4 43 18 3 69/64 Yes 8 Zastavna (2014) Caucasian (Ukraine) 2 or more PCR-ASO 39 12 0 57 47 2 51/106 Yes 6 Vidyadhari(2015) Asian (India) 2 or more PCR-ASA 9 24 17 37 18 5 50/60 Yes 7 Liu (2015) Asian (China) 3 or more PCR-RFLP 115 152 16 191 80 13 283/284 Yes 7
-592C>A CC AC AA CC AC AA
Kamali (2005) Asian (Iran) 3 or more PCR-RFLP 83 35 14 61 56 15 132/132 Yes 6 Zammiti (2006) Asian (Tunisia) 3 or more PCR-ASA 206 93 51 134 41 25 350/200 Yes 7 Yang (2010) Asian (China) 3 or more PCR-RFLP 25 64 53 37 85 34 142/156 Yes 7 Kaur (2011) Asian (India) 3 or more PCR-RFLP 18 24 8 17 27 6 50/50 Yes 6 Parveen (2013) Asian (India) 3 or more PCR-ASO 91 79 30 148 116 36 200/300 Yes 6 Alkhuriji (2013) Asian (Saudi Arabia) 3 or more PCR-SSP 28 28 9 32 23 10 65/65 Yes 9
Qaddourah (2014) Asian (Bahrain) 3 or more RT-PCR 135 128 33 162 108 37 296/307 No 9
Bahadori (2014) Asian (Iran) 3 or more PCR-RFLP 43 34 8 33 49 22 85/104 Yes 7 Zastavna (2014) Caucasian (Ukraine) 2 or more PCR-ASA 39 12 0 57 47 2 51/106 Yes 6 Bohiltea (2014) Caucasian (Romania) 2 or more PCR-RFLP 30 33 6 35 26 3 69/64 Yes 8 Zhan (2014) Asian (China) 2 or more PCR-RFLP 36 117 75 17 94 102 228/213 Yes 6 Liu (2015) Asian (China) 3 or more PCR-RFLP 123 136 25 155 116 13 284/284 Yes 7
GCC haplotype GCC Non GCC GCC Non GCC
Prigoshin (2004) Caucasian (Argentina) 3 or more PCR-SSP 33 47 51 55 40/53 Yes 7 Kamali (2005) Asian (Iran) 3 or more PCR-RFLP 66 212 87 177 127/130 No 6 Zammiti (2006) Asian (Tunisia) 3 or more PCR-ASA 193 507 109 291 344/200 Yes 7 Bompeixe (2013) Caucasian (Brazil) 2 or more PCR-SSP 52 70 59 91 61/75 Yes 6 Parveen (2013) Asian (India) 3 or more PCR-ASO 53 347 50 550 200/300 Yes 6
Qaddourah (2014) Asian (Bahrain) 3 or more RT-PCR 158 434 149 465 296/307 Yes 9
ACC haplotype ACC Non ACC ACC Non ACC
Kamali (2005) Asian (Iran) 3 or more PCR-RFLP 77 201 109 155 127/130 No 6 Zammiti (2006) Asian (Tunisia) 3 or more PCR-ASA 227 473 130 270 344/200 Yes 7 Parveen (2013) Asian (India) 3 or more PCR-ASO 110 290 187 413 200/300 Yes 6
Qaddourah (2014) Asian (Bahrain) 3 or more RT-PCR 145 447 171 433 296/307 Yes 9
5484 Int J Clin Exp Med 2018;11(6):5480-5491 Table 2. Summary of ORs of the IL-10 polymorphisms and URSA risk
Groups n (studies) Allele model Dominant model Recessive model Homozygous model Heterozygous model OR [95% CI] P OR [95% CI] P OR [95% CI] P OR [95% CI] P OR [95% CI] P
-1082A>G 15 1.07 [0.90, 1.28] 0.444 1.12 [0.98, 1.29] 0.098 1.22 [0.86, 1.74] 0.272 1.30 [1.07, 1.59] 0.009 1.07 [0.92, 1.24] 0.385 HWE in control
Yes 12 1.21 [1.08, 1.35] 0.001 1.15 [0.99, 1.34] 0.072 1.52 [1.24, 1.87] <0.001 1.55 [1.23, 1.96] <0.001 1.03 [0.88, 1.21] 0.720 No 3 0.67 [0.38, 1.19] 0.170 1.01 [0.74, 1.39] 0.935 0.58 [0.27, 1.24] 0.156 0.84 [0.58, 1.22] 0.366 1.26 [0.89, 1.78] 0.197 -819C>T 9 1.45 [1.07, 1.95] 0.015 1.61 [1.05, 2.47] 0.028 1.56 [1.08, 2.26] 0.019 1.94 [1.21, 3.11] 0.006 1.54 [1.00, 2.36] 0.049 HWE in control
Yes 7 1.49 [0.97, 2.28] 0.071 1.70 [0.91, 3.20] 0.099 1.69 [0.96, 2.96] 0.067 2.21 [1.07, 4.55] 0.032 1.60 [0.86, 3.00] 0.138 No 2 1.32 [1.10, 1.58] 0.003 1.41 [1.11, 1.79] 0.005 1.34 [0.93, 1.94] 0.122 1.52 [1.04, 2.23] 0.032 1.37 [1.06, 1.77] 0.017 -592C>A 12 0.98 [0.78, 1.23] 0.874 0.95 [0.71, 1.27] 0.743 1.06 [0.76, 1.48] 0.737 1.04 [0.69, 1.56] 0.858 0.96 [0.73, 1.26] 0.751 HWE in control
Yes 10 0.96 [0.74, 1.25] 0.890 0.91 [0.66, 1.26] 0.581 1.71 [0.74, 1.58] 0.697 1.03 [0.65, 1.64] 0.901 0.91 [0.67, 1.23] 0.535 No 1 1.16 [0.91, 1.48] 0.241 1.33 [0.97, 1.84] 0.079 0.92 [0.56, 1.51] 0.729 1.07 [0.64, 1.80] 0.799 1.42 [1.01, 2.00] 0.044
OR, odds ratio; CI, confidence interval; P, P value of pooled effect; HWE, Hardy-Weinberg equilibrium.
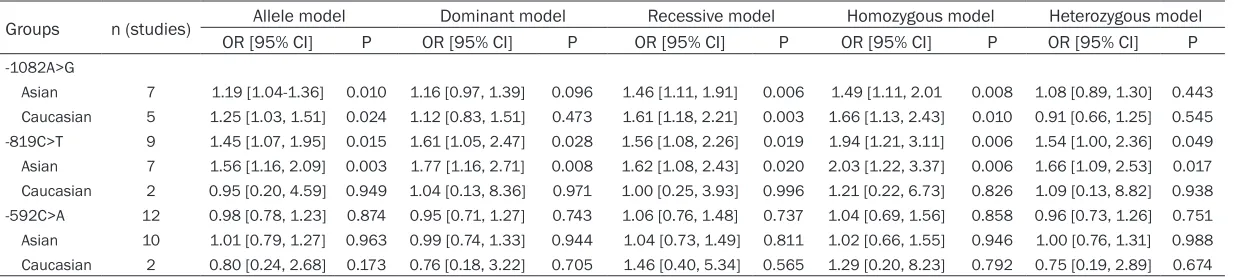
Table 3. Subgroup meta-analysis of IL-10 polymorphisms and URSA risk by ethnicity
Groups n (studies) Allele model Dominant model Recessive model Homozygous model Heterozygous model OR [95% CI] P OR [95% CI] P OR [95% CI] P OR [95% CI] P OR [95% CI] P
-1082A>G
Asian 7 1.19 [1.04-1.36] 0.010 1.16 [0.97, 1.39] 0.096 1.46 [1.11, 1.91] 0.006 1.49 [1.11, 2.01 0.008 1.08 [0.89, 1.30] 0.443 Caucasian 5 1.25 [1.03, 1.51] 0.024 1.12 [0.83, 1.51] 0.473 1.61 [1.18, 2.21] 0.003 1.66 [1.13, 2.43] 0.010 0.91 [0.66, 1.25] 0.545 -819C>T 9 1.45 [1.07, 1.95] 0.015 1.61 [1.05, 2.47] 0.028 1.56 [1.08, 2.26] 0.019 1.94 [1.21, 3.11] 0.006 1.54 [1.00, 2.36] 0.049 Asian 7 1.56 [1.16, 2.09] 0.003 1.77 [1.16, 2.71] 0.008 1.62 [1.08, 2.43] 0.020 2.03 [1.22, 3.37] 0.006 1.66 [1.09, 2.53] 0.017 Caucasian 2 0.95 [0.20, 4.59] 0.949 1.04 [0.13, 8.36] 0.971 1.00 [0.25, 3.93] 0.996 1.21 [0.22, 6.73] 0.826 1.09 [0.13, 8.82] 0.938 -592C>A 12 0.98 [0.78, 1.23] 0.874 0.95 [0.71, 1.27] 0.743 1.06 [0.76, 1.48] 0.737 1.04 [0.69, 1.56] 0.858 0.96 [0.73, 1.26] 0.751 Asian 10 1.01 [0.79, 1.27] 0.963 0.99 [0.74, 1.33] 0.944 1.04 [0.73, 1.49] 0.811 1.02 [0.66, 1.55] 0.946 1.00 [0.76, 1.31] 0.988 Caucasian 2 0.80 [0.24, 2.68] 0.173 0.76 [0.18, 3.22] 0.705 1.46 [0.40, 5.34] 0.565 1.29 [0.20, 8.23] 0.792 0.75 [0.19, 2.89] 0.674
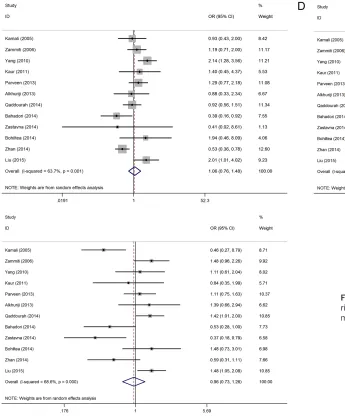
[image:5.792.90.713.308.447.2]1.59, P = 0.009). However, no association was observed under the other models. Given that three studies did not have a good HWE fit when we excluded them, the analyses revealed a significant association between URSA and -1082A>G polymorphism under three models (allele model: OR = 1.21, 95% CI: 1.08-1.35, P = 0.001; recessive model: OR = 1.52, 95% CI: 1.24-1.87, P<0.001; homozygous model: OR = 1.55, 95% CI: 1.23-1.97, P<0.001). A stratified analysis was conducted to assess potential ethnic differences, and a significantly increased URSA risk was found both in Asians and Caucasians under the three models (Table 3, Figure 2).
Meta-analysis of the -819C>T polymorphism and URSA risk
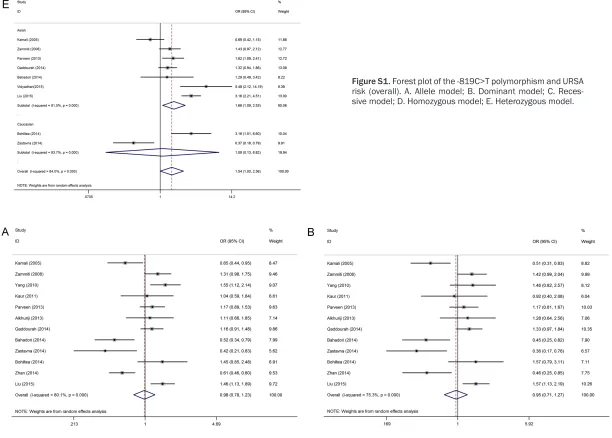
Survey results on the associations between -819C>T polymorphism and URSA are also shown in Table 2. Nine studies with 1529 ca- ses and 1557 controls were identified for the -819C>T polymorphism. Seven studies were on Asians, and two were on Caucasians. Overall, a significantly increased risk was observed under all five models (allele model: OR = 1.45, 95% CI: 1.07-1.95, P = 0.015; dominant model: OR = 1.61, 95% CI: 1.05-2.47, P = 0.028; recessive model: OR = 1.56, 95% CI: 1.08-2.26, P = 0.019; homozygous model: OR = 1.94, 95% CI: 1.21-3.11, P<0.006; heterozygous model: OR = 1.54, 95% CI: 1.00-2.36, P = 0.049). Two of nine studies were not in a good HWE fit for the -819C>T polymorphism. After removing the two studies, only the result of Homozygous model remained significant (OR = 2.21, CI: 1.07-4.55, P = 0.032).
Furthermore, we found similar results in the subgroup meta-analysis by ethnicity (Table 3, Figure S1), wherein the -819C>T polymorphism significantly increased URSA risk in Asians (allele model: OR = 1.56, 95% CI: 1.16-2.09, P = 0.003; dominant model: OR = 1.77, 95% CI: 1.16-2.71, P = 0.008; recessive model: OR = 1.62, 95% CI: 1.08-2.43, P = 0.020; homozy-gous model: OR = 2.03, 95% CI: 1.22-3.37, P = 0.006, heterozygous model: OR = 1.66, 95% CI: 1.09-2.53, P = 0.017). However, no association was found on the studies on Caucasians. The two studies, which did not have a good HWE fit, were both on Asians. After removing them, a significant association still remained in Asians
under three models (allele model: OR = 1.70, 95% CI: 1.08-2.68, P = 0.022; dominant model: OR = 2.03, 95% CI: 1.04-3.98, P = 0.039; homozygous model: OR = 2.51, 95% CI: 1.09-5.75, P = 0.030). No association was observed in recessive model (OR = 1.84, 95% CI: 0.97-3.49, P = 0.062) or heterozygous model (OR = 1.85, 95% CI: 0.96-3.57, P = 0.066).
Meta-analysis of the -592C>A polymorphism and URSA risk
The associations between the -592C>A poly-morphism and URSA are shown in Table 2 as well. Twelve studies with 1952 cases and 1981 controls were identified for the -592C>A poly-morphism. Ten studies were on Asians, and two were on Caucasians. Overall, no significant dif-ference in the -592C>A genotype distribution between URSA and control subjects (allele model: OR = 0.98, 95% CI: 0.78-1.23, P = 0.874; dominant model: OR = 0.95, 95% CI: 0.71-1.27, P = 0.743; recessive model: OR = 1.06, 95% CI: 0.76-1.48, P = 0.737; homozy-gous model: OR = 1.04, 95% CI: 0.69-1.56, P = 0.858; heterozygous model: OR = 0.96, 95% CI: 0.73-1.31, P = 0.751, Figure S2) was observed. We found that one of 12 studies was not in a good HWE fit. When we exclude that study, the results were consistent.
A stratified analysis was accomplished to evalu-ate potential ethnic differences. The results from the subgroups were similar to those of the overall population. No association between the -592C>A polymorphism and URSA was found in Asians and Caucasians across all genetic mod-els (Table 3).
Meta-analysis of haplotypes and URSA risk
four studies with 985 cases and 939 controls were identified. All studies were on Asians, and no association between the ACC haplotype and URSA risk was observed (ACC vs. non GCC: OR = 0.81, 95% CI: 0.65-1.00, P = 0.055).
Heterogeneity and sensitivity analyses
Some intra-study heterogeneity was observed during the meta-analysis (Table S1). To deter-mine the source of heterogeneity, we per-formed subgroup analyses by ethnicity and genotype method, as well as the HWE status of controls. Because some studies failed to report the age of cases and controls, we were unable
of the literature. The funnel plots for these poly-morphisms across the models for comparison were symmetrical (Figure 4 shows funnel plots for the three polymorphisms under the allele model). Egger’s test also revealed no statistical significance for the evaluation of publication bias under any genetic modes (Table S1). Therefore, no evident publication bias existed in this meta-analysis.
Discussion
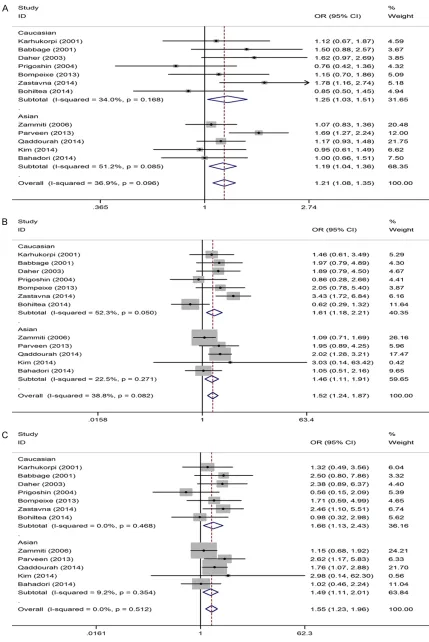
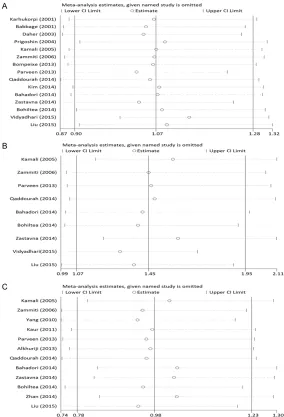
[image:8.612.90.374.72.489.2]Since the original identification of the IL-10 polymorphisms, numerous studies have inves-tigated the genetic effect of the polymorphisms Figure 3. Sensitivity analyses of the summary ORs on the association for
IL-10 polymorphisms with URSA risk under allele model. A. -IL-1082A>G: G vs. A; B. -819C>T: T vs. C; C. -592C>A: A vs. C.
to perform stratified analysis based on age. When we excluded the three -1082A>G polymorphism studies whose control genotypes did not have a good HWE fit, the het-erogeneity was eliminated, and the pooled analysis sh- owed a significant association between the -1082A>G poly-morphism and URSA risk. However, for the IL-10 haplo-types, -819C>T and -592C>A polymorphisms, no source indicated a contribution to substantial heterogeneity. In addition, we found that one of 12 studies was not in a good HWE fit for the -592C>A poly-morphism, and two of nine studies did not have a good HWE fit for the -819C>T poly-morphism. The results were consistent after removing th- ese three studies.
Sensitivity analysis, which se- quentially excluded individual studies, was performed to evaluate the stability of the results. The results of this analysis showed that no indi-vidual study exerted a marked effect on the pooled ORs (Figure 3).
Publication bias
on the susceptibility to complex human diseas-es, such as various cancers [40-42], systemic lupus erythematous [43], coronary artery
[image:9.612.92.376.68.648.2]URSA risk. Performing a genome-wide associa-tion study (GWAS) enables the identificaassocia-tion of genetic variants in various multi-pathogenic Figure 4. Begg’s funnel plots for publication bias under allele model. A.
-1082A>G: G vs. A; B. -819C>T: T vs. C; C. -592C>A: A vs. C.
diseases. However, no published GWAS that explored the precise association between IL-10 polymorphisms and URSA risk has been per-formed to date.
Specifically, moderate to high degrees of het-erogeneity were observed among the studies. We performed the subgroup analysis to explore the source. For the -1082A>G polymorphism, the heterogeneity decreased substantially when we excluded the three studies whose control genotypes did not have a good HWE fit. Indeed, significantly increased URSA risk exist-ed both in Asians and Caucasians after omit-ting the three studies. However, we found that the heterogeneity for the other polymorphisms and haplotypes could not be explained by sev-eral possible heterogeneity sources, such as ethnicity and genotype method, as well as the HWE status of controls. Moreover, when we excluded the two studies, which did not have a good HWE fit for the -819C>T polymorphism, a significant association still remained in Asians under three models. When we excluded the study, which did not have a good HWE fit for the -592C>A polymorphism, the results were con-sistent. Considering that a number of studies failed to report the age of cases and controls, we were unable to perform a stratified analysis based on age. Furthermore, other limitations of the recruited studies may partially contribute to the observed heterogeneity as well. For this reason, we conducted these analyses using the random-effects model. We generated funnel plots and carried out Egger’s tests to evaluate the existence of publication bias. No publica-tion bias was observed in our study, thereby demonstrating the stability of the results of this meta-analysis.
We noticed that two previous meta-analyses [47, 48] reported on the association between the IL-10 polymorphisms in the promoter region and URSA risk. The meta-analysis performed by Bombell S et al. [47] included only six eligible articles, and we considered it as a preliminary study. Another meta-analysis by Lee YH et al. [48] demonstrated that the -819C>T and -592C>A polymorphisms were associated with URSA risk in Asians, whereas the -1082A>G polymorphism was unrelated to URSA risk. Several reasons were raised to account for the differences. For the -1082A>G polymorphism, we identified two additional studies [24, 27], and excluded three studies whose control gen-otypes did not have a good HWE fit [25, 34, 35].
The heterogeneity was eliminated and a signifi-cant association between -1082A>G polymor-phism and URSA risk was found. For the -592C>A polymorphism, we identified three additional studies [36, 38, 39] with 420 cases and 419 controls in Asians, which accounted for a considerable weight (26.34%) and thus caused the different outcome. Moreover, we evaluated the association between IL-10 haplo-types and URSA risk as well. Taken together, our results are more reliable and stable than those of previous published articles.
It is also worth mentioning that this present study has some limitations. First, as we men-tioned above, an evident heterogeneity was found in our meta-analysis, and the genotype distribution showed a deviation from the HWE in some studies. Second, for the -819C>T and -592C>A polymorphisms, most of the studies focused on Asians, and only two studies on Caucasians were included. Thus, further stud-ies with large Caucasian populations are need-ed to validate the current results. Third, for the IL-10 haplotypes, we assessed the GCC and ACC haplotypes only, because of the small number of studies with the other six haplotypes (ATC, ATA, GCA, GTC, GTA, and ACA). Finally, our results were based on unadjusted estimates. Because some potential confounders, such as age, obesity, smoking status, drinking status, and environment, have no unified standard and/or lack of detailed data, it was difficult for us to further analyze these variables.
Conclusions
In conclusion, our results suggested that the IL-10 -1082A>G and -819C>T poly morphisms might increase the risk of URSA. In the sub-group analyses, the -819C>T polymorphism increased the risk of URSA in Asians but not in Caucasians. The -592C>A polymorphism and IL-10 haplotypes (GCC and ACC) may not be associated with URSA.
Acknowledgements
This work was supported by the National Natural Science Foundation of China: High-throughput sequencing identifying pathogenic genes of endometriosis (81571411).
Disclosure of conflict of interest
Address correspondence to: Yuanguang Meng, De- partment of Gynecology and Obstetrics, Chinese PLA General Hospital, 28 Fuxing Road, Beijing, 100853, PR China. Tel: +86 1066938244; E-mail: [email protected]
References
[1] Sugiura-Ogasawara M, Ozaki Y and Suzumori N. Management of recurrent miscarriage. J Obstet Gynaecol Res 2014; 40: 1174-1179. [2] Hyde KJ and Schust DJ. Genetic considerations
in recurrent pregnancy loss. Cold Spring Harb Perspect Med 2015; 5: a023119.
[3] Mukherjee S, Velez Edwards DR, Baird DD, Savitz DA and Hartmann KE. Risk of miscar-riage among black women and white women in a U.S. Prospective Cohort Study. Am J Epidemiol 2013; 177: 1271-1278.
[4] Regan L and Rai R. Epidemiology and the med-ical causes of miscarriage. Baillieres Best Pract Res Clin Obstet Gynaecol 2000; 14: 839-854.
[5] Li TC, Makris M, Tomsu M, Tuckerman E and Laird S. Recurrent miscarriage: aetiology, man-agement and prognosis. Hum Reprod Update 2002; 8: 463-481.
[6] Simpson JL. Causes of fetal wastage. Clin Obstet Gynecol 2007; 50: 10-30.
[7] Yamada H, Morikawa M, Furuta I, Kato EH, Shimada S, Iwabuchi K and Minakami H. Intravenous immunoglobulin treatment in women with recurrent abortions: increased cy-tokine levels and reduced Th1/Th2 lympho-cyte ratio in peripheral blood. Am J Reprod Immunol 2003; 49: 84-89.
[8] Raghupathy R. Pregnancy: success and failure within the Th1/Th2/Th3 paradigm. Semin Immunol 2001; 13: 219-227.
[9] Tarzi M, Klunker S, Texier C, Verhoef A, Stapel SO, Akdis CA, Maillere B, Kay AB and Larche M. Induction of interleukin-10 and suppressor of cytokine signalling-3 gene expression following peptide immunotherapy. Clin Exp Allergy 2006; 36: 465-474.
[10] Guzowski D, Chandrasekaran A, Gawel C, Palma J, Koenig J, Wang XP, Dosik M, Kaplan M, Chu CC, Chavan S, Furie R, Albesiano E, Chiorazzi N and Goodwin L. Analysis of single nucleotide polymorphisms in the promoter re-gion of interleukin-10 by denaturing high-per-formance liquid chromatography. J Biomol Tech 2005; 16: 154-166.
[11] Jung JH, Song GG and Lee YH. Meta-analysis of associations between interleukin-10 poly- morphisms and susceptibility to vasculitis. Immunol Invest 2015; 44: 553-565.
[12] Iyer SS and Cheng G. Role of interleukin 10
transcriptional regulation in inflammation and
autoimmune disease. Crit Rev Immunol 2012; 32: 23-63.
[13] Hoffmann SC, Stanley EM, Darrin Cox E, Craighead N, DiMercurio BS, Koziol DE, Harlan DM, Kirk AD and Blair PJ. Association of kine polymorphic inheritance and in vitro cyto-kine production in anti-CD3/CD28-stimulated peripheral blood lymphocytes. Transplantation 2001; 72: 1444-1450.
[14] Lyon H, Lange C, Lake S, Silverman EK, Randolph AG, Kwiatkowski D, Raby BA, Lazarus R, Weiland KM, Laird N and Weiss ST. IL10 gene polymorphisms are associated with asth-ma phenotypes in children. Genet Epidemiol 2004; 26: 155-165.
[15] Chatterjee R, Batra J, Kumar A, Mabalirajan U, Nahid S, Niphadkar PV and Ghosh B. Interleukin-10 promoter polymorphisms and atopic asthma in North Indians. Clin Exp Allergy 2005; 35: 914-919.
[16] Higgins JP, Thompson SG, Deeks JJ and Altman DG. Measuring inconsistency in meta-analy-ses. BMJ 2003; 327: 557-560.
[17] Minelli C, Thompson JR, Abrams KR, Thak- kinstian A and Attia J. The choice of a genetic model in the meta-analysis of molecular asso-ciation studies. Int J Epidemiol 2005; 34: 1319-1328.
[18] DerSimonian R and Laird N. Meta-analysis in clinical trials revisited. Contemp Clin Trials 2015; 45: 139-145.
[19] Mantel N and Haenszel W. Statistical aspects of the analysis of data from retrospective stud-ies of disease. J Natl Cancer Inst 1959; 22: 719-748.
[20] Song F, Khan KS, Dinnes J and Sutton AJ. Asymmetric funnel plots and publication bias in meta-analyses of diagnostic accuracy. Int J Epidemiol 2002; 31: 88-95.
[21] Karhukorpi J, Laitinen T, Karttunen R and Tiilikainen AS. The functionally important IL-10 promoter polymorphism (-1082G-->A) is not a major genetic regulator in recurrent spontane-ous abortions. Mol Hum Reprod 2001; 7: 201-203.
[22] Babbage SJ, Arkwright PD, Vince GS, Perrey C,
Pravica V, Quenby S, Bates M and Hutchinson
IV. Cytokine promoter gene polymorphisms and idiopathic recurrent pregnancy loss. J Reprod Immunol 2001; 51: 21-27.
[23] Daher S, Shulzhenko N, Morgun A, Mattar R, Rampim GF, Camano L and DeLima MG. Associations between cytokine gene polymor-phisms and recurrent pregnancy loss. J Reprod Immunol 2003; 58: 69-77.
[25] Kamali-Sarvestani E, Zolghadri J, Gharesi-Fard B and Sarvari J. Cytokine gene polymorphisms and susceptibility to recurrent pregnancy loss in Iranian women. J Reprod Immunol 2005; 65: 171-178.
[26] Zammiti W, Mtiraoui N, Cochery-Nouvellon E, Mahjoub T, Almawi WY and Gris JC. Association of -592C/A, -819C/T and -1082A/G interleu-kin-10 promoter polymorphisms with idiopath-ic recurrent spontaneous abortion. Mol Hum Reprod 2006; 12: 771-776.
[27] Bompeixe EP, Carvalho Santos PS, Vargas RG, von Linsingen R, Zeck SC, Wowk PF and Bicalho MG. HLA class II polymorphisms and recurrent spontaneous abortion in a Southern Brazilian cohort. Int J Immunogenet 2013; 40: 186-191.
[28] Parveen F, Shukla A and Agarwal S. Cytokine gene polymorphisms in northern Indian wom-en with recurrwom-ent miscarriages. Fertil Steril 2013; 99: 433-440.
[29] Qaddourah RH, Magdoud K, Saldanha FL,
Mahmood N, Mustafa FE, Mahjoub T and Almawi WY. IL-10 gene promoter and intron polymorphisms and changes in IL-10 secretion in women with idiopathic recurrent miscar-riage. Hum Reprod 2014; 29: 1025-1034. [30] Kim JO, Lee WS, Lee BE, Jeon YJ, Kim YR, Jung
SH, Chang SW and Kim NK. Interleukin-1beta -511T>C genetic variant contributes to recur-rent pregnancy loss risk and peripheral natural killer cell proportion. Fertil Steril 2014; 102: 206-212, e205.
[31] Bahadori M, Zarei S, Zarnani AH, Zarei O, Idali F, Hadavi R and Jeddi-Tehrani M. IL-6, IL-10 and IL-17 gene polymorphisms in Iranian women with recurrent miscarriage. Iran J Immunol 2014; 11: 97-104.
[32] Zastavna D, Sosnina K, Terpylyak O, Huleyuk N, Bezkorovayna H, Mikula M and Helner N. Cytogenetic and immunogenetic analysis of re-current pregnancy loss in women. Tsitol Genet 2014; 48: 44-50.
[33] L Bohiltea C, E Radoi V. Interleukin-6 and inter-leukin-10 gene polymorphisms and recurrent pregnancy loss in Romanian population. Iran J Reprod Med 2014; 12: 617-622.
[34] Vidyadhari M, Sujatha M, Krupa P, Jyothy A, Nallari P and Venkateshwari A. A functional polymorphism in the promoter region of inter-leukin-10 gene increases the risk for sponta-neous abortions--a triad study. J Assist Reprod Genet 2015; 32: 1129-1134.
[35] Liu RX, Wang Y and Wen LH. Relationship be-tween cytokine gene polymorphisms and re-current spontaneous abortion. Int J Clin Exp Med 2015; 8: 9786-9792.
[36] Kaur A and Kaur A. Recurrent pregnancy loss: TNF-alpha and IL-10 polymorphisms. J Hum Reprod Sci 2011; 4: 91-94.
[37] Alkhuriji AF, Alhimaidi AR, Babay ZA and Wary AS. The relationship between cytokine gene polymorphism and unexplained recurrent spontaneous abortion in Saudi females. Saudi Med J 2013; 34: 484-489.
[38] Yang QH, Shen SS and Li HE. Association of in -terleukin-10 592C/A gene polymorphism with recurrent spontaneous abortion. J Pract Obstet Gynecol 2010; 26: 705-707.
[39] Zhan FS, Wan Y, Li X and Huo ZH. Relationship between polymorphism of interleukin-10 gene promoter -592A/C and recurrent spontaneous abortion. J Ningxia Med Univ 2014; 36: 1073-1075.
[40] Saxena R and Kaur J. Th1/Th2 cytokines and their genotypes as predictors of hepatitis B vi-rus related hepatocellular carcinoma. World J Hepatol 2015; 7: 1572-1580.
[41] Wang Z, Liu QL, Sun W, Yang CJ, Tang L, Zhang
X and Zhong XM. Genetic polymorphisms in
in-flammatory response genes and their associa -tions with breast cancer risk. Croat Med J 2014; 55: 638-646.
[42] Horvat V, Mandic S, Marczi S, Mrcela M and Galic J. Association of IL-1beta and IL-10 poly-morphisms with prostate cancer risk and grade of disease in Eastern Croatian popula-tion. Coll Antropol 2015; 39: 393-400. [43] Schotte H, Willeke P, Becker H, Poggemeyer
J, Gaubitz M, Schmidt H and Schluter B. Association of extended interleukin-10 promot-er haplotypes with disease susceptibility and manifestations in German patients with sys-temic lupus erythematosus. Lupus 2014; 23: 378-385.
[44] Xu HM and Liu YR. Role of interleukin-10 gene polymorphisms in the development of coro-nary artery disease in Chinese population. Genet Mol Res 2015; 14: 15869-15875. [45] Riiskjaer M, Nielsen K, Steffensen R, Erikstrup
C, Forman A and Kruse C. Association of inter-leukin--10 promoter polymorphism and endo-metriosis. Am J Reprod Immunol 2011; 65: 13-19.
[46] Pissetti CW, Bianco TM, Tanaka SC, Nascentes GA, Grecco RL, da Silva SR and Balarin MA. Protective role of the G allele of the polymor-phism in the Interleukin 10 gene (-1082G/A) against the development of preeclampsia. Rev Bras Ginecol Obstet 2014; 36: 456-460. [47] Bombell S and McGuire W. Cytokine
polymor-phisms in women with recurrent pregnancy loss: meta-analysis. Aust N Z J Obstet Gynaecol 2008; 48: 147-154.
3
Table S1. Results of the meta-analysis of the Heterogeneity and Publication bias
Groups Allele model Dominant model Recessive model Homozygous model Heterozygous model
Ph I2 Pb Pe Ph I2 Pb Pe Ph I2 Pb Pe Ph I2 Pb Pe Ph I2 Pb Pe
-1082A>G
Overall <0.001 67.9% 0.235 0.524 0.054 40.1% 0.767 0.281 <0.00111 73.4% 0.767 0.333 0.041 42.6% 0.692 0.923 0.018 48.4% 1.000 0.543 HWE in control
Yes 0.096 36.9% 0.120 33.8% 0.082 38.8% 0.512 0.0% 0.026 49.5%
No 0.001 85.2% 0.041 68.6% 0.006 80.4% 0.025 72.7% 0.116 53.5%
-819C>T
Overall <0.001 84.1% 0.602 0.932 <0.001 85.6% 0.917? 0.996 0.041 50.4% 0.754 0.729 0.006 62.6% 0.602 0.517 <0.001 84.0% 1.000 0.821 Ethnicity
Asian <0.001 83.3% <0.001 83.8% 0.017 61.0% 0.003 70.1% <0.001 84.0%
Caucasian <0.001 92.1% <0.001 93.9% 0.516 0.0% 0.231 20.8% <0.001 93.7%
Genotype method
PCR-RFLP <0.001 85.0% <0.001 88.3% 0.034 65.3% 0.040 63.8% <0.001 88.1%
Other methods <0.001 86.1% <0.001 85.1% 0.116 46.0% 0.011 69.3% <0.001 80.4%
HWE in control
Yes <0.001 87.6% <0.001 88.8% 0.018 60.8% 0.003 70.4% <0.001 87.5%
No 0.443 0.0% 0.618 0.0% 0.568 0.0% 0.575 0.0% 0.754 0.0%
-592C>A
Overall <0.001 80.1% 1.000 0.821 <0.001 75.3% 0.150 0.091 0.001 63.7% 0.945 0.937 <0.001 67.8% 0.945 0.624 <0.001 68.6% 0.0866 0.052 Ethnicity
Asian <0.001 80.8% <0.001 74.3% 0.001 69.2% <0.001 72.2% 0.002 66.1%
Caucasian 0.005 87.3% 0.004 87.7% 0.362 0.0% 0.226 31.9% 0.009 85.4%
Genotype method
PCR-RFLP <0.001 86.2% <0.001 80.5% <0.001 78.8% <0.001 81.1% 0.002 71.0%
Other methods 0.055 56.7% 0.024 64.5% 0.811 0.0% 0.841 0.0% 0.023 64.9%
HWE in control
Yes <0.001 81.6% <0.001 76.5% 0.001 66.8% <0.001 70.8% <0.001 68.6%