Auditory-based Subband Blind Source
Separation using Sample-by-Sample and Infomax
Algorithms
Abderraouf Ben Salem
1, Sid-Ahmed Selouani
2, and Habib Hamam
3 ∗Abstract—We present a new subband decomposi-tion method for the separadecomposi-tion of convolutive mix-tures of speech. This method uses a sample-by-sample algorithm to perform the subband decomposition by mimicking the processing performed by the human ear. The unknown source signals are separated by maximizing the entropy of a transformed set of signal mixtures through the use of a gradient ascent algo-rithm. Experimental results show the efficiency of the proposed approach in terms of signal-to-interference ratio. Compared with the fullband method that uses the Infomax algorithm, our method shows an impor-tant improvement of the output signal-to-noise ratio when the sensor inputs are severely degraded by ad-ditive noise.
Keywords: blind source separation, subband decompo-sition, ear model, convolutive sources, Infomax algo-rithm.
1
Introduction
Blind source separation (BSS) is an approach trying to separate mixed sources, assumed to be statistically inde-pendent, without anya priori knowledge about original source signalssj(n), j∈ {1,· · ·, N}but using only
obser-vations xi(n), i ∈ {1,· · ·, M} throughM sensors. Such
signals are instantaneously or convolutively mixed. In this paper, we are concerned with the convolutive case, i.e. the BSS of convolved sources of speech, where source signals are filtered by impulse responses hij(n), from source j to sensor i. Mixtures in that case can be ex-pressed under a vector notation as:
X(n) =
∞
k=0
H(k)S(n−k), (1)
where X(n) = [x1(n),· · ·, xM(n)]T is a vector of
mix-tures, S(n) = [s1(n),· · ·, sN(n)]T is a vector of speech
sources, and H(k) = [hij(k)],(i, j) ∈ {1,· · ·, M} ×
{1,· · ·, N} is a matrix of FIR filters. To blindly esti-mate the sources, an unmixing process is carried out, and
∗1Canadian University of Dubai, Dubai, UAE. Email:
[email protected]. 2Universit´e de Moncton, campus de Shippa-gan E8S 1P6 NB, Canada Email:[email protected]. 3Universit´e de Moncton, campus de Moncton E1A 3E9 NB, Canada Email:[email protected].
the estimated sourcesY(n) = [y1(n),· · ·, yN(n)]T can be
written as:
Y(n) =
L−1
k=0
W(k)S(n−k) (2)
whereW(k) = [wij(k)],(i, j)∈ {1,· · ·, M} × {1,· · ·, N}
is the unmixing matrix linking the j-th output yj(n)
with the i-th mixture xi(n). Such matrix is composed
of FIR filters of length L. Each element is defined by the vectors wij(k) = [wij(0),· · ·, wij(L−1)],∀(i, j) ∈
{1,· · ·, M} × {1,· · ·, N}.
To mitigate problems in both time and frequency domains, we present an approach for separating con-volutive mixtures based on subband decomposition, referred to as Subband BSS. Subband BSS has many advantages compared to the other frequency-Domain BSS approaches regarding the well-known Permutation ambiguity of frequency bins [2]. In fact, the subband BSS’s permutation problem is quite less critical since the number of subbands that could be permuted is obviously less than the frequency bins. In addition, using a deci-mation process for each subband can considerably reduce the computational load if compared with time-domain approaches (which could be computationally demanding task in the case of real-room mixtures).
algorithm with a cost function that considers a stopband attenuation.
Throughout this paper, we present a new framework for the BSS of convolutive mixtures based on subband de-composition using an ear-model based filterbank and in-formation maximization algorithm.
2
Proposed method
In this section, we define the subband decomposition us-ing the modelus-ing of the mid-external ear and the basilar membrane that aims at mimicking the human auditory system (HAS). Afterwards, the learning rule wich per-forms the sources’ separation will be introduced.
2.1
Subband decomposition
The proposed modeling of HAS consists of three parts that simulate the behavior of the mid-external ear, the inner ear and the hair-cells and fibers. The external and middle ear are modeled using a bandpass filter that can be adjusted to signal energy to take into account the various adaptive motions of ossicles. The model of inner ear sim-ulates the behavior of the basilar membrane (BM) that acts substantially as a non-linear filter bank. Due to the variability of its stiffness, different places along the BM are sensitive to sounds with different spectral content. In particular, the BM is stiff and thin at the base, but less rigid and more sensitive to low frequency signals at the apex. Each location along the BM has a characteristic frequency, at which it vibrates maximally for a given in-put sound. This behavior is simulated in the model by a cascade filterbank. The number of filterbank depends on the sampling rate of the signals and on other param-eters of the model such as the overlapping factor of the bands of the filters, or the quality factor of the resonant part of the filters. The final part of the model deals with the electro-mechanical transduction of hair-cells and af-ferent fibers and the encoding at the level of the synaptic endings [9].
2.1.1 Mid-External Ear
The mid-external ear is modeled using a bandpass filter. For a mixture inputxi(k), the recurrent formula of this
filter is given by:
xi(k) =xi(k)−xi(k−1)+α1xi(k−1)−α2xi(k−2), (3)
where xi(k) is the filtered output, k = 1,· · ·, K is the
time index and K is the number of samples in a given block. The coefficientsα1andα2depend on the sampling frequencyFs, the central frequency of the filter and its
Q-factor.
2.1.2 Mathematical Model of the Basilar Mem-brane
After each frame is transformed by the mid-external filter, it is passed to the cochlear filter banks whose frequency responses simulate those of the BM for an auditory stim-ulus in the outer ear. The formula of the model is as follows:
xi(k) =β1,ixi(k−1)−β2,ixi(k−2)+Gi[xi(k)−xi(k−2)],
(4) and its transfer function can be written as:
Hi(z) = Gi(1−z −2)
1−β1,iz−1+β2,iz−2, (5)
where xi(k) is the BM displacement which represents
the vibration magnitude at position δi and constitutes
the BM response to a mid-external sound stimulus
xi(k). The parametersGi,β1,iandβ2,i, respectively the
gain and coefficients of filter or channeli, are functions of the position δi along the BM. Nc cochlear filters are
used to realize the model. These filters are characterized by the overlapping of their bands and a large bandwidth. We assume that the BM has a length of 35 millimeters which is approximately the case for humans. Thus, each channel represents the state of an approximately Δ = 1.46 mm of the BM. The sample-by-sample algo-rithm providing the outputs of the BM filters is given as follows.
Initializefx= (FsΔx)2;H0= 0;ri,j= 0;E0= 0.
Fori= 1toNc do
xi=iΔx;v=e−106.5xi;Fi= 7100v−100;
Ci= (27v)
2
fx ;Qi= (−8300xi+ 176.3)xi+ 4;
Gi=e−80xi;u=e− π Fi
Fs Qi;β1,i= 2u cos(2π FFsi);
β2,i=u2;Ei= 1+(2−E1i−1)Ci;Ai=EiCi.
EndDo
Fork= 1toKDo Fori= 1toNc Do
Hi= [Gi(s(k)−s(k−2)) +βi,2r1,i−
β2,iri,1]Ei+Hi−1Ai
EndDo
Fori= 1toNc Do
r1,i=Airi+1,3+Hi;yi(k) =ri,3
EndDo
Fori= 1toNc Do
Forj= 1to2Do
ri,j=ri,j+1
2.2
Learning algorithm
After performing the subband decomposition, the sepa-ration of convolved sources per subband is done by the Infomax algorithm. Infomax was developed by Bell and Sejnowski for the separation of instantaneous mixtures [3]. Its principle consists of maximizing output entropy or minimizing the mutual information between compo-nents ofY. It is implemented by maximizing, with re-spect toW, the entropy ofZ= Φ(Y) = Φ(WX). Thus, the Infomax contrast function is defined as:
C(W) =H(Φ(WX)), (6) where H(.) is the differential entropy, which can be ex-pressed asH(a) =−E[Ln(fa(a))], where fa(a) denotes
the probability density function of a variablea. The gen-eralization of Infomax for the convolutive case by using a feedforward architecture is introduced in the proposed method. Both causal and non-causal FIR filters are per-formed in our experiments. With real-valued data for vector X, entropy maximization algorithm leads to the adaptation of unmixing filter coefficients with a stochas-tic gradient ascent rule using a learning steepestμ. Then, the weights are defined as follows.
W(0) =W(0) +μ([W(0)]−T −Φ(Y(n))XT(n)), (7) and,
wij(k) =wij(k)−μΦ(yi(n))xj(n−k);∀k= 0, (8)
whereW(0) is a matrix composed of unmixing FIR filters coefficients as defined in Section 1, Y(n) and X(n) are the separated sources and the observed mixtures, respec-tively. Φ(.) is the score function ofyiwhich is a non-linear
function approximating the cumulative density function of sources, as defined in Eq. 9, wherep(yi) denotes the
probability density function ofyi.
Φ(yi(n)) =
δp(yi(n)) δyi(n)
p(yi(n)). (9)
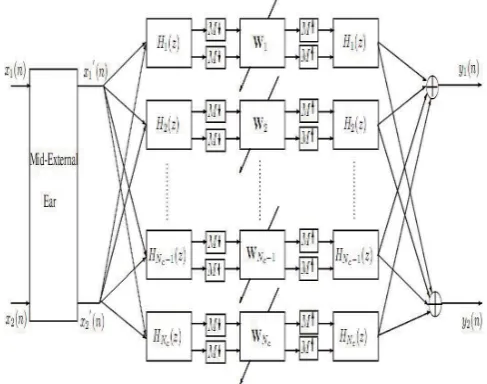
The block diagram of the proposed method is given in Fig. 1. The input signals, that are the set of mixtures, are firstly processed by the mid-external ear introduced by Eq. 3, then outputs are passed through a filterbank representing the cochlear part of the ear. A decimation process is then performed for each subband output. Such decimation is useful for many reasons. First, it improves the convergence speed because input signals are more whitened than the time domain approach. Second, the wanted unmixing filter length will be reduced by a factor of M1, whereM is the decimation factor. After perform-ing decimation, we group a set of mixtures belongperform-ing to
[image:3.595.297.541.172.364.2]the same cochlear filter to be the input of the unmixing stage. This latter gives separated sources of each subband that are upsampled by aM factor. The same filterbank is used for the synthesis stage. The estimated sources are added from different synthesis stages.
Figure 1: The ear-based framework for the subband BSS of convolutive mixtures of speech.
3
Experimental results
In order to evaluate the separation performance given by the proposed ear-based subband BSS method, a set of experiments have been carried out. In our experiments, we used as sources speech data containing two sentences spoken by a male and female speakers, those signals are at sampling rate of 8 kHz, each one is an excerpt of 6 seconds. Infomax algorithm has several parameters: the mixture signals are segmented into blocks; each block is a size of 35 samples, and the learning rate was fixed to μ = 0.001. Further, Φ(u) = 1+1e−u was
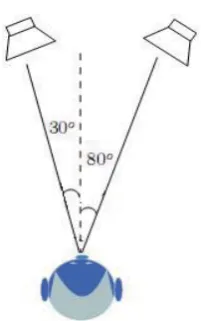
used to approximate the cumulative density function. Such sources are convoluted with impulse responses modeling the Head Related Transfer Function (HRTF) [5]. We tested our overall framework with a mixing filters measured at the ears of a dummy head, illustrated by figure 2 . We selected impulse responses associated with source positions defined by 30- and 80-degree angles in relation to the dummy head.
To evaluate the performance, the Signal to Interference Ratio (SIR) is used [4]. This reliable measurement is defined by:
SIR= 10log10||starget||
2
||einterf||2, (10)
wherestarget(n) is an allowed deformation of the target
Figure 2: The convolutive model with source positions at 30-and 80-degree angles in relation to the dummy head.
sources which accounts for the interference of the un-wanted sources. Those signals are derived from a de-composition of a given estimated sourceyi(n) of a source
si(n).
Figure 3: SIR improvement for both causal and noncausal filters. We denote byNc the number of filters that have
been used amongNc filters andM is decimation factor.
Different configurations of the subband analysis and syn-thesis stages as well as of the decimation factor have been tested. The number of subbands was fixed at 24. Through our experiments we observed that when we keep the whole number of subbands, the results were not sat-isfactory. In fact, we noticed that some subbands in high frequencies are not used, and therefore this causes distor-tions on the listened signals. However, as shown in Figure 3, the best performance was achieved for Nc = 24 and
M = 4. In addition to the use of causal FIR filters, we adapted unmixing stage weights for non-causal FIR by centering the L taps. From Figure 3, we observe that causal FIR yields to good results in SIR improvement
when compared with non-causal one. Another set of ex-periments have been carried out to evaluate the perfor-mance in the presence of an additive noise in sensors. We used the Signal-to-Noise-Ratio (SNR) which is defined in [4], by:
SNR= 10log10||starget+einterf||
2
||enoise||2 , (11)
whereenoise is an allowed deformation of the
perturbat-ing noise,stargetandeinterf were defined previously.
[image:4.595.316.525.282.472.2]Fig-ure 4 shows the SNR improvement using our subband decomposition, comparing to the fullband method, i.e. Infomax algorithm in convolutive case.
Figure 4: SNR comparison between the subband and full-band methods.
4
Conclusion
An ear-based subband BSS approach was proposed for the separation of convolutive mixtures of speech. The results showed that using a subband decomposition that mimics the human perception and using the Infomax al-gorithm yields to better results than the fullband method. Experimental results show the high efficiency of the new method in improving the SNR of unmixed signals in the case of noisy sensors. It is worth noting that an impor-tant advantage of the proposed technique is that it uses a simple time-domain sample-by-sample algorithm to per-form the decomposition.
References
[image:4.595.61.268.371.561.2][2] S. Araki, S. Makino, T. Nishikawa, and H. Saruwarati, “Fundamental Limitation of Frequency Domain Blind Source Separation for Convolutive Mixture of Speech”, IEEE-ICASSP conference, pp. 2737-2740, 2001.
[3] A. J. Bell and T. J. Sejnowski, “An Information Max-imization Approach to Blind Separation and Blind Deconvolution”,Neural Computation, pp. 1129-1159, 1995.
[4] C. Fevotte, R. Gribonval, and E. Vincent, “BSS EVAL toolbox user guide”, IRISA, Rennes, France, Technical Report 1706, 2005. [Online]. Available: http://www.irisa.fr/metiss/bss eval.
[5] B. Gardner and K. Martin, “Head Related Transfer Functions of a Dummy Head”, [Online]. Available: http://sound.media.mit.edu/ica-bench/.
[6] K. Kokkinakis and P. C. Loizou, “Subband-Based Blind Signal Processing for Source Separation in Con-volutive Mixtures of Speech”, IEEE-ICASSP Con-ference, pp. 917-920, 2007.
[7] H.-M. Park, C. S. Dhir, S.-H. Oh, and S.-Y. Lee, “A Filter Bank Approach to Independant Component Analysis for Convolved Mixtures”, Neurocomputing , pp. 2065-2077, 2006.
[8] I. Russel, J. Xi, A. Mertins, and J. Chicharo, “Blind Source Separation of Non-Stationary Convolutively Mixed Signals in the Subband Domain”, IEEE-ICASSP Conference, pp. 481-484, 2004.