Automatic Evaluation of Translation Quality for Distant Language Pairs
Hideki Isozaki, Tsutomu Hirao, Kevin Duh, Katsuhito Sudoh, Hajime Tsukada
NTT Communication Science Laboratories, NTT Corporation 2-4 Hikaridai, Seikacho, Sorakugun, Kyoto, 619-0237, Japan
{isozaki,hirao,kevinduh,sudoh,tsukada}@cslab.kecl.ntt.co.jp
Abstract
Automatic evaluation of Machine Translation (MT) quality is essential to developing high-quality MT systems. Various evaluation met-rics have been proposed, and BLEU is now used as the de facto standard metric. How-ever, when we consider translation between distant language pairs such as Japanese and English, most popular metrics (e.g., BLEU, NIST, PER, and TER) do not work well. It is well known that Japanese and English have completely different word orders, and special care must be paid to word order in transla-tion. Otherwise, translations with wrong word order often lead to misunderstanding and in-comprehensibility. For instance, SMT-based Japanese-to-English translators tend to trans-late ‘A because B’ as ‘B because A.’ Thus, word order is the most important problem for distant language translation. However, conventional evaluation metrics do not sig-nificantly penalize such word order mistakes. Therefore, locally optimizing these metrics leads to inadequate translations. In this pa-per, we propose an automatic evaluation met-ric based on rank correlation coefficients mod-ified with precision. Our meta-evaluation of the NTCIR-7 PATMT JE task data shows that this metric outperforms conventional metrics.
1 Introduction
Automatic evaluation of machine translation (MT) quality is essential to developing high-quality ma-chine translation systems because human evaluation is time consuming, expensive, and irreproducible. If we have a perfect automatic evaluation metric, we can tune our translation system for the metric.
BLEU (Papineni et al., 2002b; Papineni et al., 2002a) showed high correlation with human judg-ments and is still used as the de facto standard au-tomatic evaluation metric. However, Callison-Burch et al. (2006) argued that the MT community is overly reliant on BLEU by showing examples of poor per-formance. For Japanese-to-English (JE) translation, Echizen-ya et al. (2009) showed that the popular BLEU and NIST do not work well by using the sys-tem outputs of the NTCIR-7 PATMT (patent transla-tion) JE task (Fujii et al., 2008). On the other hand, ROUGE-L (Lin and Hovy, 2003), Word Error Rate (WER), and IMPACT (Echizen-ya and Araki, 2007) worked better.
In these studies, Pearson’s correlation coefficient and Spearman’s rank correlationρwith human eval-uation scores are used to measure how closely an automatic evaluation method correlates with human evaluation. This evaluation of automatic evaluation methods is calledmeta-evaluation. In human eval-uation, people judge the adequacy and the fluency of each translation.
Denoual and Lepage (2005) pointed out that BLEU assumes word boundaries, which is ambigu-ous in Japanese and Chinese. Here, we assume the word boundaries given by ChaSen, one of the standard morphological analyzers ( http://chasen-legacy.sourceforge.jp/) following Fujii et al. (2008)
In JE translation, most Statistical Machine Trans-lation (SMT) systems translate the Japanese sen-tence
(J0) kare wa sono hon wo yonda node sekaishi ni kyoumi ga atta
which means
(R0) he was interested in world history because he read the book
into an English sentence such as
(H0) he read the book because he was interested in world history
in which the cause and the effect are swapped. Why does this happen? The former half of (J0) means “He read the book,” and the latter half means “(he) was interested in world history.” The middle word “node” between them corresponds to “because.” Therefore, SMT systems output sentences like (H0). On the other hand, Rule-based Machine Translation (RBMT) systems correctly give (R0).
In order to find (R0), SMT systems have to search a very large space because we cannot restrict its search space with a small distortion limit. Most SMT systems thus fail to find (R0).
Consequently, the global word order is essential for translation between distant language pairs, and wrong word order can easily lead to misunderstand-ing or incomprehensibility. Perhaps, some readers do not understand why we emphasize word order from this example alone. A few more examples will clarify what happens when SMT is applied to Japanese-to-English translation. Even the most fa-mous SMT service available on the web failed to translate the following very simple sentence at the time of writing this paper.
Japanese:meari wa jon wo koroshita. Reference:Mary killed John. SMT output:John killed Mary.
Since it cannot translate such a simple sentence, it obviously cannot translate more complex sentences correctly.
Japanese:bobu ga katta hon wo jon wa yonda. Reference:John read a book that Bob bought. SMT output:Bob read the book John bought.
Another example is:
Japanese:bobu wa meari ni yubiwa wo kau tameni, jon no mise ni itta.
Reference:Bob went to John’s store to buy a ring for Mary.
SMT output:Bob Mary to buy the ring, John went to the store.
In this way, this SMT service usually gives incom-prehensible or misleading translations, and thus peo-ple prefer RBMT services. Other SMT systems also tend to make similar word order mistakes, and spe-cial care should be paid to the translation between distant language pairs such as Japanese and English. Even Japanese people cannot solve this word or-der problem easily: It is well known that Japanese people are not good at speaking English.
From this point of view, conventional automatic evaluation metrics of translation quality disregard word order mistakes too much. Single-reference BLEU is defined by a geometrical mean of n-gram precisions pn and is modified by Brevity Penalty (BP)min(1,exp(1−r/h)), whereris the length of the reference andhis the length of the hypothesis.
BLEU = BP×(p1p2p3p4)1/4.
Its range is [0, 1]. The BLEU score of (H0) with ref-erence (R0) is1.0×(11/11×9/10×6/9×4/8)1/4= 0.740. Therefore, BLEU gives a very good score to this inadequate translation because it checks only n-grams and does not regard global word order.
Since (R0) and (H0) look similar in terms of flu-ency, adequacy is more important than fluency in the translation between distant language pairs.
Similarly, other popular scores such as NIST, PER, and TER (Snover et al., 2006) also give relatively good scores to this translation. NIST also considers only local word orders (n-grams). PER (Position-Independent Word Error Rate) was designed to disregard word order completely. TER (Snover et al., 2006) was designed to allow phrase movements without large penalties. There-fore, these standard metrics are not optimal for eval-uating translation between distant language pairs.
In this paper, we propose an alternative automatic evaluation metric appropriate for distant language pairs. Our method is based onrank correlation co-efficients. We use them to compare the word ranks in the reference with those in the hypothesis.
It is not clear how well τ works as an automatic evaluation metric of translation quality. Moreover, Spearman’s ρ might work better than Kendall’s τ. As we discuss later, τ considers only the direction of the rank change, whereasρconsiders the distance of the change.
The first objective of this paper is to examine which is the better metric for distant language pairs. The second objective is to find improvements of these rank correlation-metrics.
Spearman’s ρ is based on Pearson’s correlation coefficients. Suppose we have two lists of numbers
x = [0.1,0.4,0.2,0.6],
y = [0.9,0.6,0.2,0.7].
To obtain Pearson’s coefficients between xand y, we use the raw values in these lists. If we substitute their ranks for their raw values, we get
x0= [1,3,2,4]andy0 = [4,2,1,3].
Then, Spearman’s ρ between x and y is given by Pearson’s coefficients between x0 and y0. This ρ can be rewritten as follows when there is no tie:
ρ= 1−
P
id2i n+1C3
.
Here,di indicates the difference in the ranks of the i-th element. Rank distances are squared in this formula. Because of this square, we expect that ρ decreases drastically when there is an element that significantly changes in rank. But we are also afraid thatρ may be too severe for alternative good trans-lations.
Since Pearson’s correlation metric assumes lin-earity, nonlinear monotonic functions can change its score. On the other hand, Spearman’s ρ and Kendall’s τ uses ranks instead of raw evaluation scores, and simple application of monotonic func-tions cannot change them (use of other operafunc-tions such as averaging sentence scores can change them).
2 Methodology
2.1 Word alignment for rank correlations
We have to determine word ranks to obtain rank cor-relation coefficients. Suppose we have:
(R1)John hit Bob yesterday (H1)Bob hit John yesterday
The 1st word “John” in R1 becomes the3rd word in H1. The 2nd word “hit” in R1 becomes the2nd word in H1. The 3rd word “Bob” in R1 becomes the 1st word in H1. The 4th word “yesterday” in R1 be-comes the4th word in H1. Thus, we get H1’s word order list [3, 2, 1, 4]. The number of all pairs of in-tegers in this list is4C2 = 6. It has three increasing
pairs: (3,4), (2,4), and (1,4). Since Kendall’sτ is given by:
τ = 2× the number of increasing pairs the number of all pairs −1,
H1’sτ is2×3/6−1 = 0.0.
In this case, we can obtain Spearman’sρ as fol-lows: “John” moved byd1 = 2words, “hit” moved
byd2 = 0words, “Bob” moved by d3 = 2words,
and “yesterday” moved byd4 = 0words. Therefore,
H1’sρis1−(22+ 02+ 22+ 02)/5C3 = 0.2.
Thus,τ considers only the direction of the move-ment, whereasρconsiders the distance of the move-ment. Bothρandτhave the same range[−1,1]. The main objective of this paper is to clarify which rank correlation is closer to human evaluation scores.
We have to consider the limitation of the rank cor-relation metrics. They are defined only when there is one-to-one correspondence. However, a refer-ence sentrefer-ence and a hypothesis sentrefer-ence may have different numbers of words. They may have two or more occurrences of the same word in one sentence. Sometimes, a word in the reference does not appear in the hypothesis, or a word in the hypothesis does not appear in the reference. Therefore, we cannot calculateτ andρfollowing the above definitions in general.
Here, we determine the correspondence of words between hypotheses and references as follows. First, we find one-to-one corresponding words. That is, we find words that appear in both sentences and only once in each sentence. Suppose we have:
(R2)the boy read the book
(H2)the book was read by the boy
(R3)boy read book (H3)book read boy
Thus, we lost “the.” We relax this one-to-one cor-respondence constraint by using one-to-one corre-spondingbigrams. (R2) and (H2) share “the boy” and “the book,” and we can align these instances of “the” correctly.
(R4)the1 boy2 read3 the4 book5
(H4)the4 book5 read3 the1 boy2
Now, we have five aligned words, and H4’s word order is represented by [4, 5, 3, 1, 2].
In returning to H0 and R0, we find that each of these sentences has eleven words. Almost all words are aligned by one-to-one correspondence but “he” is not aligned because it appears twice in each sen-tence. By considering one-to-one corresponding bi-grams (“he was” and “he read”), “he” is aligned as follows.
(R5) he1 was2 interested3 in4 world5
history6 because7 he8 read9 the10
book11
(H5) he8 read9 the10 book11 because7
he1 was2 interested3 in4 world5
history6
H5’s word order is [8, 9, 10, 11, 7, 1, 2, 3, 4, 5, 6]. The number of increasing pairs is:4C2 = 6pairs in
[8, 9, 10, 11] and6C2 = 15pairs in [1, 2, 3, 4, 5,
6]. Then we obtainτ = 2×(6 + 15)/11C2−1 =
−0.236. On the other hand,P
id2i = 52×6 + 22+
72×4 = 350, and we obtainρ = 1−350/12C3 =
−0.591.
Therefore, both Spearman’s ρ and Kendall’s τ give very bad scores to the misleading translation H0. This fact implies they are much better metrics than BLEU, which gave a good score to it.ρis much lower thanτ as we expected.
In general, we can use higher-order n-grams for this alignment, but here we use only unigrams and bigrams for simplicity. This algnment algorithm is given in Figure 1. Since some hypothesis words do not have corresponding reference words, the output integer list worder is sometimes shorter than the evaluated sentence. Therefore, we should not use worder[i]−iasdidirectly. We have to renumber the list by rank as we did in Section 1.
Read a hypothesis sentenceh=h1h2. . . hm and its reference sentencer=r1r2. . . rn.
Initializeworderwith an empty list.
For each wordhiinh:
• Ifhiappears only once each inhandr, appendj s.t.rj =hitoworder.
• Otherwise, if the bigramhihi+1appears only once each inhandr, appendjs.t.rjrj+1=hihi+1to worder.
• Otherwise, if the bigramhi−1hiappears only once each inhandr, appendjs.t.rj−1rj =hi−1hito
worder.
Returnworder.
Figure 1: Word alignment algorithm for rank correlation
2.2 Word order metrics and meta-evaluation metrics
These rank correlation metrics sometimes have neg-ative values. In order to make them just like other automatic evaluation metrics, we normalize them as follows.
• Normalized Kendall’sτ: NKT =(τ + 1)/2.
• Normalized Spearman’sρ: NSR =(ρ+ 1)/2.
Accordingly, NKT is 0.382 and NSR is 0.205. These metrics are defined only when the number of aligned words is two or more. We define both NKT and NSR as zero when the number is one or less. Consequently, these normalized metrics have the same range [0, 1].
In order to avoid confusion, we use these abbre-viations (NKT and NSR) when we use rank corre-lations asword order metrics, because these cor-relation metrics are also used in the machine trans-lation community for meta-evaluation. For meta-evaluation, we use Spearman’sρand Pearson’s cor-relation coefficient and call them “Spearman” and “Pearson,” respectively.
2.3 Overestimation problem
0 0.2 0.4 0.6 0.8 1.0 0 0.2 0.4 0.6 0.8 1.0
BP (brevity penalty)
normalized av erage adequac y ? ? ? ? ? ? ? ? ? ? ? ? ? ? ? ? ? ? ? ? ? ? ? ? ? ? ? ? ? ? ? ? ? ? ? ? ? ? ? ? ? ? ? ? ? ? ? ? ? ? ? ? ? ? ? ? ? ? ? ? ? ? ? ? ? ? ? ? ? ? ?? ? ? ? ? ? ? ? ? ? ? ? ? ? ? ? ? ? ? ? ? ? ? ? ? ? ? ? ? ? ? ? ? ? ? ? ? ? ? ? ? ? ? ? ? ? ? ? ? ? ? ? ? ? ? ? ? ? ? ? ???? ? ? ? ? ? ? ?? ? ? ? ? ? ? ? ? ? ? ? ? ? ? ? ? ? ? ? ? ? ? ? ? ? ? ? ? ? ? ? ? ? ? ? ? ? ? ? ? ? ? ? ? ? ? ? ? ? ?? ? ? ? ? ? ? ? ?? ? ????? ? ? ? ? ? ? ? ? ?? ? ? ? ? ? ? ?? ??? ? ? ? ? ? ? ? ?? ? ? ? ? ???? ? ? ? ???? ? ? ? ? ? ??? ? ? ? ? ? ? ? ? ? ? ? ? ? ? ? ? ? ? ? ?? ? ? ? ? ? ? ? ??????? ? ? ? ? ? ? ? ? ? ? ? ? ? ? ? ? ? ? ? ? ? ? ? ? ? ? ? ? ? ? ? ? ? ? ? ? ? ? ? ? ? ? ? ? ? ? ? ? ? ? ? ? ? ? ? ? ? ? ? ? ? ? ? ? ? ? ? ? ? ? ? ? ? ? ? ? ? ? ? ? ? ? ? ? ? ? ? ? ? ? ? ? ? ? ? ? ? ? ? ? ? ? ? ? ? ? ? ? ? ? ? ? ? ? ? ? ? ? ? ? ? ? ? ? ? ? ? ? ? ? ? ? ? ? ? ? ? ? ? ? ? ? ? ? ? ? ? ? ? ? ? ? ? ? ? ? ? ? ? ? ? ? ? ? ? ? ? ? ? ? ? ? ? ? ? ? ? ? ? ? ? ? ? ? ? ? ? ? ? ? ? ? ? ? ? ? ? ? ? ? ? ? ? ? ? ? ? ? ? ? ? ? ? ? ? ? ? ? ? ? ? ? ? ? ? ? ? ? ? ?? ? ? ? ? ? ? ? ? ? ? ? ? ? ? ? ? ? ? ? ? ? ? ? ? ? ?? ? ? ? ? ? ? ? ? ? ? ? ? ? ? ? ? ? ? ? ? ? ? ? ? ? ? ? ? ? ? ? ? ? ? ? ? ? ? ? ? ?? ? ? ? ? ? ? ? ? ? ? ? ? ? ? ? ? ? ? ? ? ? ? ? ? ? ? ? ? ? ? ? ? ? ? ? ? ? ? ? ? ? ? ? ? ? ? ? ? ? ? ? ? ? ? ? ? ? ? ? ? ? ? ? ? ? ? ? ? ? ? ? ? ? ? ? ? ? ? ?? ? ? ? ? ? ? ? ? ? ? ? ? ? ? ? ? ? ? ? ? ? ? ? ? ? ? ? ? ? ? ? ? ? ? ? ? ? ? ? ?? ? ? ? ? ? ? ? ? ? ? ? ? ? ? ? ? ? ? ? ? ? ? ? ? ? ? ? ? ? ? ? ? ? ? ? ? ? ? ? ? ? ? ? ? ? ? ? ? ? ? ? ? ?? ? ? ? ? ? ? ? ? ? ? ? ? ? ? ? ? ? ? ? ? ? ? ? ? ? ? ? ? ? ? ? ? ? ? ? ? ? ? ? ? ? ? ? ? ? ? ? ? ? ? ? ? ? ? ? ? ? ? ? ? ? ? ? ? ? ? ? ? ? ? ? ? ? ? ? ? ? ? ? ? ? ? ? ? ? ? ? ? ? ? ?? ?? ? ? ? ? ? ? ? ? ? ? ? ? ? ? ? ? ? ? ? ? ? ? ? ? ? ? ? ? ? ? ? ? ? ? ? ? ? ? ? ? ? ? ? ? ? ? ? ? ? ? ? ? ? ? ? ? ? ? ? ? ?? ? ? ? ?? ? ? ? ? ? ? ? ? ? ? ? ? ? ? ? ? ? ? ? ? ? ? ? ? ? ? ? ? ? ? ? ? ? ? ? ? ? ? ? ? ? ? ? ? ? ? ? ? ? ? ? ? ? ? ? ? ? ? ? ? ? ? ? ? ? ? ? ? ? ? ? ? ? ? ? ? ? ? ? ? ? ? ? ? ? ? ? ? ? ? ? ? ? ? ? ? ? ? ? ? ? ? ? ? ? ? ? ? ? ? ? ? ? ? ?? ? ? ? ? ? ? ? ? ? ? ? ? ? ? ? ? ? ? ? ? ? ? ? ? ? ? ? ? ? ? ? ? ? ? ? ? ? ? ? ? ? ? ? ? ? ? ? ? ? ? ? ? ? ? ? ? ? ? ? ? ? ? ? ? ? ? ? ? ? ? ? ? ? ? ? ? ? ? ? ? ? ? ? ? ? ? ? ? ? ? ? ? ? ? ? ? ? ? ? ? ? ? ? ? ? ? ? ? ? ? ? ? ? ? ? ? ? ? ? ? ? ? ? ? ? ? ? ? ? ? ? ? ? ? ? ? ? ? ? ? ? ? ? ? ? ? ? ? ? ? ? ? ? ? ? ? ? ? ? ? ? ? ? ? ? ? ? ? ? ? ? ? ? ? ? ? ? ? ? ? ? ? ? ? ? ? ? ? ? ? ? ? ? ? ? ? ? ? ? ? ? ? ? ? ? ? ? ? ? ? ? ? ? ? ? ? ? ? ? ? ? ? ? ? ? ? ? ? ? ? ? ? ? ? ? ? ? ? ? ? ? ? ? ? ? ? ? ? ? ? ? ? ? ? ? ? ? ? ? ? ? ? ? ? ? ? ? ? ? ? ? ? ? ? ? ? ? ? ??? ? ? ? ? ? ? ? ? ? ? ? ? ? ? ? ? ? ? ? ? ? ? ? ? ? ? ? ? ? ? ? ? ? ? ? ? ? ? ? ? ? ?? ? ? ? ? ? ? ? ? ? ? ? ? ? ? ? ? ? ? ? ? ? ? ? ? ? ? ?? ? ? ? ? ? ? ? ? ? ? ? ? ? ? ? ? ? ? ? ? ? ? ? ? ? ? ? ? ? ? ? ? ? ? ? ? ? ? ? ? ? ? ? ? ? ? ? ? ? ? ? ? ? ? ? ? ? ? ? ? ? ? ? ? ? ? ? ? ? ? ? ? ? ? ? ? ? ? ? ? ? ? ? ? ? ? ? ? ? ? ? ? ? ? ? ? ? ? ?
0 0.2 0.4 0.6 0.8 1.0 0 0.2 0.4 0.6 0.8 1.0 P (precision) normalized av erage adequac y ? ? ? ? ? ? ? ? ? ? ? ? ? ? ? ? ? ? ? ? ? ? ? ?? ? ? ? ? ? ? ? ? ? ? ? ? ? ? ? ? ? ? ? ? ? ? ? ? ? ? ? ? ? ? ? ? ? ? ? ? ? ? ? ? ? ? ? ? ? ? ? ? ? ? ? ? ? ? ? ? ? ? ? ? ? ? ? ? ? ? ? ? ? ? ? ? ? ? ? ? ? ? ? ? ? ? ? ? ? ? ? ? ? ? ? ? ? ? ? ? ? ? ? ? ? ? ? ?? ? ? ? ? ? ? ? ? ? ? ? ? ? ? ? ? ? ? ? ? ? ? ? ? ? ? ? ? ? ? ? ? ? ? ? ? ? ? ? ? ? ? ? ? ? ? ? ? ? ? ? ? ? ? ? ? ? ? ? ? ? ? ? ? ? ? ? ? ? ? ? ?? ?? ???? ? ? ? ? ? ? ? ? ? ? ? ? ? ? ? ? ? ? ? ? ? ? ? ?? ? ? ? ? ? ? ??? ? ? ?? ?? ? ? ??? ? ? ? ? ? ? ? ? ? ? ? ?? ? ? ? ? ? ? ? ? ??? ? ? ? ? ? ? ? ? ? ? ???? ?? ?? ? ? ? ? ? ? ? ? ? ? ? ? ? ? ? ? ? ? ? ? ? ?? ? ? ? ? ? ? ? ? ? ? ? ? ? ? ? ? ? ? ? ? ? ? ? ? ? ? ? ? ? ? ? ? ? ? ? ? ? ? ? ? ? ? ? ? ? ? ? ? ? ? ? ? ? ? ? ? ? ? ? ? ? ? ? ?? ? ? ? ? ? ? ? ? ? ? ? ? ? ? ? ? ? ? ? ? ? ? ? ? ? ? ? ? ? ? ? ? ? ? ? ? ? ? ? ? ? ? ? ? ? ? ? ? ? ? ? ? ? ? ? ? ? ? ? ? ? ? ? ? ? ? ? ? ? ? ? ? ? ? ? ? ? ? ? ? ? ? ? ?? ? ? ? ? ? ? ? ? ? ? ? ? ? ? ? ? ? ? ? ? ? ? ? ? ? ? ? ? ? ? ? ? ? ? ? ? ? ? ? ? ? ? ? ? ? ? ? ? ? ? ? ? ? ? ? ? ? ?? ? ? ? ? ? ? ? ? ? ? ? ? ? ? ? ? ? ? ? ? ? ? ? ? ? ?? ?? ? ? ? ? ? ? ? ? ? ? ? ? ? ? ? ? ? ? ? ? ? ? ? ? ? ? ? ? ? ? ?? ? ? ? ? ? ? ? ? ? ? ? ? ? ? ? ? ? ? ? ? ? ? ? ? ? ? ? ? ? ? ? ? ? ? ? ? ? ? ? ? ? ? ? ? ? ? ? ? ? ? ? ? ? ? ? ?? ? ? ? ? ? ? ? ? ? ? ? ? ? ? ? ? ? ? ? ? ? ? ? ? ? ? ? ? ? ?? ? ? ? ? ? ? ? ? ? ? ? ? ? ? ? ? ? ? ? ? ? ? ? ? ? ? ? ? ? ? ? ? ? ? ? ? ? ? ? ? ? ? ? ? ? ? ? ? ? ? ? ? ? ? ? ? ? ? ?? ? ? ? ? ? ? ? ? ? ? ? ? ? ? ? ? ? ? ? ? ? ? ? ? ? ? ? ? ? ? ? ? ? ? ? ? ? ? ? ? ? ? ? ? ? ? ? ? ? ? ? ? ? ? ? ? ? ? ? ? ? ? ? ? ? ? ? ? ? ? ? ? ? ? ? ? ? ? ? ? ? ? ? ? ? ? ? ? ? ? ? ? ? ? ? ? ? ? ? ? ? ?? ? ? ? ? ? ? ? ? ? ? ? ? ? ? ? ? ? ? ? ? ? ? ? ??? ? ? ? ? ? ? ? ? ? ? ? ? ? ? ? ? ? ? ? ? ? ? ? ? ? ? ? ? ? ? ? ? ? ? ? ? ? ? ? ? ? ? ? ? ? ? ? ? ? ? ? ? ? ? ? ? ? ? ? ? ? ? ? ? ? ? ? ? ? ? ? ? ?? ? ? ? ? ? ? ? ? ? ? ? ? ? ? ? ? ? ? ? ? ? ? ? ? ? ? ? ? ? ? ? ? ? ? ? ? ? ? ? ? ? ? ? ? ? ? ? ? ? ? ? ? ? ? ? ? ? ? ? ? ? ? ? ? ? ? ? ? ? ? ? ? ? ? ? ? ? ? ? ? ? ? ? ? ? ? ? ? ? ? ? ? ? ? ? ? ? ? ? ? ? ? ? ? ? ? ? ? ? ? ? ? ? ? ? ? ? ? ? ? ? ? ? ? ? ? ? ? ? ? ? ? ? ? ? ? ? ? ? ? ? ? ? ? ? ? ? ? ? ? ? ? ? ? ? ? ? ? ? ? ? ? ? ? ? ? ? ? ? ? ? ? ? ? ? ? ? ? ? ? ? ? ? ? ? ? ? ? ? ? ? ? ? ? ? ? ? ? ? ? ? ? ? ? ? ? ? ? ? ? ? ? ? ? ? ? ? ? ? ? ? ? ? ? ? ? ? ? ? ? ? ? ? ? ? ? ? ? ? ? ? ? ? ? ? ? ? ? ? ? ? ? ? ? ? ? ? ? ? ? ? ? ? ? ? ? ? ? ? ? ? ? ? ? ? ? ? ? ? ? ? ? ? ? ? ? ? ? ? ? ? ? ? ? ? ? ? ? ? ? ? ? ? ? ? ? ? ? ? ? ? ? ? ? ? ? ? ? ? ? ? ? ? ? ? ? ? ? ? ? ? ? ? ? ? ? ? ? ? ? ? ? ? ? ? ? ? ? ? ? ? ? ? ? ? ? ? ? ? ? ? ? ? ? ? ? ? ? ? ? ? ? ? ? ? ? ? ? ? ? ? ? ? ? ? ? ? ? ?? ? ? ? ? ? ? ? ? ? ? ? ? ? ? ? ? ? ? ? ? ? ? ? ? ? ? ? ? ? ? ? ? ? ? ? ? ? ? ? ? ? ? ? ? ? ? ? ? ? ? ? ? ? ? ? ? ? ? ? ? ? ? ? ? ? ? ? ? ? ? ? ? ? ? ? ? ? ? ? ? ? ? ? ? ? ? ? ? ? ? ? ? ? ? ? ? ? ? ? ? ? ? ? ? ? ? ? ? ? ? ? ? ? ? ? ? ? ? ? ? ? ? ? ? ? ? ? ? ? ? ? ? ? ? ? ? ? ? ? ? ? ? ? ? ? ? ? ? ? ? ? ? ? ? ? ? ? ? ? ? ? ? ? ? ? ? ? ? ? ?
Figure 2: Scatter plots of normalized average adequacy with brevity penalty (left) and precision (right). (Each?corresponds to one sentence generated by one MT system)
dozens of words. In this case, these two words determine the score of the whole sentence. If the two words appear in their order in the reference, the whole sentence obtains the best score, NSR = NKT = 1.0, in spite of the fact that only two words matched.
Solving this overestimation problem is the second objective of this paper. BLEU uses “Brevity Penalty (BP)” (Section 1) to reduce the scores of too-short sentences. We can combine the above word order metrics with BP, e.g.,NKT×BPandNSR×BP.
However, we cannot very much expect from this solution because BP scores do not correlate with human judgments well. The left graph of Figure 2 shows a scatter plot of BP and “normalized av-erage adequacy.” This graph has 15(systems) × 100(sentences) dots. Each dot (?) corresponds to one sentence from one translation system.
In the NTCIR-7 data, three human judges gave five-point scores (1, 2, 3, 4, 5) for “adequacy” and “fluency” of each translated sentence. Although each system translated 1,381 sentences, only 100 sentences were evaluated by the judges.
For each translated sentence, we averaged three judges’ adequacy scores and normalized this aver-agexby(x−1)/4. This is our “normalized average adequacy,” and the dots appears only at multiples of
1/3×1/4.
This graph shows that BP has very little correla-tion with adequacy, and we cannot expect BP to im-prove the meta-evaluation performance very much. Perhaps, BP’s poor performance was caused by the
fact that most MT systems output almost the same number of words, and if the number exceeds the length of the reference, BP=1.0 holds.
Therefore, we have to consider other modifiers for this overestimation problem. We can use other common metrics such as precision, recall, and F-measure to reduce the overestimation of NSR and NKT.
• Precision:P =c/|h|, wherecis the number of corresponding words and|h|is the number of words in the hypothesis sentenceh.
• Recall: R = c/r, where |r| is the number of words in the reference sentencer.
• F-measure: Fβ = (1 + β2)P R/(β2P +R), whereβis a parameter.
In (R2)&(H2)’s case, precision is 5/7 = 0.714 and recall is 5/5 = 1.000.
Which metric should we use? Our preliminary experiments with NTCIR-7 data showed that preci-sion correlated best with adequacy among these three metrics (P,R, andFβ=1). In addition, BLEU
is essentially made for precision. Therefore, preci-sion seems the most promising modifier.
If we multiplyP directly by NSR or NKT, those sentences with mediocre P values will lose too much of their scores. The use of √x will miti-gate this problem. Since√P is closer to 1.0 than P itself, multiplication of √P instead of P itself will save these sentences. If we apply √x twice
(
q√
P = √4P), it will further save them. There-fore, we expect×√Pand×√4
Pto work better than ×P. Now, we propose two new metrics:
NSRPα and NKTPα,
whereαis a parameter (0≤α≤1).
3 Experiments
3.1 Meta-evaluation with NTCIR-7 data
In order to compare automatic translation evalua-tion methods, we use submissions to the NTCIR-7 Patent Translation (PATMT) task (Fujii et al., 2008). Fourteen MT systems participated in the Japanese-English intrinsic evaluation. There were two Rule-Based MT (RMBT) systems and one Example-based MT (EBMT) system. All other systems were Statistical MT (SMT) systems. The task organiz-ers provided a baseline SMT system. These 15 sys-tems translated 1,381 Japanese sentences into En-glish. The organizers evaluated these translations by using BLEU and human judgments. In the human judgements, three experts independently evaluated 100 selected sentences in terms of ‘adequacy’ and ‘fluency.’
For automatic evaluation, we used a single refer-ence sentrefer-ence for each of these 100 manually evalu-ated sentences. Echizen-ya et al. (2009) used multi-reference data, but their data is not publicly available yet.
For this meta-evaluation, we measured the corpus-levelcorrelation between the human evalua-tion scores and the automatic evaluaevalua-tion scores. We simply averaged scores of 100 sentences for the pro-posed metrics. For existing metrics such as BLEU, we followed their definitions for corpus-level eval-uation instead of simple averages of sentence-level scores. We used default settings for conventional metrics, but we tuned GTM (Melamed et al., 2007) with -e option. This option controls preferences on longer word runs. We also used the para-phrase database TERp (http://www.umiacs.umd.
edu/˜snover/terp) for METEOR (Banerjee and Lavie, 2005).
3.2 Meta-evaluation with WMT-07 data
We developed our metric mainly for automatic eval-uation of translation quality for distant language pairs such as Japanese-English, but we also want to know how well the metric works for similar lan-guage pairs. Therefore, we also use the WMT-07 data (Callison-Burch et al., 20WMT-07) that covers only European language pairs. Callison-Burch et al. (2007) tried different human evaluation methods and showed detailed evaluation scores. The Europarl test set has 2,000 sentences, and The News Commentary test set has 2,007 sentences.
This data has different language pairs: Spanish, French, German ⇒ English. We exclude Czech-English because there were so few systems (See the footnote of p. 146 in their paper).
4 Results
4.1 Meta-evaluation with NTCIR-7 data
Table 1 shows the main results of this paper. The left part has corpus-level meta-evaluation with ade-quacy. Error metrics, WER, PER, and TER, have negative correlation coefficients, but we did not show their minus signs here.
Both NSR-based metrics and NKT-based metrics perform better than conventional metrics for this NT-CIR PATMT JE translation data. As we expected, ×BP and×P(1/1) performed badly. Spearman of BP itself is zero.
NKT performed slightly better than NSR. Per-haps, NSR penalized alternative good translations too much. However, one of the NSR-based metrics, NSRP1/4, gave thebest Spearman score of 0.947, and the difference between NSRPα and NKTPα was small. Modification withP led to this improve-ment.
Table 1: NTCIR-7 Meta-evaluation: correlation with hu-man judgments (Spm = Spearhu-man, Prs = Pearson)
human judge Adequacy Fluency
eval\meta-eval Spm Prs Spm Prs
P 0.615 0.704 0.672 0.876
R 0.436 0.669 0.461 0.854
Fβ=1 0.525 0.692 0.543 0.871
BP 0.000 0.515 -0.007 0.742
NSR 0.904 0.906 0.869 0.910
NSRP1/8 0.937 0.905 0.890 0.934 NSRP1/4 0.947 0.900 0.901 0.944 NSRP1/2 0.937 0.890 0.926 0.949 NSRP1/1 0.883 0.872 0.883 0.939 NSR×BP 0.851 0.874 0.769 0.910
NKT 0.940 0.922 0.887 0.931
NKTP1/8 0.940 0.913 0.908 0.944 NKTP1/4 0.940 0.904 0.908 0.949 NKTP1/2 0.929 0.890 0.897 0.949 NKTP1/1 0.897 0.869 0.879 0.936 NKT×BP 0.829 0.878 0.726 0.918
ROUGE-L 0.903 0.874 0.889 0.932
ROUGE-S(4) 0.593 0.757 0.640 0.869
IMPACT 0.797 0.813 0.751 0.932
WER 0.894 0.822 0.836 0.926
TER 0.854 0.806 0.372 0.856
PER 0.375 0.642 0.393 0.842
METEOR(TERp) 0.490 0.708 0.508 0.878
GTM(-e 12) 0.618 0.723 0.601 0.850
NIST 0.343 0.661 0.372 0.856
BLEU 0.515 0.653 0.500 0.795
The right part of Table 1 shows correlation with fluency, butadequacy is more important, because our motivation is to provide a metric that is useful to reduce incomprehensible or misunderstanding out-puts of MT systems. Again, the correlation-based metrics gave better scores than conventional metrics, and BP performed badly. NSR-based metrics proved to be as good as NKT-based metrics.
[image:7.612.316.539.108.284.2]Meta-evaluation scores of the de facto standard BLEU is much lower than those of other metrics. Echizen-ya et al. (2009) reported that IMPACT per-formed very well for sentence-level evaluation of NTCIR-7 PATMT JE data. Thiscorpus-levelresult also shows that IMPACT works better than BLEU, but ROUGE-L, WER, and our methods give better scores than IMPACT.
Table 2: WMT-07 meta-evaluation: Each source lan-guage has two columns: the left one is News Corpus and the right one is Europarl.
Spearman’sρwith human “rank”
source French Spanish German
NSR 0.775 0.837 0.523 0.766 0.700 0.593
NSRP1/8 0.821 0.857 0.786 0.595 0.400 0.685
NSRP1/4 0.821 0.857 0.786 0.455 0.400 0.714 NSRP1/2 0.821 0.857 0.786 0.347 0.400 0.714 NKT 0.845 0.857 0.607 0.838 0.700 0.630
NKTP1/8 0.793 0.857 0.786 0.595 0.400 0.714 NKTP1/4 0.793 0.857 0.786 0.524 0.400 0.714
NKTP1/2 0.793 0.857 0.786 0.347 0.400 0.714 BLEU 0.786 0.679 0.750 0.595 0.400 0.821
WER 0.607 0.857 0.750 0.429 0.000 0.500
ROUGEL 0.893 0.739 0.786 0.707 0.700 0.857
ROUGES 0.883 0.679 0.786 0.690 0.400 0.929
4.2 Meta-evaluation with WMT-07 data
Callison-Burch et al. (2007) have performed differ-ent human evaluation methods for differdiffer-ent language pairs and different corpora. Their Table 5 shows inter-annotator agreements for the human evaluation methods. According to their table, the “sentence ranking” (or “rank”) method obtained better agree-ment than “adequacy.” Therefore, we show Spear-man’s ρ for “rank.” We used the scores given in their Tables 9, 10, and 11. (The “constituent” meth-ods obtained the best inter-annotator agreement, but these methods focus on local translation quality and have nothing to do with global word order, which we are discussing here.)
Table 2 shows that our metrics designed for distant language pairs are comparable to conven-tional methods even for similar language pairs, but ROUGE-L and ROUGE-S performed better than ours for French News Corpus and German Europarl. BLEU scores in this table agree with those in Table 17 of Callison-Burch et al. (2007) within rounding errors.
to control. Improvement without new parameters is beyond the scope of this paper.
5 Discussion
It has come to our attention that Birch et al. (2010) has independently proposed an automatic evaluation method based on Kendall’s τ. First, they started with Kendall’sτ distance, which can be written as “1−NKT” in our terminology, and then subtracted it from one. Thus, their metric is nothing but NKT.
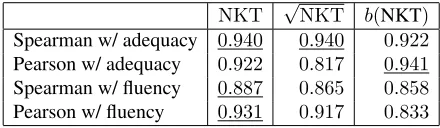
Then, they proposed application of the square root to get better Pearson by improving “the sensitivity to small reorderings.” Since they used “Kendall’sτ” and “Kendall’sτ distance” interchangeably, it is not clear what they mean by “√ Kendall’sτ,” but per-haps they mean1−√1−NKTbecause√NKTis more insensitive to small reorderings. Table 3 shows the performance of these metrics for NTCIR-7 data. Pearson’s correlation coefficient with adequacy was improved by1−√1−NKT, but other scores were degraded in this experiment.
The difference between our method and Birch et al. (2010)’s method comes from the fact that we used Japanese-English translation data and Spear-man’s correlation for meta-evaluation, whereas they used Chinese-English translation data and only Pear-son’s correlation for meta-evaluation. Chinese word order is different from English, but Chinese is a Subject-Verb-Object (SVO) language and thus is much closer to English word order than Japanese, a typical SOV language.
We preferred NSR because it penalizes global word order mistakes much more than does NKT, and as discussed above, global word order mistakes of-ten lead to incomprehensibility and misunderstand-ing.
On the other hand, they also tried Hamming dis-tance, and summarized their experiments as follows:
However, the Hamming distance seems to be more informative than Kendall’s tau for small amounts of reordering.
[image:8.612.316.536.96.160.2]This sentence and the introduction of the square root to NKT imply that Chinese word order is close to that of English, and they have to measure subtle word order mistakes.
Table 3: NTCIR-7 meta-evaluation: Effects of square root (b(x) = 1−√1−x)
NKT √NKT b(NKT)
Spearman w/ adequacy 0.940 0.940 0.922
Pearson w/ adequacy 0.922 0.817 0.941
Spearman w/ fluency 0.887 0.865 0.858
Pearson w/ fluency 0.931 0.917 0.833
In spite of these differences, the two groups inde-pendently recognized the usefulness of rank correla-tions for automatic evaluation of translation quality for distant language pairs.
In their WMT-2010 paper (Birch and Osborne, 2010), they multiplied NKT with the brevity penalty and interpolated it with BLEU for the WMT-2010 shared task. This fact implies that incomprehensible or misleading word order mistakes are rare in trans-lation among European languages.
6 Conclusions
When Statistical Machine Translation is applied to distant language pairs such as Japanese and English, word order becomes an important problem. SMT systems often fail to find an appropriate translation because of a large search space. Therefore, they often output misleading or incomprehensible sen-tences such as “A because B” vs. “B because A.” To penalize such inadequate translations, we presented an automatic evaluation method based on rank corre-lation. There were two questions for this approach. First, which correlation coefficient should we use: Spearman’sρ or Kendall’sτ? Second, how should we solve the overestimation problem caused by the nature of one-to-one correspondence?
Fu-ture work includes extension of the method so that it can outperform conventional methods even for sim-ilar language pairs.
References
Satanjeev Banerjee and Alon Lavie. 2005. Meteor:
An automatic metric for MT evaluation with improved correlation with human judgements. InProc. of ACL Workshop on Intrinsic and Extrinsic Evaluation Mea-sures for MT and Summarization, pages 65–72.
Alexandra Birch and Miles Osborne. 2010. LRscore for evaluating lexical and reordering quality in MT. In Proceedings of the Joint Fifth Workshop on Statistical Machine Translation and MetricsMATR, pages 327– 332.
Alexandra Birch, Miles Osborne, and Phil Blunsom. 2010. Metrics for MT evaluation: evaluating reorder-ing. Machine Translation, 24(1):15–26.
Chris Callison-Burch, Miles Osborne, and Philipp Koehn. 2006. Re-evaluatiing the role of Bleu in ma-chine translation research. InProc. of the Conference of the European Chapter of the Association for Com-putational Linguistics, pages 249–256.
Chris Callison-Burch, Cameron Fordyce, Philipp
Koehn, Chrstof Monz, and Josh Schroeder. 2007. (Meta-)Evaluation of machine translation. InProc. of the Workshop on Machine Translation (WMT), pages 136–158.
Etienne Denoual and Yves Lepage. 2005. BLEU in char-acters: towards automatic MT evaluation in languages without word delimiters. InCompanion Volume to the Proceedings of the Second International Joint Confer-ence on Natural Language Processing, pages 81–86.
Hiroshi Echizen-ya and Kenji Araki. 2007. Automatic evaluation of machine translation based on recursive acquisition of an intuitive common parts continuum. InProceedings of MT Summit XII Workshop on Patent Translation, pages 151–158.
Hiroshi Echizen-ya, Terumasa Ehara, Sayori Shimohata, Atsushi Fujii, Masao Utiyama, Mikio Yamamoto, Takehito Utsuro, and Noriko Kando. 2009. Meta-evaluation of automatic Meta-evaluation methods for ma-chine translation using patent translation data in ntcir-7. In Proceedings of the 3rd Workshop on Patent Translation, pages 9–16.
Atsushi Fujii, Masao Utiyama, Mikio Yamamoto, and
Takehito Utsuro. 2008. Overview of the patent
translation task at the NTCIR-7 workshop. In Work-ing Notes of the NTCIR Workshop MeetWork-ing (NTCIR), pages 389–400.
Hideki Isozaki, Katsuhito Sudoh, Hajime Tsukada, and Kevin Duh. 2010. Head Finalization: A simple re-ordering rule for SOV languages. InProceedings of the Joint Fifth Workshop on Statistical Machine Trans-lation and MetricsMATR, pages 250–257.
Maurice G. Kendall. 1975. Rank Correlation Methods. Charles Griffin.
Chin-Yew Lin and Eduard Hovy. 2003. Automatic evalu-ation of summaries using n-gram co-occurrence statis-tics. In Proc. of the North American Chapter of the Association of Computational Linguistics (NAACL), pages 71–78.
Dan Melamed, Ryan Green, and Joseph P. Turian. 2007. Precision and recall of machine translation. InProc. of NAACL-HLT, pages 61–63.
Kishore Papineni, Salim Roukos, Todd Ward, John Hen-derson, and Florence Reeder. 2002a. Corpus-based comprehensive and diagnostic MT evaluation: Initial Arabic, Chinese, French, and Spanish Results. In Proc. of the International Conference on Human Lan-guage Technology Research (HLT), pages 132–136. Kishore Papineni, Salim Roukos, Todd Ward, and
Wei-Jing Zhu. 2002b. BLEU: a method for automatic eval-uation of machine translation. InProc. of the Annual Meeting of the Association of Computational Linguis-tics (ACL), pages 311–318.