Proceedings of the Third Conference on Machine Translation (WMT), Volume 2: Shared Task Papers, pages 794–800
Sheffield Submissions for the WMT18 Quality Estimation Shared Task
Julia Ive1, Carolina Scarton2, Fr´ed´eric Blain2 and Lucia Specia2 1IoPPN, Kings College London, UK
2DCS, University of Sheffield, UK
{c.scarton, f.blain, l.specia}@sheffield.ac.uk
Abstract
In this paper we present the University of Sheffield submissions for the WMT18 Qual-ity Estimation shared task. We discuss our submissions to all four sub-tasks, where ours is the only team to participate in all language pairs and variations (37 combinations). Our systems show competitive results and outper-form the baseline in nearly all cases.
1 Introduction
Quality Estimation (QE) predicts the quality of Machine Translation (MT) when automatic eval-uation or human assessment is not possible (typi-cally at system run-time). QE is mainly addressed as a supervised Machine Learning problem with QE models trained using labelled data. These la-bels differ for different tasks, for example, binary labels for fine-grained predictions (e.g. OK/BAD for words or phrases) and continuous measure-ments of quality for coarse-grained levels (e.g. HTER (Snover et al.,2006) for sentences).
For this year’s shared task, post-edited (PE) and manually annotated data were provided. They cover four levels of predictions: sentence-level (task 1), word-level (task 2), phrase-level (task 3) and document-level (task 4), over five language pairs: English into German, Latvian, Czech and French, as well as German-English. For the first time, these data contain translations produced by neural MT (NMT) systems. Such translations are known to be more fluent but less adequate (Toral and S´anchez-Cartagena,2017).
For tasks 2 and 3, this year’s edition introduces a new task variant of predicting missing words in the translations. Thus two additional prediction types are required: (i) binary labels for gaps in the translation to indicate whether one or more to-kens are missing from a certain position, and (ii)
binary labels for words in source sentences to indi-cate which of these words lead to incorrect words in the translations.
We participated with two different systems, both available in the DeepQuest1toolkit (Ive et al.,
2018):
• SHEF-PT:an in-house re-implementation of the POSTECH system (Kim et al., 2017b), and
• SHEF-bRNN:a bidirectional recurrent
neu-ral network (bRNN) system.
We participated in all sub-tasks and submitted a total of 74 predictions (37 per system).
2 Systems Description
Our light-weight neural QE approach is based on simple encoders and requires no pre-training (bRNN). We compare its performance to the per-formance of our re-implementation of the state-of-the-art neural QE approach ofKim et al.(2017a,b) (POSTECH), which uses a complex architecture and requires resource-intensive pre-training.
2.1 Architecture
Following current best practices in neural sequence-to-sequence modelling (Sutskever et al., 2014; Bahdanau et al., 2015), our bRNN
approach employs encoders using recurrent neural networks (RNNs). Encoders encode input into an internal representation used to make classification decisions. bRNN representations at a given level rely on representations from more fine-grained levels (i.e. sentences for document, and words for phrase and sentence).
bRNNuses two bi-directional RNNs to learn the representation of the<source, MT>sentence pair.
Source and MT RNNs are trained independently.
1https://sheffieldnlp.github.io/
deepQuest
The two representations are then combined via concatenation. For word-level QE, those represen-tations (sequences of hidden stateshj associated
with words) can be used directly to make classifi-cation decisions. A sentence vector is a weighted sum of word vectors as generated by an atten-tion mechanism. Another output layer takes this sentence vector as input and produces real-value sentence-level quality scores.
For phrase-level QE, we have modified the architecture described above. It takes a three-dimensional MT input (batch length × sentence length in phrases×phrase length in words).2
Con-catenation of source and MT sentence represen-tations, as performed in our word- and sentence-level architecture, will require source inputs to be three-dimensional as well. However, as the phrase alignments are not provided with the task, three-dimensional source inputs can not be formed with-out an additional approximation.3 Instead, we
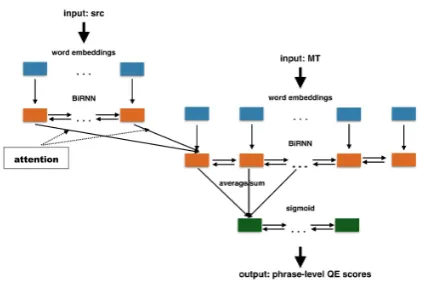
fol-low best practices of NMT (Bahdanau et al.,2015) and implement its standard encoder-decoder archi-tecture. The encoder creates source representa-tions using a bidirectional RNN, at each timestep the decoder produces a word representation tak-ing into account not only the previously produced representations, but also the sum of source word representations weighted by an attention mecha-nism.4 This process can be interpreted as
defin-ing word alignments: the resultdefin-ing decoder repre-sentations contain information on both MT words and respective parts of the source attended at each timestep. Each phrase representation can be com-puted out of word vectors: average, maximum, sum, etc. The resulting representations are pro-vided to the output layer, as illustrated in Figure1. Our document-level framework is a wrapper over sentence QE approaches. It uses a bidirec-tional RNN to summarize sentence-level represen-tations as document-level represenrepresen-tations used for regression.
More details on the architecture and
implemen-2Note that other architectural choices may lead to, for in-stance, two-dimensional inputs (batch length×phrase length in words). A representation of each MT phrase may be cre-ated without taking the rest of the translcre-ated sentence into account.
3For instance, we may assume that translation of a phrase relies on the whole source sentence. Thus, a three-dimensional input can be formed by simply repeating each source sentence along the second axis to match respective counts of phrases in each MT sentence.
[image:2.595.310.521.65.206.2]4Note thatJhaveri et al.(2018) also use this architecture for sentence-level QE.
Figure 1:bRNNphrase-level QE architecture.
tation of our sentence and document-level models can be found inIve et al.(2018).
2.2 Implementation Details
To trainPOSTECH’s predictor, we used the corre-sponding parts of the in-domain corpora provided by the organisers for the corresponding languages (≈2M sentences were selected randomly per
lan-guage pair). The only exception was EN-LV for which we had less than 2M sentences in the pus. Therefore, we combined the in-domain cor-pus with the Europarl (version 8)5and EMEA
cor-pus.6 This totaled in 1,241,615 EN-LV sentences.
For the word and phrase-level tasks, we tack-led prediction of MT error tags, source tags and MT gaps separately. For predicting source tags, we built models by swapping source and MT in-puts. POSTECH’s predictors were then trained with swapped source and target inputs. For pre-dicting gaps, we added a dummy word at the be-ginning of each MT sentence to match the count of gap tags per line.
We experimented with phrase-level representa-tions and created them by computing the sum or the average of composing word vectors. To opti-mise the usage of computational resources, in each experiment we fixed the size of a phrase in words to the upper quartile of the respective distribution in the training data.
For the document-level QE, we experimented with sentence-level representations coming from bothbRNNandPOSTECHarchitectures.
For ourPOSTECH-based document-level mod-els, we experimented with predictors trained on a
5http://www.statmt.org/wmt17/
translation-task.html
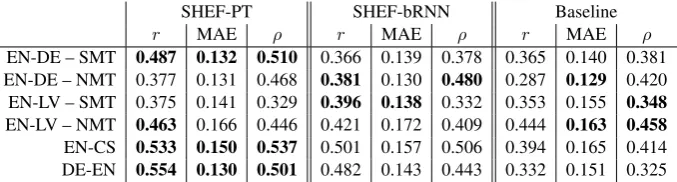
SHEF-PT SHEF-bRNN Baseline
r MAE ρ r MAE ρ r MAE ρ
[image:3.595.132.471.62.153.2]EN-DE – SMT 0.487 0.132 0.510 0.366 0.139 0.378 0.365 0.140 0.381 EN-DE – NMT 0.377 0.131 0.468 0.381 0.130 0.480 0.287 0.129 0.420 EN-LV – SMT 0.375 0.141 0.329 0.396 0.138 0.332 0.353 0.155 0.348 EN-LV – NMT 0.463 0.166 0.446 0.421 0.172 0.409 0.444 0.163 0.458 EN-CS 0.533 0.150 0.537 0.501 0.157 0.506 0.394 0.165 0.414 DE-EN 0.554 0.130 0.501 0.482 0.143 0.443 0.332 0.151 0.325
Table 1: Evaluation of our systems for task 1 on the test set. We show scores of Pearson’srcorrelation, MAE and
Spearman’sρcorrelation.
part of the English–French Europarl (version 7),7
as well as on an in-domain corpus (described in Section3.4). As mentioned before, our document-level QE system is a modular architecture wrap-ping over any sentence-level QE model. We took advantage of this modularity and also attempted multi-task learning (MTL). We pre-trained the weights of sentence-level modules (both bRNN
andPOSTECH) to predict Multidimensional Qual-ity Metrics (MQM)8 scores for sentences (more
details in Section3.4).
3 Tasks Participation
The four QE tasks correspond to different levels of quality prediction: sentence-level (task 1), word-level (task 2 and 3a), phrase-word-level (task 3b) and document-level (task 4). For each prediction level, different language pairs and system outputs are provided. Below we provide a detailed descrip-tion of the datasets together with the results for our submitted systems for each of these tasks.
3.1 Task 1: Sentence-level QE
Four language pairs are available for sentence-level scoring and ranking:
• EN-DE: sentences on the IT domain, with MT from either an SMT (26,273
train-ing /1,000development /1,000test) or an
NMT (13,442training /1,000development /
1,000test) system,
• EN-LV: sentences on the life sciences
do-main, with MT from either an SMT (11,251
training /1,000development /1,000test) or
an NMT (12,936 training / 1,000
develop-ment /1,000test) system,
• EN-CS: sentences on the IT domain, with MT from an SMT system (40,254training /
7http://www.statmt.org/wmt15/
translation-task.html
8http://www.qt21.eu/mqm-definition/
definition-2015-12-30.html
1,000development /1,000test), and
• DE-EN: sentences on the life sciences do-main, with MT from an SMT system (25,963
training /1,000development /1,000test). In summary, there are six data setting variants and the quality score for prediction is HTER in all of them. For each variant in this task we submitted two systems: SHEF-PT and SHEF-bRNN. For the ranking evaluation, we rank sentences using the predicted HTER outputted by our systems.
Following the shared task setup, Pearson’s r
correlation coefficient is used as the primary eval-uation metric for the scoring task (with Mean Absolute Error – MAE – as the secondary met-ric), whilst Spearman’sρ rank correlation
coeffi-cient is used as metric for the ranking task. The task baseline systems are Support Vector Machine (SVM) models trained with 17 baseline features
from QuEst++ (Specia et al.,2015).
We show the official results in Table 1. Both our systems outperform the baseline for all the language pairs according to the main evaluation metric (r). SHEF-bRNN is better than SHEF-PT
only for EN-DE – NMT and EN-LV – SMT. These may be cases wherebRNNis able to better capture the fluency of high-quality MT by encoding it di-rectly as sequences rather than assessing it word for word as POSTECH. On the official develop-ment set,9 EN-DE – NMT and EN-LV – SMT
translations have the best overall quality (on av-erage HTER=0.17 versus HTER=0.28 for the rest of the systems).
3.2 Task 2: Word-level QE
Task 2 uses the same datasets as task 1. Target words are assigned a binary label (OK or BAD) based on the alignments between MT and post-edits extracted by the TER tool. In this year’s edi-tion, the organisers have also proposed the
TRG words prediction
SHEF-PT SHEF-bRNN Baseline
F1 BAD F1 OK F1-MULT F1 BAD F1 OK F1-MULT F1 BAD F1 OK F1-MULT EN-DE – SMT 0.508 0.846 0.430 0.453 0.811 0.367 0.412 0.882 0.363 EN-DE – NMT 0.335 0.869 0.291 0.351 0.863 0.303 0.197 0.918 0.181 EN-LV – SMT 0.416 0.869 0.361 0.409 0.860 0.351 0.381 0.905 0.345 EN-LV – NMT 0.519 0.809 0.420 0.503 0.828 0.416 0.487 0.864 0.421 EN-CS 0.556 0.796 0.443 0.554 0.792 0.439 0.534 0.834 0.445 DE-EN 0.485 0.874 0.424 0.446 0.871 0.389 0.485 0.902 0.437 SRC words prediction
SHEF-PT SHEF-bRNN Baseline
F1 BAD F1 OK F1-MULT F1 BAD F1 OK F1-MULT F1 BAD F1 OK F1-MULT
EN-DE – SMT 0.422 0.799 0.337 0.414 0.821 0.340 - -
-EN-DE – NMT 0.314 0.841 0.264 0.330 0.865 0.286 - -
-EN-LV – SMT 0.351 0.859 0.302 0.357 0.857 0.306 - -
-EN-LV – NMT 0.444 0.814 0.361 0.444 0.800 0.355 - -
-EN-CS 0.493 0.799 0.394 0.490 0.811 0.398 - -
-DE-EN 0.392 0.887 0.348 0.366 0.875 0.320 Gaps prediction
SHEF-PT SHEF-bRNN Baseline
F1 BAD F1 OK F1-MULT F1 BAD F1 OK F1-MULT F1 BAD F1 OK F1-MULT
EN-DE – SMT 0.294 0.962 0.282 0.271 0.955 0.259 - -
-EN-DE – NMT 0.110 0.984 0.108 0.121 0.985 0.119 - -
-EN-LV – SMT 0.141 0.968 0.136 0.118 0.975 0.115 - -
-EN-LV – NMT 0.130 0.965 0.126 0.119 0.944 0.113 - -
-EN-CS 0.171 0.977 0.167 0.179 0.972 0.174 - -
-DE-EN 0.210 0.970 0.204 0.200 0.966 0.193 - -
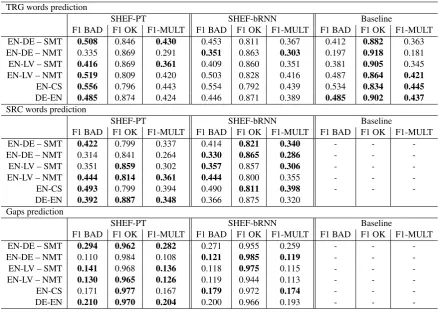
-Table 2: Evaluation of our systems for task 2 on the test set. We show scores of F1-MULT, F1 for the OK class and F1 for the BAD class.
tion of gaps and source words quality. According to the TER alignment, all source words aligned to a target word will receive the same tag as the target word. For annotating gaps, a gap tag is placed af-ter each token and in the beginning of the sentence. A gap tag will be BAD if one or more words were expected to appear in the gap, and OK otherwise.
Task 2 has 18 variants, for each of them
we again submitted two systems: SHEF-PT and SHEF-bRNN.
The primary evaluation metric of task 2 is F1-MULT: multiplication of F1-scores for the OK and BAD classes. F1-scores of OK and BAD classes are used as secondary metrics. The base-line system for the target word predictions is a Conditional Random Fields (CRF) model trained with word-level baseline features from the Mar-mot (Logacheva et al., 2016) toolkit. There are no baseline systems for the prediction of gaps or source word issues.
Table 2 shows the official results. For predic-tion of target words, SHEF-PT is the best for EN-DE – SMT, EN-LV – SMT and EN-LV – NMT. SHEF-bRNN is the best for EN-DE – NMT. This confirms our previous conclusion thatbRNNbetter
captures the fluency of high-quality MT (cf. Sec-tion 3.1). For source words and gaps prediction, SHEF-bRNN and SHEF-PT show similar perfor-mance across language pairs.
To get a closer insight into the performance of our models, we manually analysed results for the official EN-DE – SMT/NMT development sets. For those two systems either PT, or SHEF-bRNN performs the best respectively. Our ob-servations suggest that, because of pre-training, SHEF-PT better captures SMT adequacy (cf. ex-amples in Table3; the term “screen readers” is cor-rectly translated by the SMT system into German as “Bildschirmlesehilfen” and correctly marked as OK by SHEF-PT, but incorrectly marked as BAD by SHEF-bRNN). SHEF-bRNN better cap-tures NMT fluency: e.g. only the word “Trans-parenzeffekte” correctly marked as BAD from the first part of the NMT translation in Table3vs. the context of this word marked as BAD by SHEF-PT.
3.3 Task 3: Phrase-level QE
[image:4.595.80.521.61.373.2]anno-SRC to make your content accessible to screen readers , avoid using these modes .
PE um den Inhalt f¨ur Bildschirmlesehilfen zug¨anglich zu machen , vermeiden Sie diese Modi . SMT um den Inhalt f¨ur Bildschirmlesehilfen zug¨anglich machen , vermeiden Sie diese Modi .
gold OK OK OK OK OK OK OK OK OK OK OK OK OK
PT OK OK OK OK OK OK OK OK OK OK OK OK OK
bRNN OK OK OK OK BAD BAD BAD BAD BAD BAD BAD BADOK
SRC besides applying transparency effects to single objects , you can apply them to groups .
PE Sie k¨onnen Transparenzeffekte nicht nur auf einzelne Objekte , sondern auch auf Gruppen anwenden .
NMT Sie k¨onnen nicht nur Transparenzeffekte auf einzelne Objekte anwenden , sondern auch auf Gruppen anwenden .
gold OK OK OK OK BAD OK OK OK BAD OK OK OK OK OK OK OK
PT BAD BAD BAD BADBADBADOK OK OK OK BAD BAD BAD BADOK BAD
[image:5.595.74.529.63.202.2]bRNN OK OK OK OK BAD OK OK OK OK OK OK BADOK OK OK OK
Table 3: Examples of prediction errors for task 2 on the EN-DE – SMT/NMT development sets
SHEF-PT SHEF-bRNN Baseline
F1 BAD F1 OK F1-MULT F1 BAD F1 OK F1-MULT F1 BAD F1 OK F1-MULT TRG words 0.3338 0.8250 0.2754 0.3253 0.8235 0.2679 0.2714 0.9099 0.2469
Gaps 0.2730 0.8775 0.2396 0.2631 0.8785 0.2312 - -
-SRC words 0.5048 0.8137 0.4108 0.4920 0.7916 0.3895 - -
-Table 4: Evaluation of our systems for task 3a on the test set. We show scores of F1-MULT, F1 for the OK class and F1 for the BAD class.
SHEF-PT
F1 BAD F1 OK F1-MULT F1 BAD w o TRG phrases 0.2294 0.8059 0.1849 0.0794
Gaps 0.1073 0.9349 0.1003 -SHEF-ATT-SUM
F1 BAD F1 OK F1-MULT F1 BAD w o TRG phrases 0.2881 0.7614 0.2194 0.1146
Gaps 0.1028 0.9416 0.0968 -Baseline
F1 BAD F1 OK F1-MULT F1 BAD w o TRG phrases 0.3919 0.9152 0.3584 0.0194
Gaps - - -
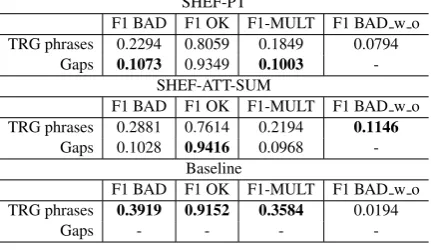
-Table 5: Evaluation of our systems for task 3b on the test set. We show scores of F1-MULT, F1 for the OK class, F1 for the BAD class and F1 for the BAD word order class.
tated at the phrase level with four labels: OK, BAD, BAD word order and BAD omission, with the phrase boundaries defined by the SMT de-coder. The last two labels are new to this task. They indicate whether a phrase is in an incorrect position in the sentence, or one or more word(s) are missing in a certain position, respectively. The subtasks of predicting gaps and source phrases quality were proposed similarly to task 2 (cf. Sec-tion3.2).
The subtask data are provided with word-level segmentation. Task 3 is therefore divided into two subtasks 3a and 3b, for word- and phrase-level pre-dictions, respectively.
Task3a – word-level prediction Word-level la-bels have been produced as follows: each word has been labelled according to the phrase it belongs to (i.e. as either OK, BAD or BAD word order); gaps have been labelled as ei-ther OK or BAD omission. The evaluation metrics for this subtask are similar to task 2.
The official results are reported in Table4. Our two systems outperform the baseline for the target words prediction, while there are no other results for gaps and source words predictions.
Task3b – phrase-level prediction In addition to the usual binary labels (OK and BAD), this subtask considers the BAD word order label. To tackle the phrase-level challenge, we implemented a new model as part of deepQuest (cf. Section2). The submitted SHEF-ATT-SUM system takes the sum of composing word vectors to create phrase vectors used for regression. This configuration performed the best on the official development set. The official results are reported in Table 5. While we perform better than the baseline for task 3a, we are not able to beat it at the phrase level. We believe this is because the dataset is too small to train a competitive neural model. There are no other results for gaps prediction.10
[image:5.595.88.515.236.295.2] [image:5.595.75.291.353.478.2]3.4 Task 4: Document-level QE
Task 4 consists in predicting document-level quality scores for MT of product reviews from the Amazon Product Reviews dataset (He and McAuley, 2016). For this task, a selection of Sports and Outdoors product titles and descrip-tions were machine translated from English into French. The MT system used is a state-of-the-art NMT system. The machine translated docu-ments were annotated with word-level MQM in-formation. The MQM taxonomy has three coarse-grained classes: accuracy, fluency and style. Each error was classified into one of the fine-grained classes within a main class and also according to its severity: minor (it does not change the meaning of the source), major (the meaning was changed by the incorrect word) or critical (besides changing the meaning the error results in a negative effect, e.g. the translation can be seen as offensive).
Document-level scores were devised as follows using the information about the errors and their severities:
score= 100∗(1.0−Tseverity∗1.0
N) (1)
whereTseverity is the sum of the severity weights
of all errors in a given document (predefined as minor= 1.0, major = 5.0and critical= 10) and N is the total number of words in this document.
For training, development and testing, 1,000, 200and269documents were made available,
re-spectively. The baseline is an SVM model trained with 15 baseline document-level features from
QuEst++. Evaluation is done in terms of Pearson’s
rcorrelation scores.
Since the MQM scores are at the word level, Equation 1 can also be used to extract scores for sentences. We exploit this feature and create MTL systems trained to predict both sentence and document-level scores. We submitted two systems officially and also report three additional systems. Our systems are listed below, where systems with an * are the official submissions:
• *SHEF-PT (in-domain): POSTECH system pre-trained with in-domain data extracted from the English–French part11 of the
Giga-word corpus,12
11https://catalog.ldc.upenn.edu/
LDC2011T10
12≈300K segments were extracted, using XenC (Rousseau, 2013), as having the best perplexity according to a language model trained on a selection of the English in-domain Amazon reviews (≈200K segments).
• SHEF-PT (out-domain): POSTECH system pre-trained with the Europarl data,
• SHEF-bRNN: our bRNN system for document-level QE,
• SHEF-MTL-PT (in-domain): multi-task
POSTECH pre-trained with the in-domain data, and
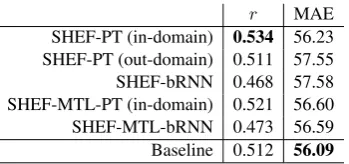
• *SHEF-MTL-bRNN: multi-taskbRNN. Table6shows the evaluation of our systems on the test set in terms of Pearson’srand MAE. The
baseline is considerably strong, achieving over
0.5 of correlation and the lowest MAE (56.09).
SHEF-PT domain) and SHEF-MTL-PT (in-domain) are the only systems that outperform the baseline. Note that the SHEF-MTL-bRNN system achieved results close to the baseline, even though it does not use any external resources (unlike the SHEF-PT systems and the baseline).
r MAE
SHEF-PT (in-domain) 0.534 56.23 SHEF-PT (out-domain) 0.511 57.55 SHEF-bRNN 0.468 57.58 SHEF-MTL-PT (in-domain) 0.521 56.60 SHEF-MTL-bRNN 0.473 56.59 Baseline 0.512 56.09
Table 6: Evaluation of our systems for task 4 on the test set. We show scores of Pearson’srcorrelation and
MAE.
4 Conclusions
We presented our systems submitted to the WMT18 QE shared task. We experimented with two different architectures: our re-implementation of the POSTECH system (SHEF-PT) and our
bRNN (bi-directional RNNs) approach (bRNN). Although PT is better than bRNN for the majority of the task variants, SHEF-bRNN is still a competitive system and, given its simplicity and independence from external re-sources, it can be seen as a good alternative for low-resource languages. In addition, it is worth mentioning that SHEF-bRNN requires consider-ably less training time than SHEF-PT, which may better fit certain scenarios.
Acknowledgments
[image:6.595.332.507.317.399.2]References
Dzmitry Bahdanau, Kyunghyun Cho, and Yoshua Ben-gio. 2015. Neural machine translation by jointly learning to align and translate. In Proceedings of International Conference on Learning Representa-tions (ICLR).
Ruining He and Julian McAuley. 2016. Ups and downs: Modeling the visual evolution of fashion trends with one-class collaborative filtering. In Pro-ceedings of the 25th International Conference on World Wide Web, WWW 2016, Montreal, Canada, April 11 - 15, 2016, pages 507–517.
Julia Ive, Fr´ed´eric Blain, and Lucia Specia. 2018. DeepQuest: a framework for neural-based qual-ity estimation. In Proceedings of COLING 2018, the 27th International Conference on Computational Linguistics: Technical Papers. The COLING 2017 Organizing Committee.
Nisarg Jhaveri, Manish Gupta, and Vasudeva Varman. 2018. Translation quality estimation for indian lan-guages. In Proceedings of th 21st International Conference of the European Association for Ma-chine Translation (EAMT).
Hyun Kim, Hun-Young Jung, Hongseok Kwon, Jong-Hyeok Lee, and Seung-Hoon Na. 2017a. Predictor-Estimator: Neural quality estimation based on tar-get word prediction for machine translation. ACM Transactions on Asian and Low-Resource Language Information Processing, 17(1):3:1–3:22.
Hyun Kim, Jong-Hyeok Lee, and Seung-Hoon Na. 2017b. Predictor-estimator using multilevel task learning with stack propagation for neural quality estimation. In Proceedings of the Second Confer-ence on Machine Translation (WMT), pages 562– 568.
Varvara Logacheva, Chris Hokamp, and Lucia Specia. 2016. MARMOT: A toolkit for translation quality estimation at the word level. InTenth International Conference on Language Resources and Evaluation (LREC), pages 3671–3674.
Anthony Rousseau. 2013. XenC: An open-source tool for data selection in natural language processing. The Prague Bulletin of Mathematical Linguistics, (100):73–82.
Matthew Snover, Bonnie Dorr, Richard Schwartz, Lin-nea Micciulla, and John Makhoul. 2006. A study of translation edit rate with targeted human annotation. InProceedings of Association for Machine Transla-tion in the Americas, pages 223–231.
Lucia Specia, Gustavo Paetzold, and Carolina Scarton. 2015. Multi-level Translation Quality Prediction with QuEst++. InThe 53rd Annual Meeting of the Association for Computational Linguistics and Sev-enth International Joint Conference on Natural Lan-guage Processing of the Asian Federation of Natural Language Processing: System Demonstrations, Bei-jing, China.
Ilya Sutskever, Oriol Vinyals, and Quoc V. V Le. 2014. Sequence to sequence learning with neural networks. InAdvances in Neural Information Pro-cessing Systems 27, pages 3104–3112.