60
Visualization of the Topic Space of Argument Search Results in args.me
Yamen Ajjour∗ Henning Wachsmuth∗∗ Dora Kiesel∗ Patrick Riehmann∗
Fan Fan∗ Giuliano Castiglia∗ Rosemary Adejoh∗ Bernd Fröhlich∗ Benno Stein∗
∗
Bauhaus-Universität Weimar, Weimar, Germany,<first>.<last>@uni-weimar.de
∗∗
Paderborn University, Paderborn, Germany,[email protected]
Abstract
In times of fake news and alternative facts, pro and con arguments on controversial top-ics are of increasing importance. Recently, we presented args.me as the first search en-gine for arguments on the web. In its initial version, args.me ranked arguments solely by their relevance to a topic queried for, making it hard to learn about the diverse topical aspects covered by the search results. To tackle this shortcoming, we integrated a visualization in-terface for result exploration in args.me that provides an instant overview of the main as-pects in a barycentric coordinate system. This
topic space is generated ad-hoc from con-troversial issues on Wikipedia and argument-specific LDA models. In two case studies, we demonstrate how individual arguments can be found easily through interactions with the visu-alization, such as highlighting and filtering.
1 Introduction
For many controversial topics in life and politics, people disagree on what is the right stance towards them, be it the need for feminism, the influence of religion, or the assassination of dictators. Stance is affected by the subjective assessment and weight-ing of pro and con arguments on the diverse aspects of a topic (Kock,2007). Building stance in a self-determined manner is getting harder and harder in times of fake news and alternative facts, due to the unclear reliability of many sources and their bias in stance and covered aspects. This was our societal motivation for the development of the first dedicated argument search engine,args.me.1
args.me allows querying for arbitrary controver-sial topics. As search results, it opposes pro and con arguments from the web, ranked by their computed relevance to the topic. args.me is non-commercial and aims to avoid bias towards either stance. In
1Also known as justargs, found at:https://args.me
(Wachsmuth et al.,2017b), we introduced the soft-ware framework and the initial argument index un-derlying args.me as well as its basic user interface.
In its first version, args.me presented arguments in textual form with linked sources, similar to the web page snippets of conventional search engines, but with color-encoded stance. Examples are given below in Figures1and2. This is adequate for com-prehending those arguments deemed most relevant. Unlike for many general information needs (Croft et al.,2009), however, reading the top results is not enough for building an informed stance. Rather, diverse aspects of a controversial topic need to be explored. In our recent study with 97 international users,aspect coveragewas seen as the second most important ranking criterion — aftersource reliabil-itybut beforerecency,user ratings, and others.2 A simple relevance ranking of possibly thousands of arguments provides weak support in that regard.
This paper shows a novel way of presenting ar-gument search results, which we designed and inte-grated into args.me to support a rapid exploration of the aspects of a topic. In particular, we visualize thistopic spacein a barycentric coordinate system (Riehmann et al.,2018), representing the distribu-tion of pro and con arguments over the main cov-ered aspects (see Figure3). Possible aspects were derived offline from the Wikipedia list of controver-sial issues3as well as from LDA topic models built based on the 291k arguments in our index, whereas the aspects actually visualized are derived ad-hoc from the search results. Through interactions with the visualization, a user can easily highlight and filter arguments on the aspects of interest. In two case studies, we demonstrate how the visualization speeds up argument search notably.
2
The user study, also including other questions related to argument search, is going to be published in another venue.
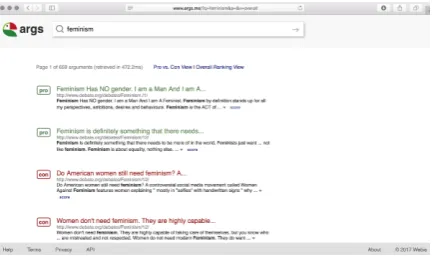
Figure 1: Thepro vs. con viewof args.me, showing the argument search results for the query “feminism”.
2 Related Work
Different systems to visually create and analyze arguments have been introduced in the past. Some of their visualizations serve as a mind map to sup-port ongoing discussions, such asgIBIS(Conklin and Begeman, 1988), Belvedere (Suthers et al., 1995), ArgVis(Karamanou et al.,2011),Dicode
(Tzagarakis and Karacapilidis,2013), and Debate-Graph (Baldwin and Price,2018). Others allow for evaluating the structure and schemes of argu-ments, such asAraucaria(Reed and Rowe,2004),
Rationale(van Gelder,2007),ArgueApply(Pührer, 2017),Argunet(Betz et al.,2018), and Truthmap-ping(Truthmapping,2018).
To support achieving consensus in a discussion,
SEAS(Lowrance et al.,2000),VUE(Baroni et al., 2015), and Dialectic Map(Niu,2016) provide a combination of automatic argument analysis and vi-sual argument summaries. With similar intentions,
Lexical Episode Plots(Gold et al.,2015),ConToVi
(El-Assady et al.,2016),NEREx(El-Assady et al., 2017), andJentner et al.(2017) visualize specific aspects of transcribed discussions.
All these works focus on single arguments or the set of arguments within a single debate or text. In contrast, we present a visualization that summa-rizes arguments from many different texts. Unlike in (Wachsmuth et al.,2017a), where we illustrated
structuralargumentation patterns in the texts of a corpus, here we target the contentof arguments. As the above-mentioned system ConToVi, we visu-alize the topic space covered by a set of arguments. While ConToVi provides insights into the flow of aspects during the discussion of a controversial topic, our visualization aims to make arguments on specific aspects easily findable. Moreover, we allow arguments to cover a weighted distribution of multiple aspects rather than only a single aspect.
Figure 2: Theoverall ranking viewof the initial version of args.me, showing results for the query “feminism”.
3 Argument Search with args.me
As presented in (Wachsmuth et al.,2017b), the ini-tial version of args.me follows approved concepts of conventional search engines (such asGoogleor
Bing), but it adapts them to the specific goals of ar-gument search. Via the interface of args.me, users can enter free text queries on controversial topics, such as “feminism” and “assassination of dictators”. While conventional search engines return links to web pages along with short textual excerpts as re-sults, args.me directly returns all arguments found to be relevant, linked to their source web pages.
Originally, args.me provided two views that dis-played the found arguments in a textual result list with color-encoded stance, as shown in Figures1 and2: apro vs. con viewthat opposes the most rele-vant pros and cons, and anoverall ranking viewthat ranks all arguments by their relevance irrespective of stance. A fundamental question in this regard is what arguments are actually deemedmost relevant? Argument search implies specific ranking criteria, such as recency, perceived quality, aspect coverage, and source reliability. Assessing these criteria is all but trivial and partly unsolved. In its current state (mid 2018), args.me therefore still relies on standard information retrieval measures (Robertson and Zaragoza,2009), i.e., it ranks arguments higher the more they match the words in the query.
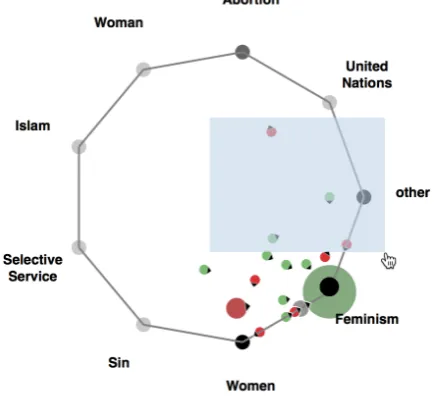
[image:2.595.309.527.62.190.2]Figure 3: Topic space visualization for the query “fem-inism”, positioning the retrieved arguments according to the eight main covered aspects andother.
is most important (see Section1), the 291,440 argu-ments currently indexed by args.me anyway come from five selected sources only (Wachsmuth et al., 2017b). Instead, we thus focus on the second most important ranking criterion: aspect coverage.
4 Visualization of the Topic Space
For building an informed stance on a controversial topic, obtaining insights into the variety of aspects touched by the topic is crucial. We aid this process by accompanying the textual result list in args.me with a topic space visualization, which puts the aspects covered by the listed arguments into the focus, highlights the main aspect of each argument, and groups arguments covering similar aspects.
4.1 Determining Topical Aspects
The first step to develop the visualization was to build a topic model that can represent the aspects of each argument in the result list. We compared two alternative approaches for this purpose:
First, we computed the relative distribution of all the over 1000 terms from the Wikipedia list of controversial issues in each indexed argument. For instance, if “Women” occurs ten times, “Woman” six times, “Feminism” four times, and no other term, then we have(Women 0.5, Woman 0.3, Femi-nism 0.2)with implicit zeros for all others. Second, we performed LDA topic modeling (Blei et al., 2003) based on the words in all arguments from our index. With an interval size of 10, we tested all numbers of topics from 10 to 100 and chose the
Aspect 1
Aspect 2
Aspect 3 Aspect 4
Aspect 5
0.2 0.3
[image:3.595.77.285.67.264.2]0.5
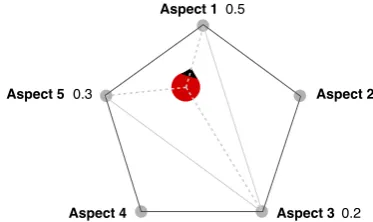
Figure 4: Positioning an argument glyph in the topic space: the black arrow shows the linear combination of weighted vertices (Aspect 30.2,Aspect 50.3,Aspect 1
0.5). The glyph itself points to the main covered aspect.
number that minimized perplexity: 40. Each aspect is then represented by all words of one LDA topic, and the relative aspect distribution is calculated by counting the occurrence of all associated words in each argument. We found the Wikipedia-based topic model to be more convincing, which is why it is set as the default in args.me.4
4.2 Visualizing Topical Aspects
To visualize the aspect-based topic space, we opted for generalized barycentric coordinates (Meyer et al.,2002), as they naturally fit our purpose: We represent an argument as a linear combination of weights for all aspects, while barycentric coordi-nates represent a point as a linear combination of the vertices of a polygon (both adding up to 1.0). Thus, the topic model can be used as input for the visualization without recalculation. Figure3shows the visualization of the results for the query “femi-nism”, consisting of two main elements: thetopic spaceand theargument glyphswithin this space.
The topic space is depicted as a regular poly-gon with one vertex for each represented aspect. Both given topic model alternatives comprise too many aspects to depict them all. To reduce visual clutter in favor of a lean visualization, we limit the maximum number of visualized aspects, such that readability is not diminished. In particular, we keep only those eight aspects that are the most frequent in the argument search results. All other aspects are merged into a ninth aspect “other”. The labels for the aspects are short terms in case of the Wikipedia-based topic model or visualized as word clouds in case of the LDA topic model.
Each argument glyph represents one argument in the form of a colored circle (green for pro, red
Figure 5: Hovering over an argument reveals the as-pects it covers (main aspect marked by a small arrow).
for con) with a small arrow pointing to the main covered aspect. The glyphs are positioned based on their aspect distribution: the stronger one aspect, the stronger a glyph is “pulled” in that direction, as sketched in Figure4. Accordingly, similar argu-ments are placed spatially near to each other. To ensure the visibility of all glyphs and to avoid over-plotting, arguments placed on top of each other are aggregated into a single glyph. The glyph size de-pends on a logarithmic mapping of the number of represented arguments. Since arguments with both stances may be grouped, the color of an aggregate glyph represents the majority stance of all argu-ments contained, from green (all pro), over gray (balanced pro/con), to red (all con).
4.3 Interacting with Topical Aspects
The integration of our visualization into args.me is shown below in Figures7and8. This newtopic space viewreplaces the old overall ranking view: it includes the textual argument ranking and adds the visualization to the right. At first, the visualization shows only the information outlined above, but it provides further details upon interaction.
Barycentric coordinates are ambiguous and may place arguments with different aspects at similar locations. For disambiguation, users can hover over a glyph to reveal all covered aspects, as exemplified in Figure5. The represented arguments are also highlighted in the textual list, given that they appear on the current result page. Vice versa, hovering over a textual argument highlights the respective glyph with a wide green or red border.
Figure 6: Selecting arguments in the topic space visual-ization filters them in the textual result list of args.me.
In addition, the visualization enables a filtering of the textual results: A user can select one or more arguments by clicking or brushing (see Figure6), in order to narrow down the list to the aspects of interest. All other arguments are grayed out.
5 Case Studies
To verify the benefit of our visualization, we finally explore two typical use cases of argument search:
topic space explorationandsearch refinement.
5.1 Topic Space Exploration
First, we consider a query for “feminism”. 659 arguments are returned by args.me for this topic, as shown in Figure7. While the top-ranked arguments seem highly relevant in general, our visualization reveals that also some rather specific aspects are covered by the search results, such as “Abortion” and “United Nations”. Interacting with the visual-ization helps explore the entire topic space.
[image:4.595.308.526.69.267.2]Figure 7: The args.me search results for the query “feminism”, along with the integrated topic space visualization. The argument hovered over in the visualization is highlighted in the textual result list (“Women don’t need...”).
Figure 8: The single filtered args.me search result on the aspectMuammar Gaddafifor the query “assassination of dictators”. The filtering is the result of clicking in the respective argument glyph in the topic space visualization.
feminism. Without the visualization, these insights would have been hard to gain; the two respective arguments were ranked at position #43 and #46.
5.2 Search Refinement
As a second example, we assume that a user looks for new arguments on the “assassination of dicta-tors”, for which args.me provides 119 results. If the user wants to refine a search to restrict it to a specific aspect of the topic only (e.g., to arguments coveringMuammar Gaddafi), a simple click on the respective argument glyph in the topic space visu-alization suffices, as illustrated in Figure8. The associated arguments are filtered and placed at the top of the result list (only one argument in the illus-trated case). With the existing interaction methods
of args.me, the argument text can be extended and its source web page shows up after clicking on it. In the old overall ranking view, the argument would have been ranked at position #34.
6 Conclusion
[image:5.595.105.500.322.498.2]References
Peter Baldwin and David Price. 2018. Debategraph. https://debategraph.org.
Pietro Baroni, Marco Romano, Francesca Toni, Marco Aurisicchio, and Giorgio Bertanza. 2015. Auto-matic evaluation of design alternatives with quan-titative argumentation. Argument & Computation, 6(1):24–49.
Gregor Betz, Sebastian Cacean, and Christian Voigt. 2018. Argunet. http://www.argunet.org.
David M. Blei, Andrew Y. Ng, and Michael I. Jordan. 2003. Latent dirichlet allocation. Journal of Ma-chine Learning Research, 3:993–1022.
Jeff Conklin and Michael L. Begeman. 1988. gIBIS: A hypertext tool for exploratory policy discus-sion. ACM Transactions on Information Systems, 6(4):303–331.
Bruce Croft, Donald Metzler, and Trevor Strohman. 2009. Search Engines: Information Retrieval in Practice, 1st edition. Addison-Wesley Publishing Company, USA.
Mennatallah El-Assady, Valentin Gold, Carmela Acevedo, Christopher Collins, and Daniel Keim. 2016. ConToVi: Multi-party conversation explo-ration using topic-space views. Computer Graphics Forum.
Mennatallah El-Assady, Rita Sevastjanova, Bela Gipp, Daniel Keim, and Christopher Collins. 2017. NEREx: Named-entity relationship exploration in multi-party conversations. Computer Graphics Fo-rum, 36(3):213–225.
Tim van Gelder. 2007. The rationale for rationale. Law, Probability & Risk, 6(1-4):23–42.
Valentin Gold, Christian Rohrdantz, and Mennatallah El-Assady. 2015. Exploratory text analysis using lexical episode plots. In Eurographics Conference on Visualization (EuroVis) - Short Papers. The Euro-graphics Association.
Wolfgang Jentner, Mennatallah El-Assady, Bela Gipp, and Daniel A. Keim. 2017. Feature alignment for the analysis of verbatim text transcripts. EuroVis Workshop on Visual Analytics (EuroVA).
Areti Karamanou, Nikolaos Loutas, and Konstantinos Tarabanis. 2011. ArgVis: Structuring political delib-erations using innovative visualisation technologies.
Electronic Participation, pages 87–98.
Christian Kock. 2007. Dialectical obligations in politi-cal debate. Informal Logic, 27(3):233–247.
John D. Lowrance, Ian W. Harrison, and Andres C. Ro-driguez. 2000. Structured argumentation for analy-sis. InProceedings of the 12th International Confer-ence on Systems Research, Informatics, and Cyber-netics: Focus Symposia on Advances in Computer-Based and Web-Computer-Based Collaborative Systems, pages 47–57.
Mark Meyer, Alan Barr, Haeyoung Lee, and Mathieu Desbrun. 2002. Generalized barycentric coordinates on irregular polygons. Journal of Graphics Tools, 7(1):13–22.
Tamara Munzner. 2014. Visualization Analysis and De-sign. AK Peters Visualization Series. CRC Press.
Hui Niu. 2016.Pedagogical Efficacy of Argument Visu-alization Tools. Ph.D. thesis, Education: Faculty of Education.
Jörg Pührer. 2017. ArgueApply: A mobile app for ar-gumentation. InInternational Conference on Logic Programming and Nonmonotonic Reasoning, pages 250–262. Springer.
Chris Reed and Glenn Rowe. 2004. Araucaria: Soft-ware for argument analysis, diagramming and repre-sentation. International Journal on Artificial Intelli-gence Tools, 13(04):961–979.
Patrick Riehmann, Dora Kiesel, Martin Kohlhaas, and Bend Fröhlich. 2018. Visualizing a thinker’s life.
IEEE Transactions on Visualization and Computer Graphics.
Stephen Robertson and Hugo Zaragoza. 2009. The probabilistic relevance framework: BM25 and be-yond. Foundations and Trends in Information Re-trieval, 3(4):333–389.
Daniel Suthers, Arlene Weiner, John Connelly, and Massimo Paolucci. 1995. Belvedere: Engaging stu-dents in critical discussion of science and public pol-icy issues. InProceedings of the 7th World Confer-ence on Artificial IntelligConfer-ence in Education, pages 266–273.
Truthmapping. 2018. Truthmapping. https://www. truthmapping.com.
Manolis Tzagarakis and Nikos Karacapilidis. 2013. On the exploitation of semantic types in the visualiza-tion of complex argumentative discourses. In Pro-ceedings of the 2nd International Workshop on Intel-ligent Exploration of Semantic Data, page 3. ACM.
Henning Wachsmuth, Giovanni Da San Martino, Dora Kiesel, and Benno Stein. 2017a. The impact of modeling overall argumentation with tree kernels. In Proceedings of the 2017 Conference on Empiri-cal Methods in Natural Language Processing, pages 2379–2389. Association for Computational Linguis-tics.