Abstract— This paper studies the effect of the tool electrode wear on the accuracy of the Rotating Electrical Discharge Machining (REDM). Two mathematical models of REDM are presented: the first one considers machining with the face of the end tool electrode and the second one considers EDM with the lateral side of the electrode. The software for computer simulation of EDM machining with the side and face of the electrodes has been developed. This simulation model for NC contouring EDM using rotating electrode may also be applied for tool electrode path optimization. The experimental results confirm the validity of the proposed mathematical models and the simulation software.
Index Terms - micro EDM, electrode wear, accuracy, rotating electrode
I. INTRODUCTION
Today’s manufacturing industries are facing challenges from advanced difficult-to-machine materials (tough super alloys, ceramics, and composites), stringent design requirements (high precision, complex shapes, and high surface quality), and machining costs. The greatly-improved thermal, chemical, and mechanical properties of the material (such as improved strength, heat resistance, wear resistance, and corrosion resistance), are making ordinary machining processes unable to machine them economically. The technological improvement of manufacturing attributes can be achieved by high efficiency Rotating Electrical Discharge Machining (REDM: Electrical Discharge Grinding-EDG or Electrical Discharge Milling), Abrasive Electrodischarge Grinding (AEDG), Rotary Electrochemical Arc/Discharge Machining – RECAM/RCDM or grinding using metallic bond diamond wheels. These machining processes use a rotating tool.
The Electrical Discharge Machining process is widely used to machine complicated shapes with high accuracy on hard and advanced materials including hardened steels,
Manuscript received July 1, 2009. This work was supported in part by the European Commission project „Micro-Technologies for Re-Launching European Machine Manufacturing SMEs (LAUNCH-MICRO)”.
J. Kozak is with Warsaw University of Technology, ul. Narbutta 85, 02-524 Warsaw, Poland, (phone: +48 022 2348362; fax: +48 022 8499436; e-mail: jkozak64@ wp.pl).
Z. Gulbinowicz is with Warsaw University of Technology, ul. Narbutta 85, 02-524 Warsaw, Poland, (phone: +48 022 2348207; e-mail: zgulbinowicz@ interia.pl).
super-alloys, tungsten carbides, electrically conductive engineering ceramics, polycrystalline diamonds etc. The material is removed by the thermal energy generated by a series of electrical discharges between the tool electrode and workpiece immersed in the dielectric. There is no direct contact between the tool and workpiece during the machining process. The workpiece can be formed, either by replication of a shaped tool electrode or by 3D movement of a simple electrode like in milling.
The fabrication of complex shaped multiple electrodes used in the die-sinking micro and macro Electrical Discharge Machining (EDM) is expensive and time consuming [1]. Moving a simple shaped electrode along designed tool paths has been proposed as a solution to some of these problems [2]-[5]. A numerical control system enables the workpiece or tool electrode to move a previously programmed path. In this way, very complex 2 or 3 dimensional shape according to the design requirement can be shaped.
However, the tool wear during machining adversely affects the accuracy of the machined components. The problem of tool wear in 3D micro and macro EDM using simple shaped electrodes has been addressed by applying the Uniform Wear Method to maintain the electrode shape unchanged and compensate for the longitudinal tool wear [5]-[8].
Tool wear in EDM is characterized by the relative tool-electrode wear which is generally defined as ratio tool wear rate (TWR, which is the volume of tool material removed per unit time) to material removal rate (MRR, which is the volume of workpiece material removed per unit time):
MRR TWR =
ν (1)
Depending upon the operating parameters of REDM, the relative wear may be 0.01-2. Changes in dimensions of tool due to wear during machining is expected to reflect in the actual depth of cut and finally in the profile and dimensional accuracy of machined parts.
Results of investigation of EDM with rotating electrode reported in [9], [10] show a slope curvilinear profile of bottom surface of machined groove due to the wear of disk electrode. Controlling the path of electrode can reduce shape error. In the paper [3] preliminary analysis of shape error indicates that one of the main factors leading to shape errors is wheel wear. More extended study of this problem based on mathematical modeling and experiments is reported in [11], [12], where the general differential equation described relationship between tool wear, initial and final shape of
The Mathematical Modeling and Computer
Simulation of Rotating Electrical Discharge
Machining
machined surface has been derived. Effect of wheel wear on dimensional accuracy of grinding is known from theory of tolerances. During machining of parts loaded together in a pocket, and in one pass of the rotary tool, height of parts achieved is random variable in the machined set. Based on the assumption of constant wear rate, uniform probability density function (PDF) has been obtained for height of machined parts [11].
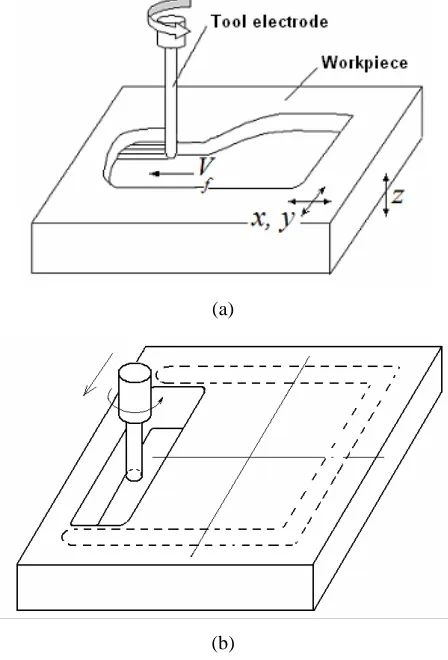
In this paper, the two case of machining operations are taken for mathematical modeling: the first one considers machining with the face of the tool electrode and the second one considers EDM with the side of the electrode (Fig.1).
(a)
[image:2.595.343.528.81.190.2](b)
Fig. 1. Example of EDM using rotating tool electrode: (a) machining with the face of end electrode, (b) machining by
the side of rotating electrode
In first case, the technique of integrating Uniform Wear Method with CAD/CAM software has been successful in generating very complex 3D cavities, it involves a time consuming, empirical approach for selecting tool paths and machining parameters. Therefore, it is necessary to develop a theoretical model which accounts for the effect of tool wear on the surface profile generation during each pass. As the number of passes can be very large, a corresponding computer simulation software simulation also needs to be developed. II. MATHEMATICAL MODELLING OF REDM SHAPING BY END
TOOL ELECTRODE
The principal scheme of shaping using the end tool electrode process is presented in Fig. 2. The initial profile of workpiece is given by function y = f(x). The electrode is controlled to move along the tool head path y = g(x).
[image:2.595.57.281.204.534.2]However, the longitudinal tool wear results in the profile of machined surface y = F(x), which is different from g(x).
Fig. 2. Principal scheme for mathematical modeling of REDM by end tool electrode
The purpose of this mathematical modeling and computer simulation is to determine surface profile y = F(x), taking into account the change in tool length which occurs due to the wear of electrode. The final profile depends on input parameters, such as depth of cut a0, initial profile y = f(x), diameter of tool d0 and tool head path y = g(x).
Let us consider the case of machining presented in Fig.2, when the initial surface is y = f(x) and g(x) = constant.
In determining the profile of machined surface, the following assumptions are made:
- Changes in tool shape are neglected because the Uniform Wear Method is applying,
- The gap between tool electrode and workpiece is neglected.
- Material removal rate MRR is equal:
f
V d x F x f
MRR=( ( )− ( ))⋅ 0⋅ (2)
- and a tool wear rate TWR, defined as the volume of tool material removed per unit time, for g(x) = const. is:
dt dF d TWR
4
2 0
⋅
=
π
(3)or
f
V dx dF d dt dx dx dF d TWR
4 4
2 0 2
0 = ⋅
⋅
=π π (4)
where Vf is feed rate.
After substituting (2) and (4) in (1) for ν , the equation describing the profile of machined surface takes the following form:
( )
x mf mF dx dF + =(5) with initial condition is F(0) = – a(0) (Fig. 2), where
0
4 d m
⋅ =
π ν
is the wear factor.
In many cases it is possible to assume, that relative wear during machining is constant (m = const.), i.e. it is not dependent on the actual depth of cut. For this condition and for f(x) = 0, the solution of (5) becomes:
) exp( )
(x a0 mx
F =− − (6)
While considering accuracy, the profile is conveniently described in coordinates relative to required allowance, -a0, i.e.:
( )
[
1 exp( )]
)
(x F a0 a0 mx
h = − − = − − (7)
form of notations is used. The non-dimensional variables are defined as h =h/ a0 andx=x/L, where L is the length of
workpiece. In non-dimensional form, (7) can be written as:
(
A x)
h=1−exp− ⋅ (8)
where
0
4 d
L L
m A
⋅ ⋅ = ⋅ =
πν .
[image:3.595.48.273.205.380.2]Profiles of machined surface obtained for different values of A are presented in Fig. 3. As result of wear, the depth of cut is decreasing and the tool wear rate (TWR) is changing during machining. For comparison in Fig. 3 the dashed line (for A = 1) represents the profile neglecting.
Fig. 3. Profile of machined surfaces for different values of A In general case when g = g(x), mathematical model of REDM process is described as follows:
( )
dx dg x mf mF dx
dF + = +
(9) with initial condition F(0) = -a0.
The machining accuracy may be improved by control motion of tool electrode. For example, the tool wear can be compensated by moving tool or workpiece along y-axis, to obtain flat surface. In the case when initial surface is flat f(x) = 0 and the depth of cut is equal a0, the required flat shape is F(x) = –a0. Therefore, based on solution (9) the linear path of tool is needed, which can be described as follows:
x m a H x g
y= ( )= 0− 0⋅ ⋅ (10)
where H0 is initial position of tool head.
For machining with constant feed rate Vf along x-axis, the compensation of the tool wear can be obtained by adding the relative motion of the tool/workpiece with constant feed rate Vy along y-axis equal:
f f
y V
d a V
m a V
0 0 0
4 ⋅
⋅ − = ⋅ ⋅ − =
π ν
(11) This theoretical conclusion about linear path of tool electrode for compensation of wear has been confirmed by the experiments [5].
III. MATHEMATICAL MODELLING OF REDM SHAPING BY LATERAL SURFACE OF TOOL ELECTRODE
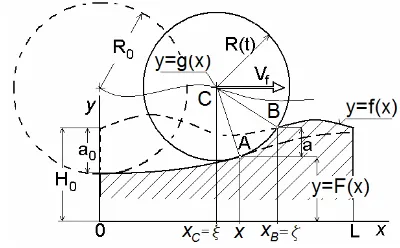
The principal scheme of shaping using the end tool electrode process is presented in Fig. 5. The purpose of this mathematical modeling and computer simulation is to
determine the profile of generated surface y = F(x), taking into account the change in tool diameter which occurs due to the tool wear of rotary tool during machining (Fig. 5). The final surface profile depends on the input data, such as depth of cut a0, initial surface profile y = f(x), diameter of the tool d0 and the curvilinear path of the center of tool y = g(x).
For the modeling purpose the following assumptions were made:
- The inter electrode gap s is constant and included to the effective radius of tool i.e. R=R(electrode)+s.
- Actual depth of cut, a, is determined by the position of points A and B, which are point tangency of the tool electrode to the generated profile and intersection point of the tool and the initial profile y = f(x), respectively (Fig. 5).
- Feed rate along axis y is significant lower in compare to the feed rate Vf i.e. the value of <<1
dx dg
.
- Changes in the tool shape along the axis of rotation are neglected.
Fig. 4. Scheme of machining with curvilinear path of rotating tool
After machining for certain time t, the center of the tool has reached the coordinate xC = ξ, the feed rate is V(t) = Vf and the effective tool radius due to the wear is R(t).
The material removal rate MRR at <<1 dx dg
is:
f
f f F x b V
V b a
MRR= ⋅ ⋅ =[( (ζ)− ( )]⋅ ⋅ (12)
where Vf is the feed rate, b is width of workpiece and
ς
is function of x, ς=ς( )
x .The coordinates of intersection point B
(
ς,f( )
ς)
can be calculated from the relation AC=BC (Fig. 5):(
ξ)
2[
( ) ( )
ξ]
2(
ς ξ)
2[
( ) ( )
ς ξ]
2g f g
x F
x− + − = − + − (13)
The tool wear rate TWR, is given by:
( )
dt dR t R b
TWR=−2π⋅ ⋅ ⋅ (14)
Since
f
V d dR dt d d dR dt dR
ξ ξ
ξ =
= (15)
and according to the relation from Fig. 5,
( )
[
( ) ( )
]
2(
)
22t = gξ −F x + x−ξ
R (16)
[image:3.595.325.525.306.430.2]( ) ( )
[
]
(
)
− − + − −= 1 1
ξ ξ ξ ξ ξ d dx x d dx dx dF d dg x F g R dt dR (17) Substituting (12) and (17) into (1) and performing transformation, the profile of machined surface can be described by (18):
( )
[
]
( )
( )
[
]
[
(
( )
)
]
− − − − + − = = − + dx d F g x dx dg dx d F g f dx d F g F dx dF ξ ξ ξ ξ ξ ς π ν ξ ξ π ν 1 2 2 (18)with initial condition F = F(0) = g(0)-R(0).
Generally, the value of relative tool wear is depending on the depth of cut a= f
( ) ( )
ς −F x i.e.ν =ν( )
a , and this function can be only determined experimentally.An additional equation to (18) and (13) can be derived from the condition for tangency of the tool to the profile machined surface at the point A as follows:
( ) ( )
[
ξ −]
=x−ξ dx dF x Fg (19)
The described above mathematical model can be used in following processes: REDM/EDG (side EDM milling), AREDM, RECAM/RCDM and grinding (in this case from definition of the G-ratio,ν =1G).
Based on the presented mathematical model, computer simulation of evolution of workpiece profile can be carried out by using in-house developed software and two main tasks can be formulated:
(1) The tool path, g(x), and initial shape of surface, f(x), are known but the resulting shape of the machined surface, F(x), and needs to be predicted.
(2) For a required shape of the machined surface, F(x), the tool path, g(x), needs to be determined in order to compensate for the tool wear.
These tasks have been solved numerically using the Finite Difference Method and iterative procedure.
In many cases the changes in the radius and the differences between coordinates x and ξ (for points A and B, respectively) are usually small when compared to the initial radius. Therefore ≅1
dx dξ
and (18) will evolve in:
( )
[
]
[
( )
( )
]
dx dg F x g x f F x g F dx dF + − = − + π ν π ν 2 2 (20)This simplified mathematical model can be successfully used to plan REDM operations and in solving the mentioned above two main tasks.
IV. SOFTWARE FOR COMPUTER SIMULATION
The software developed in this study supports process design for the EDMM. The software is easy to use, menu driven application allowing evaluating the effect of various parameters on process performance.
Programming of kinematics of the tool electrode can be achieved by supplying program with tool path in x direction described. Geometry of the surface at the beginning of machining can be defined in two ways:
- by supplying software with the surface equation, y = f(x));
- by supplying software with coordinates of the surface (for
example, a surface just obtained a machining process cycle can be used as a starting surface for the next machining operation).
The important feature of the software is the capability to define relative tool wear as function of depth of cut.
[image:4.595.307.543.148.313.2]Input date is inserted in the overlap Data .The windows for input data are shown in Fig. 5.
Fig. 5. Overlap Data
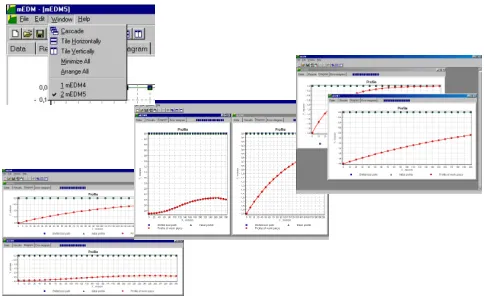
Results of simulation can be viewed in two ways: tables of coordinates of points of the workpiece surface and 2D graphs.
Fig. 6. Different option of simultaneously presentation of results of many simulations
Figure 7 shows an example of a graph of REDM machined surface defined by function y = a/(1+bsin(2
π
x/λ
). The tool path was given by g(x) = H0-a0+R0 = constant (in Fig. 7 is shown shifted tool path to axis x).Graphical results are presented in overlap window Diagram, where:
Final profile is presented by red line: Profile of workpiece Initial profile-green line: Initial profile
[image:4.595.308.550.356.504.2]Fig. 7. The profiles from software screen (R0=10 mm, a0=0.6,
ν=0.3)
In Fig. 8 is shown simulation of REDM process with compensation of tool wear. An effect of periodical changes in the depth on final shape is appeared on machined surface.
Fig. 8. The surface profile and tool path at EDM with compensation of tool wear (R0=10 mm, a0=0.6, ν=0.3).
V. EXPERIMENTAL VERIFICATION
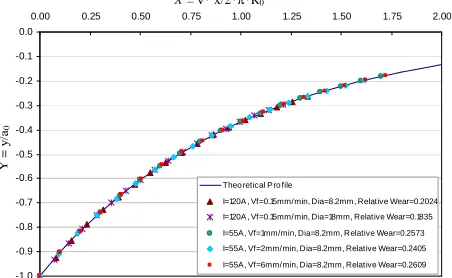
The theoretical model and simulation results were verified in Rotary Electrical Discharge Machining (REDM) on M35K Mitsubishi, EDM - NC machine tool using electrode with diameter of 8.2 and 18 mm. The range for workpiece movement was 0-160 mm for x-axis. Experiments were performed on tool steel material P233330 (HRC 56) with copper electrode using the following process parameters: Pulse voltage of U 40V, Pulse current I: 55 and 120A, Pulse on time tp = pulse off time t0: 60 and 120 µs, Depth of cut a0: 1.2 and 1.5mm, Feed rate Vf: 0.15, 1.0, 2.0, and 6.0 mm/min, Rotation speed n: 200 rpm. For different combination of setting parameters for verification used non-dimensional
system coordinates x
R X
0
2 ⋅ =
πν and a0
y
Y = . The results are presented in Fig. 9.
-1.0 -0.9 -0.8 -0.7 -0.6 -0.5 -0.4 -0.3 -0.2 -0.1 0.0
0.00 0.25 0.50 0.75 1.00 1.25 1.50 1.75 2.00
Theo retical P ro file
I=120A , Vf=0.15mm/min, Dia=8.2mm, Relative Wear=0.2024 I=120A , Vf=0.15mm/min, Dia=18mm, Relative Wear=0.1835 I=55A , Vf=1mm/min, Dia=8.2mm, Relative Wear=0.2573 I=55A , Vf=2mm/min, Dia=8.2mm, Relative Wear=0.2405 I=55A , Vf=6mm/min, Dia=8.2mm, Relative Wear=0.2609
Y
=
y
/a0
X = ν* x/2*π*R0
Fig. 9. Comparison of theoretical and experimental results in non-dimensional system coordinates. Setting parameters: tp =
t0 = 120 µs, n=200 rpm
Further experiments were carried out on EDIOS-16 machine tool using copper electrode with diameter of 4 mm, pulse on time 160 µs pulse off time 10 µs and the maximal travel distances in X axis were 0-50 mm.
The machining conditions are shown in the Table 1. Table 1. The machining conditions for experiments carried
out on EDIOS-16 Setting parametrs
Test t a0 I U ne TWR MRR
min mm A V rev/min mm3/min mm3/min
a 25 1 6 90 600 0,033 9,077 b 19 1,5 10 50 2700 0,254 2780 c 18 0,5 5 100 6000 1,954 3,262
[image:5.595.314.540.56.195.2](a)
-1,14 -1,13 -1,12 -1,11 -1,1 -1,09 -1,08
0 10 20 30 40 50 60
X, mm
Y
,
m
m
Experimental Simulation
(b)
-0,93 -0,92 -0,91 -0,9 -0,89 -0,88 -0,87 -0,86 -0,85 -0,84
0 10 20 30 40 50 60
X, mm
Y
,
m
m
Experimental Simulation ni(y)
(c)
-0,7 -0,6 -0,5 -0,4 -0,3 -0,2 -0,1 0
0 10 20 30 40 50 60
X, mm
Y
,
m
m
[image:6.595.57.281.52.391.2]Experimental Simulation
Fig. 10. Comparison of theoretical and experimental results Experimental verifications show high accuracy of developed mathematical model and computer simulation. An overall average of 6 % (of the initial depth of cut) deviation was found between simulation and experimental results.
VI. CONCLUSION
The study showed a good agreement of theoretical and experimental results of modeling of REDM process. The developed software can be useful for analysis of the REDM process, parameter optimization and surface prediction. Computer simulation of REDM has a significant potential to be used in industry.
REFERENCES
[1] M. Kunieda, B. Lauwers , K.P. Rajurkar , B. M. Schumacher : Advancing EDM through fundamental insight into the process, Annals of the CIRP, 54, 2, 599-622
[2] P. Bleys, J. P. Kruth, B. Lauwers, 2001, Milling EDM of 3D shapes with tubular electrodes, Proceedings of ISEM XIII, 555-567 [3] P. Bleys, J. P. Kruth, 2001, Machining complex shapes by numerically
controlled EDM, Int. J. of Electrical machining, 6: 61-69
[4] J. P Kruth, B. Lauwers, W. Clappaert, 1992, A study of EDM pocketing, Proceedings of ISEM X, 121-135.
[5] Z. Y. Yu, T. Masuzawa, M. Fujino, 1998, Micro-EDM for three-dimensional cavities, --Development of Uniform Wear Method--, Annals of the CIRP, Vol. 47/1:169-172.
[6] K. P. Rajurkar, Z. Y. Yu, 2000, 3D micro EDM using CAD/CAM, Annals of the CIRP, Vol. 49/1:127-130.
[7] Z. Y. Yu, T. Masuzawa, M. Fujino, 1996, A basic study on 3D Micro-EDM, Die & Mould Technology, Vol.11, No. 8:122-123 (in Japanese).
[8] Z. Y. Yu, J. Kozak, K. P. Rajurkar, 2003, Modeling and simulation of micro EDM process, Ann. CIRP, 52/1: 143-146
[9] Y. Uno, A. Okada, M. Itoh, T. Yamaguchi, 1996, EDM of groove with rotating disk electrode, Int. J. of Electrical Machining, 1:13-20 [10] J. Quian, H. Ohmori, T. Kato, I. Marinescu, 2000, Fabrication of
micro shapes of advanced materials by ELID- Grinding, Transactions of NAMRI/SME, vol. 27, pp. 269-278,