Index Terms—Drilling canned cycle, hole quality, Pareto
ANOVA analysis, Taguchi methods.
Abstract— Several factors influence the accuracy of drilled holes. The most obvious ones are the cutting conditions (cutting speed and feed rate) and cutting configurations (tool material, diameter, and geometry). As such, most previous studies have concentrated on these factors. However, in CNC drilling operations, choosing to use canned cycles may have significant effect on drilled hole quality. The objective of this project is to explore this possibility in detail.
This paper presents experimental and analytical results of an investigation into the dimensional accuracy and surface finish of drilled holes using different canned cycles. A traditional analysis, the Pareto ANOVA, and the Taguchi S/N ratio are employed to determine the effects of the three major input parameters (cutting speed, feed rate, and canned cycle) on three key accuracy characteristics of drilled holes (diameter error, circularity, and surface roughness), as well as to obtain an optimal combination of the input parameters. The work and tool materials selected are aluminum 6061 and high-speed steel (HSS), respectively. The results indicate that the canned cycle has a profound effect on drilled hole quality, and, in general, canned cycle spot drilling produces the best results.
I. INTRODUCTION
Drilling is one of the oldest and the most widely used of all machining processes, comprising about one third of all metal-machining operations [1]. It is used to create or to enlarge a round hole in a workpiece by the relative motion of a cutting tool, called a drill or drill bit. Various methods of drilling are in use, such as conventional drilling, deep hole drilling, and peck drilling. The choice of a drilling method depends on the size, tolerance, and surface finish needed, as well as the production requirements and which machine is available to perform the job.
Several factors influence the quality of drilled holes. The most obvious ones are the cutting conditions (cutting speed and feed rate) and cutting configurations (tool material, diameter, and geometry). Consequently, most previous
Manuscript received February 5, 2009. This work was supported by a Curtin University of Technology research grant.
M. N. Islam is a lecturer at the Department of Mechanical Engineering, Curtin University of Technology, GPO Box U1987, Perth, WA 6845, Australia (phone: +618 9266 3777; fax: +618 9266 2681; e-mail:
N. H. Rafi is a postgraduate student at the Department of Mechanical Engineering, Curtin University of Technology, GPO Box U1987, Perth, WA 6845, Australia (e-mai
P. Charoon is a postgraduate student at the Department of Mechanical Engineering, Curtin University of Technology, GPO Box U1987, Perth, WA 6845, Australia (e-mai
studies [2]-[5] have concentrated on these factors. Nonetheless, a few researchers have examined the influence of certain additional factors: Pirtini and Lazoglu [6] studied cutting force, Nouari, List, Girot and Gehin [7] studied tool wear, and Bono and Ni [8] studied thermal distortion. Islam, Jawahir and Kirby [9] included canned cycles in their input variables list; however, their treatment of the topic was brief and their findings inconclusive. Therefore, the effect of a canned cycle on the dimensional accuracy and surface finish of drilled holes needs further investigation; the quality of holes should not be compromised for the sake of higher productivity.
II. DRILLING CANNED CYCLE
A canned cycle is a sequence of machine operations initiated by a single code. The code acts as a shortcut that simplifies the program. A number of different canned cycles are in use for computer numerical control (CNC) drilling operations, of which the chip-breaking canned cycle (G73), spot drilling canned cycle (G81), and deep hole canned cycle (G83) are the three most popular choices (Fig. 1). A brief description of these operations is given in the following paragraphs.
A chip-breaking canned cycle is used for drilling a material that has the tendency to produce stringy chips. In other words, the chips form around the tool and do not break easily. G73 can be used to break the chips out of the hole by slightly retracting the tool during a drilling operation.
A spot drilling canned cycle is applied for normal drilling. The tool will plunge into the bottom of the hole and then rapidly retract from the bottom of the hole. Drilling is performed from point R to point Z.
A deep hole canned cycle is utilized when a deep hole is being machined to allow the chips to be cleared at certain intervals. If a drill plunges too deep into the hole, the chips will pack up around the flute of the drill bit. As the drill continues to go deeper, the packing of chips will cause the drill bit to break. Drilling is performed from point R to point Z. Q is the depth of cut for each cutting feed. After clearing the chips, the drill bit rapidly traverses back to point R, and the cutting feed is performed again.
III. SCOPE
The main objective of this project is to investigate the three major quality characteristics of drilled holes produced on a CNC machining centre using three canned cycles: the chip-breaking canned cycle (G73), the spot drilling canned cycle (G81), and the deep hole canned cycle (G83). For a drilling operation, diameter error, circularity, and surface roughness
An Investigation into Effect of Canned Cycles on
Drilled Hole Quality
Fig. 1. Three drilling canned cycles
(as determined by arithmetic averages or Ra values) are the three
most important quality characteristics; thus, they are used here for monitoring the quality of drilled holes. The three main input parameters are cutting speed, feed rate, and canned cycles. A general-purpose coordinate measuring machine (CMM) and a surface roughness analyzer are employed for the measurement of the output parameters. The results are analyzed with three techniques:; (i) a traditional analysis, (ii) a Pareto analysis of variation, and (iii) Taguchi’s signal-to-noise ratio (S/N) analysis. The expected outcomes of this project are to find the effects of the three input parameters on the accuracy of drilled holes and, subsequently, to optimize the input parameters.
It is worth pointing out that drilling is not regarded as a precision-machining operation; as a result, additional operations are required to improve the accuracy levels of drilled holes. Even so, experience shows that while the surface roughness of drilled holes can be enhanced by applying subsequent finishing operations, improving geometric accuracies is difficult [2]. Furthermore, when different tools are used for finishing operations, which occurs in most cases, the geometric inaccuracies of drilled holes are increased. The present study examines the utility and limitations of CNC drilling operations used to achieve a better quality of drilled holes.
I. EXPERIMENTAL WORK
The experiments were planned using Taguchi’s orthogonal array methodology [10]. A three-level L27 orthogonal array
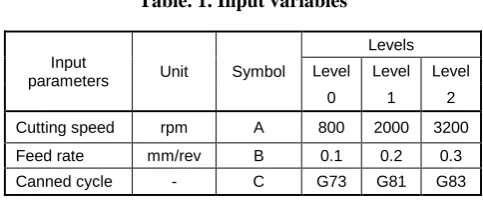
[image:2.595.51.547.50.191.2] [image:2.595.305.547.296.397.2]was selected for our experiments. Aluminium 6061 was chosen as the work material because of its extensive use in the industry. Through holes were designed with a φ12×24 mm hole size. Three blocks of aluminium 6061, each containing nine holes marked H1 to H9, were drilled on a vertical CNC machining center (Leadwell V-30 Machining Center, Taiwan). Machining was performed under wet conditions. Three new, 12 mm-diameter high-speed steel (HSS) drill bits, one for each component, were used to perform the drilling operation. Center drills were employed for initial positioning. The input parameters (cutting speed, feed rate, and canned cycle) were chosen on the basis of the capacity and limiting cutting conditions of the CNC machine; details are given in Table. 1.
The precision measurement data was obtained using a general-purpose coordinate measuring machine (CMM;
Model 7.10.7, Brown & Shape, USA) and the roughness parameter (Ra, the arithmetic average) was measured with a
surface finish analyzer (Surftest SJ-201P, Mitutoya, Japan).
Table. 1. Input variables
Input
parameters Unit Symbol
Levels
Level Level Level
0 1 2
Cutting speed rpm A 800 2000 3200
Feed rate mm/rev B 0.1 0.2 0.3
Canned cycle - C G73 G81 G83
II. RESULTS AND ANALYSIS
An enormous amount of data was obtained and subsequently analyzed. Due to space constraints, only a few are illustrated, although in the analysis of the work, all these relationships were considered at different stages. In the traditional analysis, the mean values of the measured variables were used. For the Taguchi method, the signal-to-noise ratio was calculated using the following formula [10]:
−
= 10log1
∑
12y n N
S (1)
where S/N is the signal-to-noise ratio (in dB), n is the number of observations, and y is the observed data.
The above formula is suitable for quality characteristics for which “the smaller the better” holds true. This is the case for all three quality characteristics considered. The higher the value of the S/N ratio, the better the result is, because it guarantees optimum quality with minimum variance.
A. Diameter Error
error, G81 was the best, G83 was medium, and G73 was the worst. For a φ12 mm hole, the expected size limits are 12.000–12.180 mm for normal-quality drilling and 12.000–12.110 mm for high-quality drilling [11]. All holes produced were within the expected tolerance limit; however, CNC drilling operations performed on CNC machines should produce high quality holes. In this case, only G73 qualified as high-quality, with a tolerance range of 90 micrometers, whereas G83 and G73 produced 118 and 134 micrometer ranges, respectively.
Table. 2. Diameter measurement data
Input parameters Unit Canned Cycles G73 G81 G83
Mean diameter mm 12.100 12.039 12.070
Diameter error µm 100 39 70
Range of measurement µm 180 90 117
6 x Standard deviation µm 134 36 118
It was also noted that in all cases the holes were oversized, which is a common problem in drilling operations. Galloway [2] identified this problem in 1957, and concluded that it is caused by the variation in relative lip heights of the drill. Other possible reasons are runout of the drill when attached to the machine, thermal distortion, a non-symmetric point angle, and runout of the chisel edge.
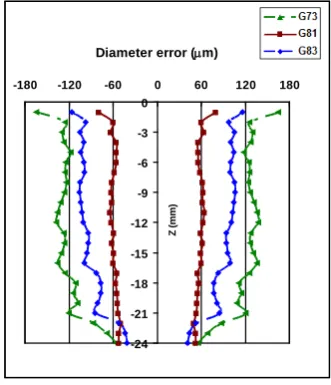
Changes in average diameter error along the hole axis for different canned cycles are illustrated in Fig. 2. This type of error is commonly known as error in shape. Fig. 2 confirms that G81 produced the most uniform size variation, whereas G73 was the worst. This suggests that a worsening of the hole profile took place due to increased vibration, caused by multiple changes of drilling direction during the pecking action of the drill. The diameter and the diameter-to-length ratio are two other major factors affecting error of shape, and are not included in this study. Fig. 2 also shows a bell mouth shape for all holes; that is, enlargement at the entry of the hole, regardless of the type of canned cycle applied. The enlargement of the hole at entry could have been caused by the wobbling of drills during positioning.
Variation in the average diameter error for different holes is shown in Fig. 3, grouped by three levels of cutting speed. For all cutting conditions, in terms of diameter error, G81 was the best, followed by G83 and G73. Contrary to the findings of some other researchers (e.g., Kurt, Kaynak and Bagci [3]), no increase in the dimensional error was noted when the cutting speed and feed rate were increased. Kurt, Kaynak and Bagci performed their experiment under dry conditions, whereas our experiment was performed under wet conditions. As a result, in our case the effect of thermal distortion was minimized. Fig. 3 also shows that for all three cutting speed ranges—low, medium, and high—diameter error decreased as feed rate increased. In our view, diameter error was reduced when feed rate was increased, due to the reduction of drill engagement time with the hole.
The Pareto ANOVA analysis for dimensional error given in Table. 3 illustrates that the canned cycle (C) had the most significant effect on diameter error (P = 85.41 %) when drilling aluminium 6061. Compared to the canned cycle, the other two independent parameters—the feed rate (B) and the
cutting speed (A)—contributed to diameter error only by very small percentages (P = 7.35 % and 2.59 %, respectively). Moreover, the remaining interactions were almost negligible.
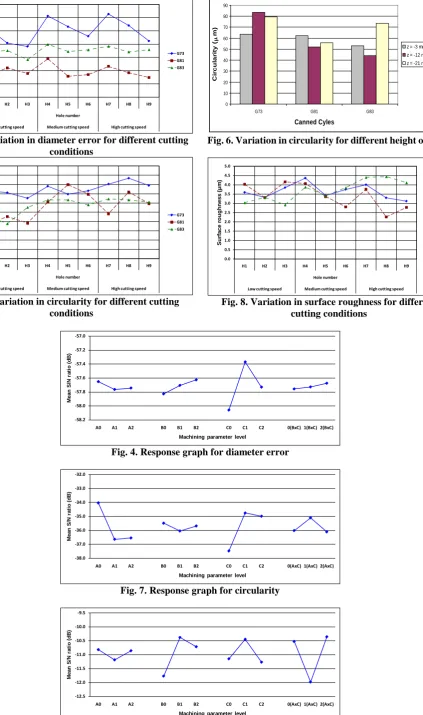
The response graph for diameter error shown in Fig. 4 demonstrates that the canned cycle (C) had the most significant effect on diameter error among the three cutting parameters, followed by the feed rate (B) and the cutting speed (A). The low cutting speed (800 rpm) was the best cutting speed for achieving a low value for diameter error. The best values of B and C were selected using a B × C two-way table, which is not included in this paper due to space constraints.
Fig. 2. Change of diameter error along hole axis
Based on the above S/N ratio and Pareto ANOVA analyses, it was found that the optimal combination to achieve a low value for diameter error was A0B2C1; that is, a low cutting
speed, a high feed rate, and using a spot drilling canned cycle (G81).
B. Circularity
For drilled holes, circularity (also known as roundness or out-of-roundness) is another important quality characteristic, and it is geometric in nature. A large circularity value is problematic for parts with relative motion: it induces vibration and heat. Circularity is measured from a cross-section perpendicular to the axis of a hole or a cylinder, and is defined by two concentric boundaries within which each circular element of the surface must lie. 60 points were probed for each hole cross-section, and the circularity was calculated using the built-in software package of the CMM. The circularity of each hole was checked at three different heights: z = -3 mm (i.e., near the top of the produced hole), z = -12 mm (i.e., near the middle of the produced hole), and z = -21 mm (i.e., near the bottom of the produced hole).
The variation in average circularity for different holes, grouped by three levels of cutting speed, is given in Fig. 5. From this figure, it appears that G73 produced the highest circularity error, followed by G81 and G83. There was a slight increase in circularity values with an increase in cutting speed, whereas the effect of the feed rate was minimal. The rates of change of circularity, related to cutting speed, were different for different canned cycles, suggesting an interaction between the cutting speed and canned cycle. The variation in
-180 -120 -60 0 60 120 180
-24 -21 -18 -15 -12 -9 -6 -3 0
Z
(
mm)
average circularity at three hole heights is illustrated in Fig. 6. No clear trend was apparent. However, G73 produced the highest circularity values compared to other canned cycles, and G83 produced the highest circularity value differential at the top and at the bottom of the hole.
The Pareto ANOVA analysis of circularity given in Table. 4 illustrates that both canned cycle and cutting speed had a highly significant effect on circularity with C (P = 37.77 %) and A (P = 36.42 %). Among the interactions, A × C had the most significant effect on circularity (P = 8.34 %). The main contributor to the circularity error was the runout of the drill when attached to the machine, which increased with the increase in cutting speed.
The response graph for circularity shown in Fig. 7 indicates that the cutting speed (A) had the most significant effect on circularity, followed by the canned cycle (C) and feed rate (B). The interaction between the cutting speed and canned cycle (A×C) greatly contributed to the circularity of the holes. The medium feed rate (0.2 mm/rev) was the best feed rate for achieving the best circularity value. The best values of A and C were selected using an A × C two-way table, which is not included due to space constraints.
Based on the above S/N ratio and Pareto ANOVA analyses, it was found that the optimal combination for achieving a low circularity value of was A0B0C1; that is, a low cutting speed
and a low feed rate, using a spot drilling canned cycle (G81). Surface profiles of all 27 holes at three heights were constructed, each using 60 probe points. From these profiles, no clear trend was noted, and thus they are not included in this paper.
C. Surface Roughness
Surface roughness, another important quality characteristic of drilled holes, needs attention. For each hole, the surface roughness is measured parallel to the hole axis at four radial positions using a surface finish analyzer. The variation in average surface roughness for different holes, grouped by three levels of cutting speed, is given in Fig. 8. From this figure, it can be seen that the surface roughness of the holes produced by G81 was high at a low cutting speed, and it gradually decreased as the cutting speed was increased. Conversely, the surface roughness of the holes produced by G83 was the lowest when the cutting speed was also the lowest, and it increased with the increase in cutting speed. No particular trend was noted for the holes produced by G73. From this, it can be concluded that an interaction exists between cutting speeds and canned cycles, which is strongly influenced by surface roughness. This was later confirmed by the Pareto analysis (see Table. 5). It is interesting to note that all three graphs meet where both cutting speed and feed rates are at their respective medium levels.
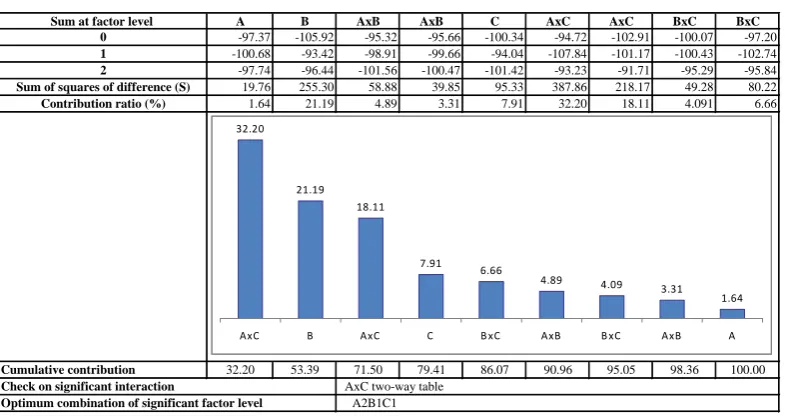
The Pareto ANOVA analysis for surface roughness given in Table. 5 shows that the feed rate (B) has the most effect on the surface roughness (P = 21.19 %), followed by the canned cycle (C) (P = 7.91 %) and the cutting speed (A) (P = 1.64 %). However, the interaction of cutting speed and canned cycle (A × C) had the most significant effect on surface roughness (P = 32.20 %).
According to the mean S/N response graph for surface roughness in Fig. 9, it can be seen that the feed rate (B) had the most significant effect on surface roughness, followed by the canned cycle (C) and cutting speed (A). The influence of feed rate on surface roughness is well known, and in most cases,
with an increase in feed rate, surface roughness deteriorates. The interaction between the cutting speed and canned cycle (A × C) had the most influence on the surface roughness of the holes. The medium feed rate (0.2 mm/rev) was the best feed rate for achieving a low value of surface roughness. The best values of A and C were selected using an A × C two-way table, which is not included in this paper.
Based on the above S/N ratio and Pareto ANOVA analyses, it was found that the optimal combination for achieving a low value of surface roughness was A2B1C1; that is, a high cutting
speed, a medium feed rate, and using a spot drilling canned cycle (G81).
III. CONCLUDING REMARKS
The research presented in this paper demonstrates that canned cycles have a profound effect on the quality of drilled holes. In general, the spot drilling canned cycle (G81) produced the best results. All three quality characteristics considered—diameter error, circularity, and surface roughness—deteriorate due to the pecking action of the chip breaking canned cycle (G73) and deep hole canned cycle (G83). Therefore, unless there are requirements compelling their use, both the chip breaking and deep hole canned cycles should be avoided.
The experimental results presented in this paper show that drilled holes are always oversized, and a bell mouthshape is present in all holes; that is, there is enlargement at the entry of the hole, regardless of the type of canned cycle applied. The enlargement of the hole at entry can be caused by the wobbling of drills during positioning.
Drilling is a complex, three-dimensional cutting process, with conditions varying along the entire cutting edge. The process is further complicated by the different pecking actions of drilling with different canned cycles. Consequently, some trends observed in this study could not be explained fully, and further research is needed for their precise understanding.
REFERENCES
[1] W-C. Chen, and C-C. Tsao, “Cutting performance of different coated twist drills”, J. of Materials Proc. Tech., vol. 88, pp. 203-207, 1999. [2] D. F. Galloway, “Some experiments on the influence of variation
factors on drill performance”, Trans. ASME, vol. 57, pp.191-231, 1957.
[3] M. Kurt, Y. Kaynak, and E. Bagci, “Evaluation of drilled quality in AL 2042 alloy”, Int. J. Adv. Manuf. Technol., vol. 37, pp.1051-1060, 2008.
[4] El-Tammimi, and S. M. Darwish, “Geometric accuracies of NC and conventionally drilled holes”, J. of Materials Processing Tech., vol. 75, pp.111-116, 1998.
[5] M. Kurt, E. Bagci, and Y. Kaynak, “Application of Taguchi methods in the optimisation of cutting parameters for surface finish and diameter accuracy in dry drilling process, Int. J. Adv. Manuf. Technol., 2008. [6] M. Pirtini, and I. Lazoglu, “Forces and hole quality in drilling”, Int. J.
of Machine Tools and Manufacture, vol. 45, pp.1271-1281, 2005. [7] M. Nouari, G. List, F. Girot, and D. Gehin, "Effect of machining
parameters and coating on wear mechanisms in dry drilling of aluminum alloys." Int. J. of Machine Tools and Manufacture, vol. 45, pp.1436-1442, 2005.
[8] M. Bono, and J. Ni, “The effects of thermal distortion on the diameter and cylindricity of dry drilled holes”, Int. J. of Machine Tools and Manufacture, vol. 41, pp. 2261-2270, 2001.
[9] M. N. Islam, I. S. Jawahir, and I. J. Kirby, "A CMM-based geometric accuracy study of CNC drilling operations", ME Trans., IEAust., vol. 16, pp. 2261-2270, 1991.
[10] G. Taguchi, Introduction to Quality Engineering, Translated into English by Asian Productivity Organization, Tokyo, 1989.
0.0 20.0 40.0 60.0 80.0 100.0 120.0 140.0
H1 H2 H3 H4 H5 H6 H7 H8 H9
Hole number
Low cutting speed Medium cutting speed High cutting speed
Di
amet
er erro
r
(
μ
m)
[image:5.595.97.521.55.771.2]G73 G81 G83
Fig. 3. Variation in diameter error for different cutting conditions
0.0 10.0 20.0 30.0 40.0 50.0 60.0 70.0 80.0 90.0 100.0
H1 H2 H3 H4 H5 H6 H7 H8 H9
Hole number
Low cutting speed Medium cutting speed High cutting speed
Ci
rcu
lari
ty (
μ
m)
[image:5.595.156.440.358.776.2]G73 G81 G83
Fig. 5. Variation in circularity for different cutting conditions
0 10 20 30 40 50 60 70 80 90
G73 G81 G83
Canned Cyles
C
ir
c
u
la
rit
y
(µ
m)
z = -3 mm (top) z = -12 mm (middle) z = -21 mm (bottom)
Fig. 6. Variation in circularity for different height of holes
0.0 0.5 1.0 1.5 2.0 2.5 3.0 3.5 4.0 4.5 5.0
H1 H2 H3 H4 H5 H6 H7 H8 H9
Hole number
Low cutting speed Medium cutting speed High cutting speed
S
u
rf
ace
ro
u
g
h
n
ess (
μ
m)
G73 G81 G83
Fig. 8. Variation in surface roughness for different cutting conditions
-58.2 -58.0 -57.8 -57.6 -57.4 -57.2 -57.0
A0 A1 A2 B0 B1 B2 C0 C1 C2 0(BxC) 1(BxC) 2(BxC)
M
ean
S
/N
r
at
io
(
d
B
)
Machining parameter level
Fig. 4. Response graph for diameter error
-38.0 -37.0 -36.0 -35.0 -34.0 -33.0 -32.0
A0 A1 A2 B0 B1 B2 C0 C1 C2 0(AxC) 1(AxC) 2(AxC)
M
ean
S
/N
r
at
io
(
d
B
)
Machining parameter level
Fig. 7. Response graph for circularity
-12.5 -12.0 -11.5 -11.0 -10.5 -10.0 -9.5
A0 A1 A2 B0 B1 B2 C0 C1 C2 0(AxC) 1(AxC) 2(AxC)
M
ean
S
/N
r
at
io
(
d
B
)
Machining parameter level
Table. 3. Pareto ANOVA analysis for diameter error
A B AxB AxB C AxC AxC BxC BxC
-518.87 -520.46 -519.37 -519.16 -522.55 -519.14 -519.23 -519.82 -519.88 -519.89 -519.35 -519.65 -519.64 -516.32 -519.73 -519.74 -519.56 -519.18 -519.70 -518.64 -519.44 -519.65 -519.58 -519.58 -519.49 -519.08 -519.40
1.761 5.006 0.136 0.465 58.142 0.555 0.393 0.841 0.777
2.59 7.35 0.20 0.68 85.41 0.82 0.58 1.24 1.14
85.41 92.76 95.35 96.58 97.72 98.54 99.22 99.80 100
Check on significant interaction
A0B2C1 BxC two-way table
Optimum combination of significant factor level Cumulative contribution
Sum at factor level
Contribution ratio (%) 2 1 0
Sum of squares of difference (S)
Factor and interaction
85.41
7.35
2.59 1.24 1.14 0.82 0.68 0.58 0.20
[image:6.595.102.494.324.527.2]C B A B xC B xC AxC AxB AxC AxB
Table. 4. Pareto ANOVA analysis for circularity
A B AxB AxB C AxC AxC BxC BxC
-306.37 -319.44 -323.16 -321.87 -337.29 -324.18 -329.05 -320.79 -327.34 -329.81 -324.45 -320.34 -318.98 -312.89 -315.92 -318.19 -319.11 -315.70 -328.94 -321.23 -321.62 -324.27 -314.94 -325.02 -317.88 -325.22 -322.08
1059.38 38.57 11.94 42.08 1098.72 151.71 242.71 59.75 203.82
36.42 1.33 0.41 1.45 37.77 5.22 8.34 2.054 7.01
Cumulative contribution 37.77 74.20 82.54 89.55 94.76 96.82 98.26 99.59 100.00
A0B0C1
Contribution ratio (%)
Check on significant interaction
Optimum combination of significant factor level
BxC two-way table
2
Sum of squares of difference (S) Sum at factor level
0 1
37.77 36.42
8.34 7.01 5.22
2.05 1.45 1.33 0.41
C A AxC B xC AxC B xC AxB B AxB
Table. 5. Pareto ANOVA analysis for surface roughness
A B AxB AxB C AxC AxC BxC BxC
-97.37 -105.92 -95.32 -95.66 -100.34 -94.72 -102.91 -100.07 -97.20 -100.68 -93.42 -98.91 -99.66 -94.04 -107.84 -101.17 -100.43 -102.74 -97.74 -96.44 -101.56 -100.47 -101.42 -93.23 -91.71 -95.29 -95.84
19.76 255.30 58.88 39.85 95.33 387.86 218.17 49.28 80.22
1.64 21.19 4.89 3.31 7.91 32.20 18.11 4.091 6.66
Cumulative contribution 32.20 53.39 71.50 79.41 86.07 90.96 95.05 98.36 100.00
A2B1C1
1
Optimum combination of significant factor level Check on significant interaction
0
2
Sum of squares of difference (S) Contribution ratio (%)
Sum at factor level
AxC two-way table
32.20
21.19 18.11
7.91 6.66
4.89 4.09 3.31
1.64
[image:6.595.103.496.567.775.2]