JAY, Tim <http://orcid.org/0000-0003-4759-9543>, WILLIS, Benjamin
<http://orcid.org/0000-0002-4346-0459>, THOMAS, Peter
<http://orcid.org/0000-0003-3816-3158>, TAYLOR, Roberta
<http://orcid.org/0000-0002-2924-8216>, MOORE, Nicolas
<http://orcid.org/0000-0002-0829-5523>, BURNETT, Cathy
<http://orcid.org/0000-0001-6087-244X>, MERCHANT, Guy
<http://orcid.org/0000-0001-8436-7675> and STEVENS, Anna
<http://orcid.org/0000-0002-9450-890X>
Available from Sheffield Hallam University Research Archive (SHURA) at:
http://shura.shu.ac.uk/17014/
This document is the author deposited version. You are advised to consult the
publisher's version if you wish to cite from it.
Published version
JAY, Tim, WILLIS, Benjamin, THOMAS, Peter, TAYLOR, Roberta, MOORE, Nicolas,
BURNETT, Cathy, MERCHANT, Guy and STEVENS, Anna (2017). Dialogic Teaching
: Evaluation Report and Executive Summary. Project Report. London, UK, Education
Endowment Foundation.
Copyright and re-use policy
See
http://shura.shu.ac.uk/information.html
Evaluation report and executive summary
July 2017
Independent evaluators:
The Education Endowment Foundation (EEF) is an independent grant-making charity dedicated to breaking the link between family income and educational achievement, ensuring that children from all backgrounds can fulfil their potential and make the most of their talents.
The EEF aims to raise the attainment of children facing disadvantage by:
identifying promising educational innovations that address the needs of disadvantaged children in primary and secondary schools in England;
evaluating these innovations to extend and secure the evidence on what works and can be made to work at scale; and
encouraging schools, government, charities, and others to apply evidence and adopt innovations found to be effective.
The EEF was established in 2011 by the Sutton Trust as lead charity in partnership with Impetus Trust (now part of Impetus - Private Equity Foundation) and received a founding £125m grant from the Department for Education.
Together, the EEF and Sutton Trust are the government-designated What Works Centre for improving education outcomes for school-aged children.
For more information about the EEF or this report please contact: Danielle Mason
Head of Research and Publications Education Endowment Foundation 9th Floor, Millbank Tower
21–24 Millbank SW1P 4QP
p: 020 7802 1679
About the evaluator
The project was independently evaluated by a team from Sheffield Hallam University: Professor Tim Jay, Ben Willis, Dr Peter Thomas, Dr Roberta Taylor, Dr Nick Moore, Professor Cathy Burnett, Professor Guy Merchant, Anna Stevens
The lead evaluator was Professor Tim Jay.
Contact details:
Professor Tim Jay
Centre for Education and Inclusion Research, Sheffield Hallam University City Campus, Howard Street, Sheffield S1 1WB, UK
Email:
[email protected]
Contents
Executive summary ... 4
Introduction ... 6
Methods ... 13
Impact evaluation ... 21
Process evaluation... 31
Conclusion ... 44
References ... 47
Appendix A: EEF cost rating ... 49
Appendix B: Security classification of trial findings ... 50
Appendix C: Memorandum of understanding with participating schools ... 51
Appendix D: Letter to parents ... 55
Appendix E: Baseline Characteristics at Randomisation ... 58
Appendix F: Model Covariates ... 59
Appendix G: Case study findings ... 61
Appendix H: Analysis framework for case studies ... 71
Executive summary
The project
The aim of the intervention was to raise levels of engagement and attainment across English, maths, and science in primary schools by improving the quality of teacher and pupil talk in the classroom. The approach, termed ‘dialogic teaching’, emphasises dialogue through which pupils learn to reason, discuss, argue, and explain in order to develop their higher order thinking as well as their articulacy. The intervention was developed and delivered by a team from the Cambridge Primary Review Trust (CPRT) and the University of York. Year 5 teachers in 38 schools, and a teacher mentor from each school, received resources and training from the delivery team, and then implemented the intervention over the course of the autumn and spring terms in the 2015/2016 school year. Following the intervention, pupils were tested in English, mathematics, and science. This efficacy trial compared the 38 schools (2,492 pupils) in which the intervention took place with 38 control schools (2,466 pupils). During the intervention, the evaluation team also carried out a survey and interviews with a sample of teachers, mentors, and heads, plus case-study visits to three intervention schools.
EEF security rating
These findings have moderate security. The security rating of the trial indicates how confident we can be that any additional progress experienced by the children receiving the intervention was due to the intervention and not any other factors. This was an efficacy trial which tested whether the intervention can work under developer-led conditions.
This was a well-designed randomised controlled trial. Twenty-one percent of pupils were not included in the final analysis, primarily because seven out of thirty-eight schools in the intervention group failed to provide post-test data. However, the pupils who received the intervention were similar to the pupils in the comparison group on the characteristics that were measured. There is some evidence that schools implemented the intervention to varying extents, but not such that there was a threat to validity.
Additional findings
The process evaluation showed that the Dialogic Teaching approach was highly valued by participating schools. Teachers reported positive effects on pupil engagement and confidence. However, some
Key conclusions
1. Children in Dialogic Teaching schools made two additional months’ progress in English and science, and one additional month’s progress in maths, compared to children in control schools, on average. The three padlock security rating means we are moderately confident that this difference was due to the intervention and not to other factors.
2. Children eligible for free school meals (FSM) made two additional months’ progress in English, science, and maths compared to FSM children in control schools. The smaller number of FSM pupils in the trial limits the security of this result.
3. The intervention was highly regarded by headteachers, mentors, and teachers who thought that the Dialogic Teaching approach had positive effects on pupil confidence and engagement.
4. The majority of participating teachers felt that it would take longer than two terms to fully embed a Dialogic Teaching approach in their classrooms. It could therefore be valuable to test the impact of the intervention over a longer period.
5. This intervention requires teachers to change classroom talk across the curriculum, supported by training, handbooks, video, and regular review meetings with mentors. Future research could aim to differentiate the effects of these different elements.
schools also found the approach very challenging to implement within the two terms that this project lasted (autumn and spring terms 2015/2016). In fact, teachers felt that the impact evaluation was unlikely to show a positive effect on attainment for this reason. This means it is possible that the effect sizes observed in this evaluation are underestimates of the potential impact.
A follow-up to the impact evaluation will be carried out and reported in an addendum to this report, due to be published in 2018. The follow-up will test for an effect on pupil scores in Key Stage 2 national tests in English and mathematics.
Separate from this evaluation, the project team undertook analysis of video data from treatment and control schools in order to compare changes in teacher and pupil talk over time, supplemented by interviews with teachers, mentors, and heads. Interim findings are included in the process evaluation section, and complete findings will be published separately following this report.
Cost
[image:7.595.71.533.364.668.2]The cost has been estimated as £52 per pupil per year. In addition to this financial cost, up to 17 days per year of teaching cover could be required per school. This includes 11 days for the training (3 days per teacher, 4 days for the mentor, and 1 day for the headteacher), and 6 days for the planning and review meetings within school. In this project, this time was mostly met from schools’ existing cover and planning arrangements.
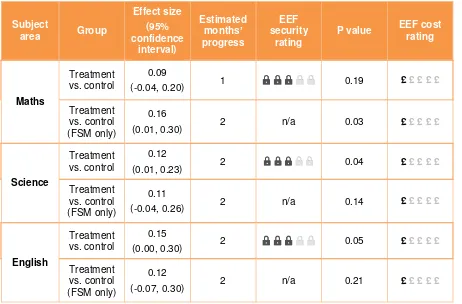
Table 1: Summary of impact on primary outcomes
Subject
area Group
Effect size (95% confidence interval) Estimated months’ progress EEF security rating
P value EEF cost
rating
Maths
Treatment vs. control
0.09
(-0.04, 0.20) 1 0.19 £ £ £ £ £
Treatment vs. control (FSM only)
0.16
(0.01, 0.30) 2 n/a 0.03 £ £ £ £ £
Science
Treatment vs. control
0.12
(0.01, 0.23) 2 0.04 £ £ £ £ £
Treatment vs. control (FSM only)
0.11
(-0.04, 0.26) 2 n/a 0.14 £ £ £ £ £
English
Treatment vs. control
0.15
(0.00, 0.30) 2 0.05 £ £ £ £ £
Treatment vs. control (FSM only)
0.12
(-0.07, 0.30) 2 n/a 0.21 £ £ £ £ £
Introduction
Intervention
The Dialogic Teaching intervention is designed to improve the quality of classroom talk as a means of increasing pupils’ engagement, learning, and attainment, particularly those from disadvantaged backgrounds. The programme builds on the dialogic teaching approach developed by Alexander (2015) and successfully implemented in several local authorities (Alexander 2003, 2005a, 2005b). The programme evaluated here was piloted in Barking and Dagenham in 2014/2015. It emphasises dialogue through which pupils learn to reason, discuss, argue, and explain, in order to develop their higher order thinking and articulacy.
The programme as evaluated here included training for teachers, ongoing in-school monitoring and support, a pack containing study and reference materials, and a development and mentoring manual. The intervention entailed a structured programme of 11 cycles arranged in two school terms, preceded by induction and training days. The core strategies were:
mentoring;
video and audio recording for self-evaluation and development; and
an iterative process of target-setting, implementation, recording, and review.
Schools were provided with all necessary equipment for video and audio recording—an essential parts of the process—and two days of cover per teacher was paid for time when participating teachers were away from their classrooms. The intervention was delivered by Cambridge Primary Review Trust and the University of York, with training led by Robin Alexander.
Although there is strong evidence that the dialogic teaching approach can improve motivation, engagement, participation, and reasoning, there has not yet been a U.K. randomised controlled trial to assess its effectiveness in raising attainment. The following, more detailed, description of the intervention follows the ‘Template for Intervention Description and Replication’ (Hoffman et al., 2014).
1. Brief name Dialogic Teaching.
2. Why (rationale/theory)
The intervention aimed:
• to maximise the quality and educational impact of classroom talk, building on prior work on dialogic teaching and on international evidence;
• to encourage a classroom culture that engages pupils in the task in hand and retains their attention and interest;
• to meet, but also go beyond, the requirements for spoken language in the national curriculum, giving particular attention to those kinds of talk through which pupils learn to reason, explain, justify, argue, speculate, evaluate, and in other ways think for themselves;
• to advance this higher-order talk across the curriculum, but devote particular attention to it in the teaching of English, mathematics, and science; and
• to raise pupils’ standards of attainment in literacy, numeracy, and science above the levels that teaching without such an intervention is likely to achieve.
3. Who (recipients)
delivery team with Year 5 teachers, a nominated school mentor, and the headteacher, alongside materials and resources and ongoing in-school monitoring and support.
4. What (materials)
Participating schools receive a range of resources from the delivery team to foreground the principles of dialogic teaching and to support the professional development of participants and their colleagues. In addition, schools receive audio-visual recording equipment to facilitate the recording of classroom talk—a vital element of the project’s strategy.
Every participating teacher, mentor, and school head was provided by the project team with the following resources:
The CPRT/University of York Dialogic Teaching Project, trial stage 2015/2016, ‘Handbook for schools’. The handbook sets out the programme’s aims, rationale, and strategies, specifies in detail the programme to be followed over the two terms, cycle by cycle, and provides extensive lesson transcript material to exemplify the various repertoires of teacher and pupil talk to which the intervention is directed.
Separate booklet containing monitoring forms for each planning/review cycle, for completion during mentor meetings.
Alexander, R. J. (2015) Towards Dialogic Teaching: rethinking classroom talk, (4th edition, 2015 reprint), York: Dialogos. This presents the approach and evidence on which the project is chiefly based, and lists additional professional sources and resources.
Michaels, S. and O’Connor, C. (2012) Talk Science Primer, Boston MA: TERC. This book details teacher talk moves through which pupil talk can be extended and built upon in one subject, science.
Alexander, R. J. (2015) ‘Dialogic Teaching Repertoires’: a laminated card summarising, from the two publications above, the talk repertoires which the project aims to explore, foster, and improve.
All participants had access to materials on the project website, including most of the publications above and two specially-prepared video presentations shown at the induction sessions:
Dialogic Teaching. This contains a sequence of clips of teachers and pupils talking, with commentary. It is structured into sections dealing with dialogic teaching repertoires and moves.
Video Recording in Classrooms. This provides basic advice on how to make good quality video and audio recordings for use during the project.
In addition to the above, each mentor received a copy of:
Finally, for the recording of classroom talk every school was provided with the following project audio-video equipment:
Panasonic HC-W570EB-K Full HD Camcorder with Twin Camera Olympus VN-732PC 4Gb Digital Voice Recorder
Hama Start 61 Tripod
Transcend 64 GB Premium SDXC Class 10 Memory Card Batteries
Camera case
5. What (procedures)
Year 5 teachers were asked to run 11 planning/review/refocusing cycles with their classes, six in phase 1 (‘Expanding repertoires’) and five in phase 2 (‘Advancing dialogue’)—meaning the entire intervention programme lasts for 20 weeks across two terms. During phase 1 (‘Expanding repertoires’), the focus was on increasing and enhancing the different kinds of talk used by teachers and pupils. During phase 2 (‘Advancing dialogue’) the focus was on applying the repertoires within a six-week programme in English, mathematics, science, and one non-core subject. Each cycle had two foci—a ‘directed’ and ‘responsive’ focus. The directed focus was one that all teachers were expected to engage with during a given cycle, while the responsive focus represented an opportunity for teachers to adapt and develop the approach to suit the context of their own classroom. The specific requirements for each cycle are clearly set out in the project handbook but broadly speaking the project is incremental and progressive in that each cycle was designed to build on the cycles that went before it. Initially, ground rules for talk are established (for example, listen carefully, respect others’ ideas, don’t interrupt), then different teacher and pupil talk repertoires (for example, questioning, exposition, feedback, probing and building on pupil contributions, expanding pupil learning talk) are introduced and refined with a view to applying them in varied contexts (such as whole-class teaching, teacher-led small-group discussion, pupil-led small-group discussion, teacher-pupil one-to-one, and paired pupil to pupil). The intention of the project is that these repertoires should be applied across the curriculum, though within this project there was a particular focus on English, maths, and science.
6. Who (implementers)
The Dialogic Teaching approach is designed to be delivered by Year 5 class teachers within their regular lessons.
7. How (mode of delivery)
Year 5 teachers employ Dialogic Teaching as part of the normal Year 5 class timetable.
8. Where (location of the intervention)
The intervention took place in pupils’ usual classrooms.
9. When and how much (dosage)
The principles of Dialogic Teaching are intended to inform lesson delivery across the curriculum, with a particular focus on English, maths, and science. The programme runs for 20 weeks across two terms.
Delivery of the Dialogic Teaching project is based on eleven plan/review/refocus cycles. Each cycle has both ‘directed’ and ‘responsive’ foci as detailed in the Handbook for Schools (see point 5 above). The directed focus represents the compulsory core intended to ensure consistency and progression whereas the responsive focus allows additional opportunity for class teachers or mentors to attend to other aspects of talk as an extension or addition to the directed focus.
11. How well (planned)
In addition to the eleven plan/review/refocus cycles, the Dialogic Teaching project combines various additional strategies to help support and maximise implementation effectiveness. These include:
Training, induction and plenaries: a series of sessions led by the delivery team to help ensure understanding of the project aims and expectations across all participants.
July 2015—induction day for teachers, mentors and heads; September 2015—mentor training day;
December 2015—plenary day for mentors; and
May 2016—plenary day for teachers, mentors, and heads.
Video and audio recording: schools are provided with all necessary equipment for video and audio recording lessons. Recordings are used as baselines for future development and later comparison forming a key component of mentoring sessions.
Mentoring: each school appointed a mentor to support Year 5 teachers in planning and reviewing their project related activities. The mentoring relationship with teachers was intended to be one of peers, where professional learning is mutual and encourages open and non-judgemental discussion. Mentors were required to organise, for each of the eleven cycles, sessions for planning and review, working with their mentees either singly or jointly. Most opted to combine end-of-cycle reviews with planning of the next cycle, and for these purposes they usually brought the Year 5 teachers together so that they could share experiences and learn from each other. Playing and discussing video and audio footage from the cycle under review was an essential part of the process.
Professional study and discussion: participants are encouraged to read and discuss the ideas and theory on which the project is based. A comprehensive range of resources and materials are provided to participants as outlined above (section 4).
12. How well (actual): evidence of implementation variability
Aside from the early withdrawal of six schools shortly after randomisation, the process evaluation found there to be a high level of fidelity in relation to attendance of events led by the delivery team, broad adherence to the eleven planning/review/refocussing cycle format, and undertaking of mentor meetings. However, there was greater variability in terms of which resources and materials were engaged with, the duration of mentor meetings, and the extent to which Dialogic Teaching approaches were routinely applied within lessons across the full curriculum.
Background
The dialogic teaching approach has been strongly influenced by the work of Vygotsky and Bruner, two researchers with a focus on social and cultural aspects of learning and education. There are also strong links with Bakhtin, who may have first coined the term ‘dialogism’.
only includes children as part of an ‘Initiation-Response-Feedback’ (IRF) pattern. The IRF pattern can be seen in the classroom when a teacher asks a closed question (initiation) of a particular child, then the child provides an answer (response), then finally the teacher gives feedback for that answer (feedback). The IRF pattern may be repeated several times during a period of whole-class teaching. The IRF pattern, and monologic teaching in general, has been criticised for limiting the amount of talk with which pupils can meaningfully engage (Mercer, 1995). Dialogic teaching, on the other hand, involves talk that is cumulative, supportive, reciprocal, collective, and purposeful (Alexander, 2008). So, questions are structured to provoke thoughtful answers; answers prompt further questions and are seen as the building blocks of dialogue rather than its terminal point; and individual teacher-pupil and pupil-pupil exchanges are chained into coherent lines of enquiry rather than left disconnected (Alexander, 2008).
Alexander (2017) states that: “There are a number of related approaches that involve a focus on the development of classroom talk to promote learning. Though they share a commitment to raising the profile and power of classroom talk, and are often grouped under the umbrella terms ‘dialogue’ and ‘dialogic’, there are some important differences among them. Some of them focus more on the teacher’s talk (for example Wragg and Brown, 1993, 2001) and some on the pupils’ talk (such as Dawes, Mercer and Wegerif, 2004). Others, including the approach evaluated here, attend equally to both teacher and pupil talk, and to the relationship between them. In differentiating these various pedagogical approaches Lefstein and Snell (2014) show how they vary, not just in respect of strategy, but also in the way they reflect contrasting notions of dialogue’s nature and purposes. In parallel, Alexander (2001, 2008) draws on his transnational and cross-cultural research to show how approaches to classroom talk are shaped by culturally-embedded stances on teaching more broadly conceived, which he differentiates as ‘transmission’, ‘initiation’, ‘negotiation’, ‘facilitation’, and ‘acceleration’. The framework of Lefstein and Snell (2014) is helpful in distinguishing between different approaches. They identify four: dialogically organised instruction (Nystrand, 1997, 2006), exploratory talk (Mercer 2000, Mercer and Littleton, 2007), accountable talk (Resnick, Michaels and O’Connor, 2010), and dialogic teaching (Alexander, 2001, 2008).”1
Evidence for the effectiveness of dialogic teaching as a pedagogical approach can be found in research studies that have either made use of observation methods, or have involved small-scale intervention. Resnick, Asterhan and Clarke (2015) brings together a set of studies that provide a broad base of evidence for the effectiveness of structured dialogic teaching approaches in raising pupil attainment. Observational and quasi-experimental studies have been carried out that have explored the effects of implementing dialogic teaching in mathematics (Mercer and Sams, 2006), science (Mercer, Dawes, Wegerif and Sams, 2004; Mercer, Dawes and Staarman, 2009), and literacy (Reznitskaya, 2012). Such studies have shown interventions based on a dialogic teaching approach to be effective in increasing the quantity and quality of classroom talk, and in raising attainment. For example, Mercer and Sams (2006) report an evaluation of the Thinking Together intervention for mathematics learning in Year 5. This intervention led to substantial changes in classroom practice (seven teachers undertook the intervention, with 196 pupils), and significant gains in mathematics scores, with an effect size of +0.59. The Thinking Together intervention consisted of twelve lessons focusing on data handling, properties of numbers, and number sequences. Mercer and Sams (2006) is a good example of the evaluation that has been carried out on this approach to date: although positive effects were observed, the sample size was small, and the intervention focused on a particular section of one curriculum subject.
The Dialogic Teaching approach has influenced the development of the Philosophy for Children programme, which has been evaluated using a randomised controlled trial in a previous EEF project (Gorard, Siddiqui and Huat See, 2016). Children received, on average, one lesson per week of the Philosophy for Children course over one school year. This led to small improvements in mathematics and reading (effect sizes of +0.10 for mathematics, and +0.12 for reading), but no change in writing
scores, for the sample as a whole. However, pupils eligible for free school meals saw larger improvements, with effect sizes of +0.20 for mathematics, +0.29 for reading, and +0.17 for writing. The evaluation team for the project suggested that this could be an underestimate as the duration of the project may not have been enough for the full impact to be achieved.
The evaluation reported here represents a much larger study than has been carried out to date, both in terms of sample size and in curriculum coverage. The Dialogic Teaching intervention evaluated in this project aimed to improve the quantity and quality of classroom talk across the curriculum (including, but not exclusive to, mathematics, English, and science) over two school terms. This contrasts with studies mentioned above, such as Gorard, Siddiqui and Huat See (2016) where the intervention took place in one hour per week over one year and focused on discussion of philosophical questions, and Mercer and Sams (2006) where the intervention took place over the course of twelve lessons and focused on particular aspects of the mathematics curriculum.
Evaluation objectives
The research question guiding the impact evaluation was:
Does the Dialogic Teaching intervention improve pupil attainment in English, mathematics, and science after two terms?
A second question, “Does the Dialogic Teaching intervention improve pupil attainment in English and mathematics after 2 years”, will be answered in a forthcoming addendum to this report (expected 2018 publication).
The theory of change for this intervention suggests that changes in teaching practice will lead to increases in the quality of pupil engagement and pupil spoken language observable in the classroom. These changes in pupils’ responses to classroom activity are, in turn, predicted to raise levels of attainment in English, mathematics, and science.
With the process evaluation, we aimed to answer two related questions:
What are the relationships between the training programme, teachers’ changing practice, changing classroom interactions, and pupil outcomes?
Are there differences in the way that the intervention has been implemented by teachers in different schools?
In addition to this process evaluation, the project team undertook separate research assessing teachers’ changing practice using analysis of videos. Interim findings are covered in the process evaluation section of this report, and full findings will be published separately.
Ethical review
The evaluation study was approved by the Development and Society faculty ethics committee of Sheffield Hallam University. The ethics submission included those aspects of the study for which the evaluation team was directly responsible, including arrangements for administering post-tests, surveying and interviewing teachers and school leaders, and classroom observations.
parents included as Appendix D), so that parents of children in all participating classrooms were given the opportunity to withdraw their child from the study, including the post-test.
Project team
Project delivery team:
Professor Robin Alexander: co-director and intervention lead. Professor Frank Hardman: co-director and research lead. Dr Jan Hardman: discourse analysis lead.
Dr Taha Rajab: research fellow.
David Reedy, school liaison officer (pilot stage). Mark Longmore: school liaison officer (trial stage).
Evaluation team:
Professor Tim Jay: principal investigator.
Ben Willis: project manager, process evaluation.
Dr Peter Thomas: statistical lead.
Dr Roberta Taylor: process evaluation, case studies.
Dr Nick Moore: process evaluation, case studies.
Professor Cathy Burnett: adviser.
Professor Guy Merchant: adviser.
Anna Stevens: research associate.
Trial registration
Methods
Trial design
This trial employed a three-level (pupils within classes within schools) clustered RCT design. Randomisation2 was at school level, with half of the schools forming the intervention group and half of the schools forming a control group.
Schools in the control condition were asked to engage in ‘business as usual’ for the duration of the project. Once the project ended, schools in the control condition were invited to take part in the training sessions and to use the video and audio recording equipment necessary for introduction of a Dialogic Teaching approach in their classrooms. Training and equipment were offered with the proviso that the approach would not be used with pupils in Year 5 in the 2015/2016 academic year (Year 6 in 2016/2017). This was to avoid contamination prior to the analysis of KS2 outcomes from June 2017 national tests.
Participant selection
Schools within Leeds and Bradford local authorities, and Birmingham Education Partnership, were invited to participate in the trial. Recruitment was led by the delivery team (Robin Alexander from CPRT, supported by Mark Longmore from the University of York). Eligible schools were those having at least two Year 5 classes and a high proportion (over 20%) of children eligible for free school meals (‘FSM pupils’). The target number of schools was 80: 78 schools were recruited, with two pairs of these acting as federated schools, thus in this document we refer to 76 participating schools in total.
Informed consent was secured at two levels. Headteachers gave informed consent on behalf of their schools (Appendix C), and parents were given the opportunity to withdraw their children from the study (Appendix D).
Outcomes measures
Primary outcomes
The intervention is designed to raise attainment across the curriculum. The three primary outcome measures selected for this trial therefore addressed the three core subjects in the curriculum—English, maths, and science. For the intervention to be considered to have had an effect on attainment across the curriculum, there should be evidence of a positive effect on all three measures.
Pupils were randomised at classroom level to participate in one of the three post-test assessments. All pupils in the study completed one, and only one, assessment. This approach was taken as it reduced the testing burden on pupils and teachers without significantly reducing the statistical power of the analysis.
For each subject area—English, maths, and science—level 10 of the corresponding GL Assessment test, suitable for pupils in Year 5 in the summer term, was used. Each test is standardised for U.K. populations.
English attainment was measured using the Progress Test in English.3 This test provides measures of reading accuracy, fluency, and comprehension and was administered as a pencil
2 Strictly speaking, minimisation (used in this study) is not randomisation as it uses a deterministic process to assign
cases to groups. However, ‘randomisation’ is used throughout for simplicity.
and paper test in groups. The main body of the test was administered, excluding sections on spelling, punctuation, and grammar.
Maths attainment was measured using the Progress Test in Maths.4 This test provides measures of fluency in facts and procedures, fluency in conceptual understanding, and mathematical reasoning and problem solving. The main body of the test was administered, excluding the section on mental arithmetic.
Science attainment was measured using the Progress Test in Science.5 This test provides measures of knowledge, and ability to work scientifically in physics, chemistry, and biology. In this case the whole test was administered.
For the English and maths assessments, sections of the tests were excluded for two reasons. The main reason for excluding the spelling, grammar and punctuation, and mental arithmetic sections of the tests was that there was limited theoretical basis for a hypothesis linking attainment in these areas with the Dialogic Teaching intervention. The second reason was that these sections of the tests involved more complex administration on the part of the teacher (including the playing of recordings, and managing timings) which would mean that it would not be possible to administer the three tests concurrently within a classroom.
Participating teachers in all schools provided class lists to the evaluation team. These were used to assign children to each of the three tests: the first child on the list took the mathematics test, the second took English, the third science, the fourth maths, and so on. Packages of tests were distributed to schools with children’s names pre-printed on tests to ensure that children took the correct test. Tests were administered by pupils’ usual classroom teacher, following instructions provided by the evaluation team. Teachers identified a suitable time to carry out tests within the two-week window beginning 16 May 2016. The evaluation team kept a record of testing dates in all schools. Spot checks were carried out by the evaluation team in a random sample of ten schools to ensure that all instructions were followed. No inconsistencies were identified.
Tests were scored by GL Assessment. Scoring was blinded: assessors had no way of knowing which tests came from intervention schools and which came from control schools. For each measure, the raw, unstandardised, score was used in analyses. It was not possible to use standardised scores as not all sections of each test were completed. Separate analyses were carried out for each of the three primary outcome measures.
Secondary outcomes
Secondary outcomes are Key Stage 2 (KS2) point scores in English and maths. These tests will be taken by pupils in May 2017, approximately two years after the start of the intervention. Data will be obtained from the National Pupil Database when it becomes available (unamended data is expected to be available in September 2017). However, it is understood that the effects of the intervention are likely to be mitigated, and possibly compromised, by (a) change of teacher (from a teacher trained in Dialogic Teaching to one who is not) from Year 5 to Year 6, and (b) a change in pedagogy as pupils approach the KS2 SATs (less extended dialogue, more IRE and text-based teaching).
Analyses of KS2 scores will be included in a future publication, an addendum to this report.
The project team carried out their own evaluation of teacher and pupil talk in intervention and control schools, before and after the intervention. Interim findings from this evaluation are included below as
part of the process evaluation (the project team have produced an interim report as Alexander with Hardman, 2017).
Sample size
Power analyses for the determination of sample size were carried out using the Optimal Design application (Raudenbush, 2011). A power analysis for this three-level cluster RCT design—with 80 schools, two classes per school, and ten pupils per class—was carried out. We assumed that the Intra-Cluster Correlation Coefficient (ICC) for both class and school levels was 0.1 and that KS1 attainment scores (used as a baseline measure) accounted for 36% of the variance in the primary outcome measure (r = 0.6). The results of this analysis suggest an MDES (minimum detectable effect size) of approximately 0.25 with power of 0.8.
Power calculations were also carried out for this design for the subgroup of FSM pupils. Assuming two FSM pupils per class (~20%), and other assumptions as above, the MDES is approximately 0.42.
A sample size of 80 schools was therefore selected as an appropriate compromise to maximise the chance of observing an effect, should there be one, without compromising the quality of intervention delivery. A large number of additional schools would have been required to lower the MDES further. The project delivery team was able to recruit a total of 78 schools. Two pairs of these were acting as federated schools, thus in this document we refer to 76 participating schools in total.
Randomisation
Minimisation methods were employed in order to achieve balance across intervention and control groups. The MinimPy software package (Saghaei and Saghaei, 2011) was used. Minimisation was conducted by Prof Tim Jay, as principal investigator, and was carried out at school level. Schools were allocated to the treatment or control group using the minimisation method, based on the percentage of FSM pupils within each school, the percentage of pupils using English as an additional language (‘EAL pupils’), and school-level KS2 total point score in 2013/2014. For each variable entered into the minimisation procedure, a median split was used to designate schools as either ‘high’ or ‘low’ for that measure.
The minimisation produced a group of 38 intervention schools and 38 control schools.
A systematic sampling approach was employed in order to allocate all participating pupils to a test condition. Teachers provided class lists to the evaluation team in alphabetical order by surname. Pupils were then assigned alternately to the maths, English, or science test conditions, so that the first pupil on the list took the maths test, the second took English, the third science, the fourth maths, and so on.
Analysis
A statistical analysis plan was published in advance of this report.6
Primary intention-to-treat (ITT) analysis
The primary analysis of the impact of the intervention was a multilevel linear regression model of each primary outcome measure. These models had the primary outcome measure (maths, English, science attainment) as the dependent variable, with the following covariates included:
school level—membership of the intervention group;
pupil participant level—KS1 total point score (from NPD); and pupil participant level—FSM eligibility.
Modelling was conducted in stages—a main effects stage followed by an interaction stage. The main effects models included the intervention/control dummy variable along with the KS1 pre-test measure and FSM dummies. The main effects model assumed that any impact of the intervention was consistent across different participant subgroups (for example, FSM and non-FSM participants). To explore whether this was a reasonable assumption, interaction terms were introduced one at a time. The interaction terms included were:
FSM*intervention (isolating FSM participants who received the intervention). These models explored whether the impact of the programme depended upon FSM status. For example, the programme could have had a greater impact for FSM participants (indicated by a positive coefficient on the interaction term) or it might have a greater impact among non-FSM participants (negative coefficient on the interaction term).
KS1 point score*intervention (isolating the pre-test scores of intervention group participants). These models explored whether the impact of the programme under evaluation depended upon prior attainment (at KS1). For example, the programme might have had a greater impact among higher attainers (indicated by a positive coefficient on the interaction term) or among lower attainers (negative coefficient on the interaction term). If an interaction term was found to be statistically significant, a subgroup analysis was used to explore this in more depth.
Analysis was conducted using Stata v13.
Missing data
Missing data presents a problem for analysis, whether a pupil is missing a value for an outcome variable (post-test score) or for covariates (for example pre-test score). If outcome data is ‘missing at random’ given a set of covariates then the analysis has reduced power to detect an effect; if data is ‘missing not at random’ (for example, differential dropout in the intervention and control groups for unobserved reasons) then omitting these pupils (as in the primary ‘completers’ analysis) could bias the results. Imputing missing data could improve the robustness of the analysis and examine how sensitive the results are to alternative assumptions.
Seven schools from the intervention group did not return primary outcome measures data. This could potentially have biased the results of the primary analysis. Comparisons between the 31 intervention schools that returned data, and the 38 control schools, were carried out using t-tests for school-level variables including the proportion of pupils eligible for FSM, and 2013/2014 KS2 attainment. This provided a check on balance at post-test.
Secondary outcome analyses
An addendum to the main report will be completed in December 2017, including analysis of KS2 attainment.
At the end of the second year, we will again employ the three-level clustered design, with KS2 point scores for English and maths as outcome variables, KS1 scores as covariate, and experimental group and FSM eligibility as predictors. KS2 attainment tests will be taken by pupils in May 2017, approximately two years after the start of the intervention. Data will be obtained from the NPD when it becomes available (unamended data is expected to be available in September 2017).
On-treatment analysis
All schools that completed and returned primary outcome measures participated fully in the intervention. Therefore, analysis of primary outcome measures as described above will in itself constitute an on-treatment analysis.
For the secondary outcome analysis, an on-treatment analysis will be conducted that includes only those 31 schools that participated fully in the intervention for the two terms of the project.
Subgroup analyses
Subgroup analyses of FSM pupils were carried out for the primary analysis, and will be carried out for the secondary analysis. Tests for interaction were conducted to assess whether there were differential effects for FSM pupils relative to other pupils. An analysis of FSM pupils will be carried out whether or not there is a significant interaction as this is EEF’s target group.
Subgroup analyses of pupils with low prior attainment will be carried out for both primary and secondary analyses if a significant interaction is found. Tests for interaction will be conducted to assess whether there are differential outcomes for children with low prior attainment relative to other pupils.
Implementation and process evaluation
The evaluation team carried out a survey and interviews with headteachers, mentors, and teachers in intervention schools, plus detailed case studies, including classroom observation, of a sample of three intervention schools. In addition to these sets of data, the project delivery team also collected records of attendance at training events and evidence of schools’ completion of mentor meeting cycles.
The survey for headteachers, mentors, and teachers in intervention schools addressed research questions relating to the effectiveness of the training provided by the project delivery team, changes in teaching practice, and the perceived effects on classroom interactions, pupil engagement, attitudes, and attainment. Surveys emphasised aspects specific to each role, so, for example, the survey for teachers emphasised changes in pedagogy and pupil behaviour, the mentor survey included questions concerning the conduct of mentor meetings, and the survey for headteachers emphasised whole-school aspects of the intervention.
All classroom teachers, mentors, and headteachers in intervention schools were asked to complete these surveys. Completed surveys were returned by 12 headteachers, 16 mentors, and 24 teachers. Telephone interviews were carried out with six teachers, eight mentors, and three headteachers from a sample of eight intervention schools. These were designed to further probe the topics covered in the surveys. The sample for the interviews was selected at random from the set of schools that did not return completed surveys.
Case study methodology
This aspect of the process evaluation was designed to examine how the intervention was implemented in classrooms. Three schools were selected as case study schools, in collaboration with the project delivery team’s school liaison officer. Schools were selected as representative of those in which, from the perspective of the delivery team, the intervention had been working well. The selected schools represented inner city and suburban populations, and there was a diversity of ethnic backgrounds amongst the students.
School A
mentor at this school was the deputy head, and three experienced teachers were recruited to the project.
School B
This primary school is located on the edge of a small, post-industrial city. It is larger than average and has experienced a lot of recent growth. The proportion of pupils at this school eligible for pupil premium and for school action plus, as well as those with an SEN statement, is higher than most schools in the U.K. The majority of pupils come from a white British background. The deputy head took the role of mentor in this school and two experienced teachers were recruited to the project.
School C
This larger-than-average primary school is located in an inner-city area of one the U.K.’s largest cities. More than double the national average number of pupils at this school qualify for pupil premium support. Pupils at this school speak more than 30 different languages, and one in four arrives at school with little or no English. In school C, the mentor role was taken by a member of the senior management team at the school. In this school the project recruited three teachers, including one NQT.
An observation schedule was designed to focus on questions and dialogue in the classroom. This was not intended as a measure of the extent to which Dialogic Teaching had been implemented in classrooms, but as a framework to guide observers in their attention to features of Dialogic Teaching. An interview schedule designed to elicit teacher and mentor perceptions of the programme, and their views on its efficacy, was also prepared. Observation schedules were completed during the classes, and interviews and observations were either recorded and later transcribed, or notes were taken, depending on the school’s and teacher’s preferences. Documentary evidence, such as revised Schemes of Work, was also collected where available.
The data set was analysed using six questions based upon the project aims as set out in the ‘Handbook for the Development Phase Schools’ (Alexander and Hardman, 2014, p. 2).
What are the effects of the strategy for maximising the quality and educational impact of classroom talk using a Dialogic Teaching approach?
How has an environment which fosters pupil attention and interest been promoted in the case study schools?
What does the data-set tell us about talk which meets and goes beyond the requirements of the National Curriculum and what examples are there of pupils using talk to reason, explain, justify, argue, speculate, evaluate, and in other ways think for themselves?
What evidence is there of the Dialogic Teaching approach being used across the curriculum in the case-study schools?
What are the teachers’ and mentors’ perceptions of the ability of the programme to raise standards in literacy, oracy, and higher-order thinking?
What are the mentors’ views of the effectiveness of this model of professional development, its sustainability, and its potential to be scaled up?The project development team (the Cambridge Primary Review Trust with the University of York) carried out an in-house evaluation, which had two strands: an interview programme undertaken in intervention schools only, and a comparative analysis of videotaped lessons in both intervention and control schools. This work is separate from the evaluation carried out by the Sheffield Hallam University (SHU) team and has not been scrutinised or validated by SHU as independent evaluators. It will be published separately in full after this evaluation report. An interim analysis of lesson videos is reported under ‘Process Evaluation’ below. The paragraphs below are taken from the development team’s interim report (Alexander with Hardman, 2017).
“In order to assess the pedagogic impact of the intervention, lessons were video recorded in a sample of both the intervention and control groups. Lessons were recorded twice, so as to assess development and progress over time. Video recordings of a sample of English, maths, and science lessons were made (1) at the beginning of the trial (week beginning 21 September 2015) to provide a baseline and (2) towards the end of the trial (fortnight beginning 22 February 2016). Fifteen teachers from the intervention group and 11 from the control group agreed to be video-recorded. The intervention group teachers were self-selected in response to our request for volunteers at the July 2015 induction session. The control group teachers were then selected on the basis of school-to-school matching. Each teacher was recorded twice—in phase 1 and again in phase 27—yielding a theoretical total of 156 lessons (two English, two maths, and two science in each case). In fact, because not all of the designated teachers taught science, the total number of lessons recorded was 134 (67 in each phase). The resulting recordings were subjected to both quantitative and qualitative analysis (quantitative analysis only reported in this report).
For the quantitative analysis, some of the key verbal indicators of typical classroom talk, both dialogic and traditional, became the basis for a coding system that was piloted in a previous study before being finalised and applied to the trial stage video data. Coders were trained and checked to maximise coding consistency. The coding system for these was uploaded into the Observer XT 12.5 software (Zimmerman et al., 2009) in order to generate quantitative data from the coded acts and exchanges. These were then statistically analysed using SPSS. The analysis was undertaken twice for the purpose of cross-validation, first internally at the University of York, then externally by Kirkdale Geometrics.”
Costs
Cost information was provided by the development team for training sessions, equipment, and other resources based on a school with two Year 5 classes (the average in this trial).
Questions were also included in the survey carried out by the evaluation team in order to collect data regarding the amount of time required for mentor meetings and additional planning time for mentors and teachers.
Per-pupil costs were calculated with the assumption that there were 30 pupils in each class (and so 60 per school).
Timeline
Table 2 below summarises the main activities undertaken by the evaluation team and project delivery team relating to this trial.
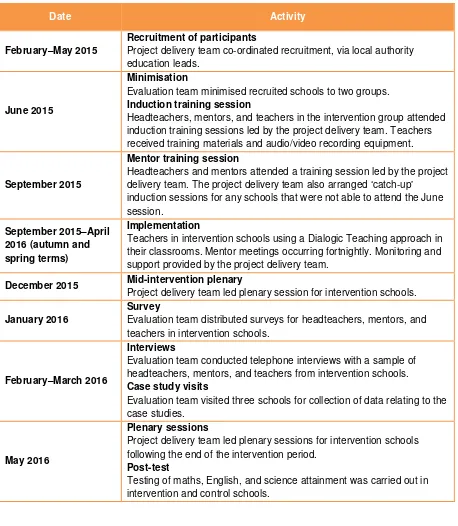
Table 2: Timeline
Date Activity
February–May 2015
Recruitment of participants
Project delivery team co-ordinated recruitment, via local authority education leads.
June 2015
Minimisation
Evaluation team minimised recruited schools to two groups. Induction training session
Headteachers, mentors, and teachers in the intervention group attended induction training sessions led by the project delivery team. Teachers received training materials and audio/video recording equipment.
September 2015
Mentor training session
Headteachers and mentors attended a training session led by the project delivery team. The project delivery team also arranged ‘catch-up’
induction sessions for any schools that were not able to attend the June session.
September 2015–April 2016 (autumn and spring terms)
Implementation
Teachers in intervention schools using a Dialogic Teaching approach in their classrooms. Mentor meetings occurring fortnightly. Monitoring and support provided by the project delivery team.
December 2015 Mid-intervention plenary
Project delivery team led plenary session for intervention schools.
January 2016
Survey
Evaluation team distributed surveys for headteachers, mentors, and teachers in intervention schools.
February–March 2016
Interviews
Evaluation team conducted telephone interviews with a sample of headteachers, mentors, and teachers from intervention schools. Case study visits
Evaluation team visited three schools for collection of data relating to the case studies.
May 2016
Plenary sessions
Project delivery team led plenary sessions for intervention schools following the end of the intervention period.
Post-test
Impact evaluation
Participants
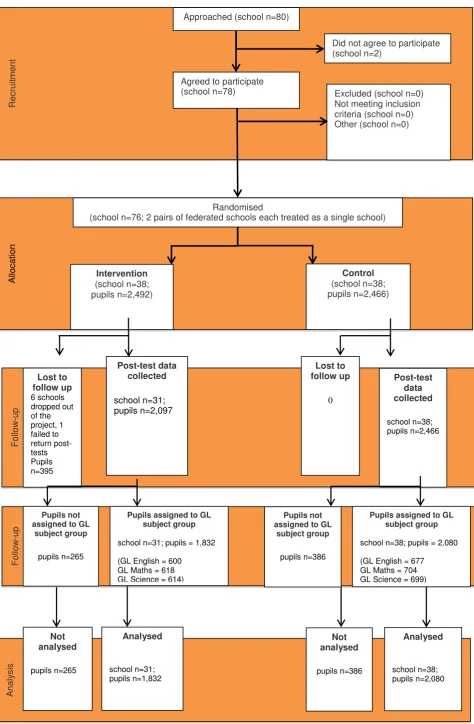
Figure 1 outlines the flow of participants during the course of the project. Six schools withdrew from the intervention group at a very early stage, before the intervention had begun, and a further school from this group completed the intervention but did not complete post-tests. Complete datasets were not available for 265 pupils in the intervention group and 386 pupils in the control group, either because post-tests were not completed (due to absence or opt-out), or because pupils for whom post-tests were returned by schools could not be matched with data from the NPD regarding KS1 attainment and FSM eligibility. In total, complete data was available for 1,832 pupils in intervention schools and 2,080 pupils in control schools.
Figure 1: Participant flow diagram Rec ru it m e n t Fo llo w -up Al lo c a ti o n
Agreed to participate (school n=78)
Randomised
(school n=76; 2 pairs of federated schools each treated as a single school)
Excluded (school n=0) Not meeting inclusion criteria (school n=0) Other (school n=0)
Intervention (school n=38; pupils n=2,492) Control (school n=38; pupils n=2,466) Approached (school n=80)
Did not agree to participate (school n=2) Lost to follow up 6 schools dropped out of the project, 1 failed to return post-tests Pupils n=395 Post-test data collected school n=38; pupils n=2,466 Not analysed
Analysed Not
analysed Analysed Post-test data collected school n=31; pupils n=2,097 Lost to follow up 0 Fo llo w -up
Pupils assigned to GL subject group
school n=31; pupils = 1,832
(GL English = 600 GL Maths = 618 GL Science = 614)
Pupils assigned to GL subject group
school n=38; pupils = 2,080
(GL English = 677 GL Maths = 704 GL Science = 699) Pupils not
assigned to GL subject group
pupils n=265
Pupils not assigned to GL
subject group
Table 3: Minimum detectable effect size at different stages Stage N [schools] (n=intervention; n=control) Correlation between pre-test (+other covariates) and post-test ICC Blocking/ stratification or pair matching Power Alpha Minimum detectable effect size (MDES)
Protocol 80 (40; 40) 0.60 0.10 minimisation 80% 0.05 0.25
Randomisation 76 (38; 38) 0.54 0.10
minimisation on FSM, EAL,
and KS2
80% 0.05 0.26
Analysis (i.e. available pre- and post-test)
69 (31; 38) 0.54 0.10
minimisation on FSM, EAL,
and KS2
80% 0.05 0.28
The MDES was calculated using Optimal Design software on the basis of a three-level cluster random design (schools, classes, pupils) with treatment at level three. Calculations were based on two classes per school and ten pupils per class. Inter-Class Correlations are on the basis of schools and classes.
[image:25.595.73.578.89.305.2]Baseline characteristics
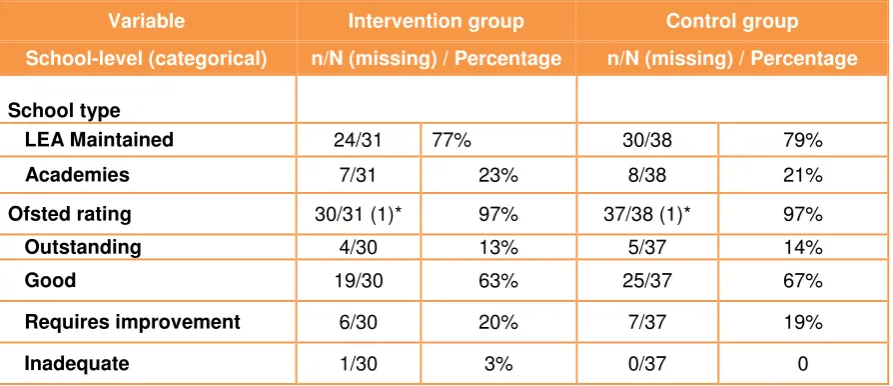
Table 4 summarises the school characteristics of the sample at the analysis stage. The obvious notable imbalance is that there are 31 intervention schools at the analysis stage compared to 38 at randomisation. The control group remains unchanged with 38 schools remaining (see Appendix E, Table 1 for further details). That said, there remain similar school characteristics between intervention and control schools at the analysis stage. There are similar distributions of Ofsted ratings between groups (and schools that dropped out of the intervention group had a similar distribution of Ofsted rating too—see Appendix E, Table 1). The table indicates that the percentages relating to pupils’ gender, SEN support status, and FSM eligibility are identical between the intervention and control groups. The one notable difference concerns EAL pupils: here, at school level, 53% of pupils in the intervention schools are categorised as EAL pupils compared to 47% in control schools. Across both groups, there is a high proportion of EAL pupils: this could have some implications for external validity.
Table 4: School characteristics at analysis (intervention 31 schools, control 38 schools)
Variable Intervention group Control group
School-level (categorical) n/N (missing) / Percentage n/N (missing) / Percentage
School type
LEA Maintained 24/31 77% 30/38 79%
Academies 7/31 23% 8/38 21%
Ofsted rating 30/31 (1)* 97% 37/38 (1)* 97%
Outstanding 4/30 13% 5/37 14%
Good 19/30 63% 25/37 67%
Requires improvement 6/30 20% 7/37 19%
[image:25.595.74.521.570.763.2]EverFSM 31/31 35% 37/38 35%
EAL 31/31 53% 37/38 47%
Pupils with SEN Support 31/31 16% 38/38 16%
Gender
Female 31/31 49% 38/38 49%
Male 31/31 51% 38/38 51%
[image:26.595.71.521.73.179.2]* Ofsted rating not available for 2 of the 76 schools. This is generally due to changes in status/name of a school. For example, when a school converts to Academy status, an Ofsted rating will not be available until it has been inspected after conversion.
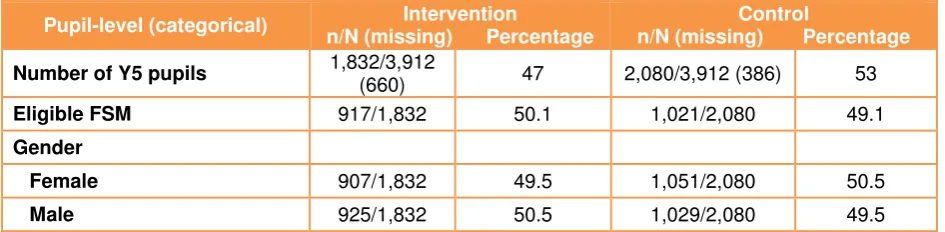
Table 5 summarises the pupil characteristics of the sample at analysis stage. The first point to note is that there are more pupils in the control group (53%) than the intervention group (47%), representing an imbalance from the original randomisation when pupils were split virtually 50/50 between intervention and control group (see Appendix E, Table 2). At randomisation there were 2,492 pupils in the intervention group and 2,466 in the control group. Of the former, 1,256 were FSM pupils (50.4%), 1,209 female (48.5%), and 1,283 male (51.5%). Of the 2,466 control group pupils, 1,221 were FSM pupils (49.5%), 1,227 female (49.8%), and 1,239 male (50.2%).
By analysis, the overall number of pupils in the intervention group had reduced from 2,492 to 1,832 (meaning 660 missing cases). Breaking this down by pupil category, FSM numbers reduced from 1,256 to 917 (339 FSM pupils not analysed), females from 1,209 to 907 (302 not analysed), and males from 1,283 to 925 (358 not analysed).
The overall number of pupils in the control group had reduced from 2,466 to 2,080 (386 missing cases). Breaking this down by pupil category, FSM pupils went down from 1,221 pupils to 1,021 (200 not analysed), females from 1,227 to 1,051 (176 not analysed), and males from 1,239 to 1,029 in the final analysis (210 not analysed).
In terms of pupils in the final analysis, the intervention group had a slightly higher proportion of boys than girls, whereas the control group had a slightly higher proportion of girls than boys. At 50.1% (intervention) and 49.1% (control), the proportion of pupils ever eligible for FSM was slightly higher in the intervention group. The assigning of pupils into GL Assessment tests is very similar between groups, with GL maths being the subject most pupils were assigned to for both groups, followed by science, and finally English—the only subject where pupils assigned to outcome measure falls below 33% for both intervention and control groups. In terms of the NPD KS1 mean scores, the control group is slightly higher than the intervention group both in terms of all pupils and when we account for ‘Ever FSM’ pupils only.
Table 5: Pupil characteristics at analysis (intervention 31 schools, control 38 schools)
Pupil-level (categorical) Intervention
n/N (missing) Percentage
Control
n/N (missing) Percentage
Number of Y5 pupils 1,832/3,912
(660) 47 2,080/3,912 (386) 53
Eligible FSM 917/1,832 50.1 1,021/2,080 49.1
Gender
Female 907/1,832 49.5 1,051/2,080 50.5
[image:26.595.71.544.641.757.2]Pupils assigned to GL subject
GL English 600/1,832 32.8 677/2,080 32.6
GL Maths 618/1,832 33.7 704/2,080 33.8
GL Science 614/1,832 33.5 699/2,080 33.6
Pupil-level (continuous) n (missing) Mean n (missing) Mean
NPD KS1 score 1,725 (107) 14.838 1,992 (88) 15.017
[image:27.595.73.540.73.190.2]NPD KS1 score (Ever FSM) 882 (35) 14.400 989 (32) 14.572
Table 6 examines the pupil-level baseline balance for those pupils included in each of the three outcome measures in order to explore potential bias introduced at assignment to outcome measure. In Table 5, we see that overall percentage of Ever FSM pupils in the intervention group is 50.1%. Exploring across outcome measures we can see there is only very minor variation across subjects (a range of 49.7% to 50.5%). The proportion of Ever FSM pupils in the control group is 49.1%. Exploring across outcome measures we can see there is slightly more variation across subjects (a range of 47.8% to 50.6%).
Similarly, for the intervention group the KS1 score for all pupils is 14.838. Exploring across outcome measures we can see there is only very minor variation across subjects (a range of 14.817 to 14.826). We also see this minor variation repeated for Ever FSM pupils. For the control group, the KS1 score for all pupils is 15.017. Exploring across outcome measures we can see there is minor variation across subjects, but again this is slightly more pronounced for the control group compared to the intervention group (a range of 14.894 to 15.090). We also see this minor variation repeated for Ever FSM pupils.
Table 6: Pupil characteristics by GL Assessment outcome measure Pupil-level by outcome
Categorical (GL English) n/N Percentage n/N Percentage
EverFSM 303/600 50.5 331/677 48.9
Female 318/600 53.0 348/677 51.4
Male 282/600 47.0 329/677 48.6
Pupil-level by outcome
Categorical (GL Maths) n/N Percentage n/N Percentage
EverFSM 307/618 49.7 356/704 50.6
Female 292/618 47.2 360/704 51.1
Male 326/618 52.8 344/704 48.9
Pupil-level by outcome
Categorical (GL Science) n/N Percentage n/N Percentage
EverFSM 307/614 50.0 334/699 47.8
Female 297/614 48.4 343/699 49.1
Male 317/614 51.6 356/699 50.9
Pupil-level continuous
(GL English) n (missing) Mean n (missing) Mean
NPD KS1 score 569 (31) 14.817 648 (29) 15.066
NPD KS1 score (Ever FSM) 294 (9) 14.337 320 (11) 14.759
Pupil-level continuous
(GL Maths) n (missing) Mean n (missing) Mean
NPD KS1 score 578 (40) 14.876 681 (23) 15.090
NPD KS1 score (Ever FSM) 290 (17) 14.500 347 (9) 14.473
Pupil-level continuous
[image:27.595.67.536.403.769.2]NPD KS1 score 578 (36) 14.821 663 (36) 14.894
NPD KS1 score (Ever FSM) 298 (9) 14.364 322 (12) 14.484
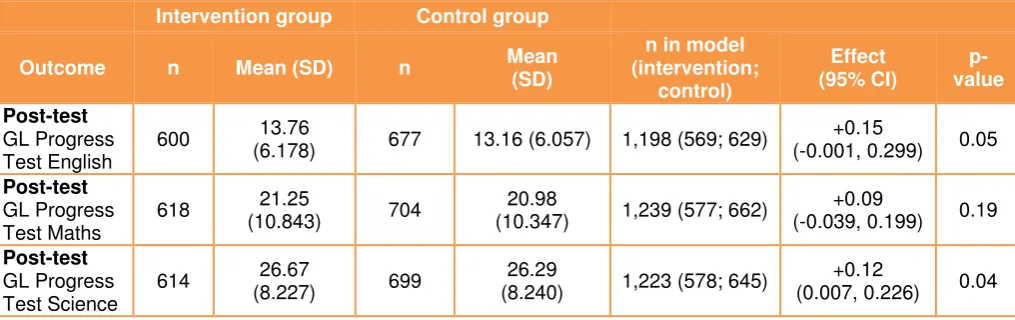
[image:28.595.69.577.180.340.2]Outcomes and analysis
Table 7: Primary analysis, controlling for KS1 prior attainment, pupil Ever FSM, and school-level variables—FSM eligibility, EAL, and KS2
Intervention group Control group
Outcome n Mean (SD) n Mean
(SD)
n in model (intervention; control) Effect (95% CI) p-value Post-test GL Progress Test English
600 13.76
(6.178) 677 13.16 (6.057) 1,198 (569; 629)
+0.15
(-0.001, 0.299) 0.05
Post-test GL Progress Test Maths
618 21.25
(10.843) 704
20.98
(10.347) 1,239 (577; 662)
+0.09
(-0.039, 0.199) 0.19
Post-test GL Progress Test Science
614 26.67
(8.227) 699
26.29
(8.240) 1,223 (578; 645)
+0.12
(0.007, 0.226) 0.04
The primary analysis of the impact of the intervention was a multilevel linear regression model of each primary outcome measure. These models had the primary outcome measure (GL maths, GL English, and GL science attainment) as the dependent variable, with the following covariates included:
school level (variables included in minimisation)—membership of the intervention group, percentage of FSM pupils within each school, percentage of EAL pupils, school-level average KS2 total point score 2013/2014;
pupil participant level—KS1 total point score (from NPD); and pupil participant level—FSM status.
The main effects model is used for the main results. This was constructed in two steps:
1. pupil participant variables—intervention/control dummy variable and KS1 attainment; and
2. as 1, but also including FSM status (pupil level) and the school-level variables included in minimisation (% FSM; % EAL, and school-level KS2 attainment).
The second step represents the models that will be used for the main results for the three primary outcomes for this trial. The first step is included for sensitivity and so that the findings can be comparable across different trials. Covariate tables are reported in Appendix F.
Effect sizes for a cluster randomised trial using total variance can be calculated as:
Main effects stage
When examining the main effects models—controlling for prior attainment, pupil FSM and school-level FSM eligibility, EAL and KS2 (reported in Table 7)—there is a statistically significant result for science. The post-test marks for the intervention group in GL science were 0.38 units higher than the control. It is unlikely that this result has happened by chance (p = 0.04). There was a modest effect size of +0.12. It should be noted that this was lower than the minimum detectable effect size (MDES) calculated in the power analysis. However, it is important to note that the power calculations in Table 3 are based on the correlation between KS1 prior attainment pre-test and post-test only, not all variance explained by covariates in the primary analysis model. Given that statistically significant results reported in the main effects stage occurred when we introduced the school-level minimisation covariates this is likely to account for why we find some statistically significant results in the primary analysis but have a higher MDES in the power calculations.
There is a cautiously positive result for English. The post-test marks for the intervention group in GL English were 0.59 units higher than the control. The results are very close to being called statistically significant but we cannot discount the possibility that this result has happened by chance (p = 0.051). There was a modest effect size of +0.15. Again, this was lower than the minimum detectable effect size (MDES) calculated in the power analysis.
The post-test marks for the intervention group in GL maths were 0.27 units higher than the control. We cannot discount the possibility that this result has happened by chance (p = 0.19). There was a low effect size of +0.09.
Sensitivity analysis
When examining the main effects models considering intervention and control dummy, and controlling for KS1 prior attainment only, modest effect sizes were shown for GL English (+0.14), GL maths (+0.08), and GL science (+0.08) and it is not possible to rule out chance as an explanation for the effect observed. Thus, for the three main outcomes, there were no statistically significant results when observing intervention and prior attainment only.
Turning to sub-group analysis for free school meals pupils, when observing only intervention and prior attainment, again there were only modest effect sizes shown for GL English (+0.12) and GL science (+0.10) and it is not possible to rule out chance as an explanation for the effect observed. However, the effect for GL maths (1.39 units higher than the control, effect size +0.16) can be reported as statistically significant (p = 0.02).
Sub-group analysis
The analyses performed for the full data were repeated for the subgroup of FSM pupils (using EverFSM).
For FSM pupils, modest effect sizes were shown for GL English (+0.12) and GL science (+0.11) and it is not possible to rule out chance as an explanation for the effect observed. However, the effect for GL maths (1.39 units higher than the control, effect size +0.16) can be reported as statistically significant (p = 0.03). Again, this was lower than the MDES calculated in the power analysis. Table 8 summarises the outcomes for FSM pupils. In Table 8